warwick.ac.uk/lib-publications
Original citation:McGlade, Christophe, Pye, Steve, Ekins, Paul, Bradshaw, Michael J. and Watson, Jim. (2018) The future role of natural gas in the UK : a bridge to nowhere? Energy Policy, 113 . pp. 454-465.
Permanent WRAP URL:
http://wrap.warwick.ac.uk/98568
Copyright and reuse:
The Warwick Research Archive Portal (WRAP) makes this work by researchers of the University of Warwick available open access under the following conditions. Copyright © and all moral rights to the version of the paper presented here belong to the individual author(s) and/or other copyright owners. To the extent reasonable and practicable the material made available in WRAP has been checked for eligibility before being made available.
Copies of full items can be used for personal research or study, educational, or not-for-profit purposes without prior permission or charge. Provided that the authors, title and full bibliographic details are credited, a hyperlink and/or URL is given for the original metadata page and the content is not changed in any way.
Publisher’s statement:
© 2018, Elsevier. Licensed under the Creative Commons Attribution-NonCommercial-NoDerivatives 4.0 International http://creativecommons.org/licenses/by-nc-nd/4.0/
A note on versions:
The version presented here may differ from the published version or, version of record, if you wish to cite this item you are advised to consult the publisher’s version. Please see the ‘permanent WRAP url’ above for details on accessing the published version and note that access may require a subscription.
1
The future role of natural gas in the UK: a bridge to nowhere?
Christophe McGladea,c*, Steve Pyea,c,e, Paul Ekinsa,c, Michael Bradshawb,c, Jim Watsonc,d
a University College London (UCL) Energy Institute, Central House, 14 Upper Woburn Place
London WC1H 0NN
b Warwick Business School , The University of Warwick, Coventry, CV4 7AL c UK Energy Research Centre, 11 Princes Gardens, London, SW7 1NA d SPRU, University of Sussex, Falmer, East Sussex, BN1 9SL
e MaREI Centre, Environmental Research Institute, University College Cork, Cork, Ireland
* Corresponding author [email protected]
Abstract
The UK has ambitious, statutory long-term climate targets that will require deep
decarbonisation of its energy system. One key question facing policymakers is the role of
natural gas during both the transition towards, and in the achievement of, a future
low-carbon energy system. Here we assess a range of possible futures for the UK, and find that
gas is unlikely to act as a cost-effective ‘bridge’ to a decarbonised UK energy system. There
is also limited scope for gas in power generation after 2030 if the UK is to meet its emission
reduction targets, in the absence of carbon capture and storage (CCS). In such as case, gas
use in 2050 is estimated at only 10% of its 2010 level. It also follows that a ‘second dash for
gas’ while providing short-term gains in reducing emissions, is unlikely to be the most
cost-effective way to reduce emissions, and could result in stranded assets and compromise the
UK’s decarbonisation ambitions. However, with significant CCS deployment by 2050, natural
gas could remain at 50-60% of the 2010 level, primarily in the industrial (including hydrogen
production) and power generation sectors.
2
1 Introduction
Natural gas has the lowest combustion carbon intensity of the three major fossil fuels (see
e.g. IPCC (2006)). However, it has been shown that increases in the consumption of natural
gas are not sufficient for reducing global greenhouse gas emissions since this would
potentially substitute for both higher-carbon fossil fuels, e.g. coal or oil, as well as for
lower-carbon or zero-lower-carbon energy sources, such as renewables (McJeon et al., 2014). (McGlade
et al., 2014) and (McGlade and Ekins, 2015) examined possible futures for fossil fuels, with a
particular focus on the ‘bridging’ role that natural gas may be able to play during a transition
to a global low-carbon energy system. This research found that there is a good potential for
gas to act as a transition fuel to a low-carbon future up to 2035 on a global level, but only
under certain conditions.
However, a key caveat to the positive conclusion that natural gas can play a ‘bridging’ role
globally is that its potential varies significantly between different regions. Therefore while
some national-level studies have demonstrated that increases in natural gas consumption,
in combination with certain emissions-reduction policies, can help reduce overall
greenhouse gas emissions in the United States (Brandt et al., 2014; Moniz et al., 2010), it
does not follow that this is the case in all countries and regions around the world. It is also
noteworthy that the International Energy Agency’s ‘Golden Age of Gas’ scenario that
explored a future with more natural gas in the global energy system resulted in projected
emissions on a trajectory consistent with a temperature rise of 3.7oC (IEA, 2011), well above
the internationally-agreed threshold of below 2oC(United Nations, 2015).
One crucial factor affecting the decarbonisation potential of natural gas is the level of
3 distribution. This has been an ongoing source of controversy since the first paper on the
subject by (Howarth, 2014; Howarth et al., 2011) suggested that such emissions from shale
gas extraction were so high that they counteracted all benefits of switching from coal to gas,
although multiple papers subsequently contested these findings (Lawrence et al., 2011; Levi,
2013; O’Sullivan and Paltsev, 2012). Nevertheless, it is important to recognise that the UK’s
long-term decarbonisation objectives (see section 2.2 below) include only ‘territorial
emissions’, or emissions generated within the country. Any fugitive methane from natural
gas produced by the UK is included within its territorial emissions but imported gas is
effectively ‘carbon-neutral’ from an upstream emissions perspective (the UK imported 45%
of its gas in 2014). An increase in domestic gas production, such as from its putative shale
gas resource (Andrews, 2013) might have lower life-cycle emissions than other sources of
imports, such as Liquefied Natural Gas (LNG) (MacKay and Stone, 2013). But it is important
to recognise that any fugitive emissions from domestic production would augment the UK’s
territorial emissions, potentially making it harder to achieve the UK’s domestic
decarbonisation objectives.
In the UK, natural gas accounted for 34 % of total primary energy consumption in 2015; of
that 30% was used in the generation of electricity and heat by power stations; 37 % by
households, mainly in heating buildings, and the remainder by industry and other users
(BEIS, 2016). Climate change policies are a key dynamic that will affect future levels of gas
consumption but (Bradshaw et al., 2014) also highlighted the myriad of technological,
economic, and policy factors that will affect gas consumption in the UK and put these into a
global context. The range of uncertainties around these factors means that how large
4 elsewhere, depends on the assumptions about these factors and therefore remains an open
question. This is illustrated in the UK context by the recent Future Energy Scenarios,
developed by the national gas system operator (National Grid, 2016). They imply a lower
consumption by 2030 under all cases, even those that do not meet the UK climate ambition,
with a stronger reduction under the Gone Green scenario of around 25%. However, they
also point to substantial quantities of gas still being required in the 2030s.
Here we use the energy system models UKTM (Daly et al., 2015) and ESME (Heaton, 2014;
Pye et al., 2015b) to examine changes in the role of gas in the UK under a range of future
energy scenarios. We use two alternative models here for different reasons. First, the two
models are better suited to constructing different types of scenarios. ESME allows for the
exploration of a large number of simulations, under a wide set of parametric uncertainties.
This allows for a better assessment of the range of possible pathways, and a more
systematic assessment of under what conditions different pathways emerge for natural gas.
This would have not been possible in UKTM, which is a more complex model, with a more
detailed representation of the energy system. UKTM includes a resource-upstream sector,
with a more detailed characterisation of domestic gas production, processing and
distribution, and imports. It also captures the GHG emissions across the energy system,
important given the methane emissions associated with gas production and distribution.
Finally, end use sectors which use gas, the CCS system, and hydrogen production all have
enhanced detail compared to ESME. Secondly, the set-up and assumptions within these
models vary and so we avoid drawing firm conclusions based only on a single model.
In discussing the central question of this paper, whether or not gas can act as a ‘bridge’ fuel,
5 consistent with maximum 2 oC temperature average global warming, gas consumption
should increase either absolutely from 2010 or relative to another scenario that does not
meet this temperature constraint. More specifically:
Natural gas acts a ‘relative’ bridge in a region (or globally) when total consumption is
greater in some period in a scenario consistent with at 2 oC temperature rise, relative
to a scenario that contains no GHG emissions reduction policies.
Natural gas acts as an ‘absolute’ bridge in a region (or globally) when total
consumption rises above current levels over some period until it reaches a peak and
subsequently enters a permanent or terminal decline.
The remainder of this paper is organized as follows; section 2 describes the modelling
approach and the scenario framing. Section 3 follows with a presentation of the results from
both models. Section 4 develops the discussion around the modelling insights, before
drawing some key conclusions around the future role of gas in the UK.
2 Modelling approach and scenarios constructed
This section gives a brief overview of the two energy system models that have been used for
the analysis – UKTM and ESME – and the scenarios that will be implemented with each.
These models have some features in common – within physical and technical constraints,
they optimise energy system development over time (minimising energy system cost or
maximising a measure of social welfare) by assuming rational decision making by a central
policy planner who has perfect information about the future. While the model frameworks
necessarily provide a proxy representation of the actual energy system and its evolution,
6 response to drivers such as fuel prices and emissions limits – and some of the trade-offs and
choices that could be important. A detailed description of the two models used in this paper
is provided in Appendix A.
2.1 Energy system models
ESME (Energy Systems Modelling Environment), developed by the Energy Technologies
Institute (ETI), is a fully integrated energy systems model, used to determine the role of
different low carbon technologies required to achieve the UK’s mitigation targets. The
model has been used in this capacity by the former UK Department for Energy and Climate
Change (DECC), now known as the Department for Business, Energy and Industrial Strategy
(BEIS), and the UK Committee on Climate Change (CCC) (CCC, 2013, 2010; DECC, 2011a). The
model uses linear programming to assess cost-optimal technology portfolios. Uncertainty
around cost and performance of different technologies and resource prices is captured via a
probabilistic approach, using Monte Carlo sampling techniques. Gas extraction, production
and distribution, and the associated emissions from this sector, are not represented
explicitly, nor is there a distinction between domestic and imported gas resources. Further
information is provided in Appendix A. The limited representation of domestic gas
production and distribution, and associated CH4 emissions, means that the methane
emissions penalty that would be incurred under stringent climate policy is not accounted
for.
The UK TIMES energy system model (UKTM) is based on the model generator TIMES (The
Integrated MARKAL-EFOM System), which is developed and maintained by the Energy
7 (Loulou and Labriet, 2007). UKTM is a technology-oriented, dynamic, linear programming
optimisation model representing the entire UK energy system (as one region) from imports
and domestic production of fuel resources, through fuel processing and supply, explicit
representation of infrastructures, conversion to secondary energy carriers (including
electricity, heat and hydrogen), end use technologies and energy service demands. Like
other models of this type, as noted above, it minimizes the total welfare costs (under
perfect foresight) to meet the exogenously given sectoral energy demands and thereby
delivers an economy-wide solution of cost-optimal energy market development. Distinctive
from the ESME model, all GHGs associated with the energy system are accounted, including
CH4 emissions from domestic production and distribution of natural gas. For gas and other
energy commodity imports, only emissions at the point of use are accounted, as per the
territorial or production basis for inventory accounting.
2.2 Scenarios constructed
ESME is well suited to exploring the effects of uncertainty on future energy and emissions
pathways. We therefore use this strength here to explore the effects of uncertainty in
technology investment costs in the power and transport sectors, fuel costs and resource
potential (e.g. biomass imports), on future levels of gas consumption in the UK under
different emissions assumptions. In the context of these uncertainties, recognising that
there are others we have not included, we explore three specific scenarios that have been
shown previously to have a large effect on the levels of gas consumed. These three
8 (i) A reference case which is required to meet the 4th carbon budget (a 50%
reduction on 1990 emission levels by 2025) but with no other explicit
requirements to reduce greenhouse gas (GHG) or CO2 emissions thereafter;
(ii) An 80% GHG emissions reduction by 2050 case in which CCS is permitted; and
(iii) An 80% GHG emissions reduction by 2050 case in which CCS is not permitted.
A detailed description of the uncertainties explored is provided in (Pye et al., 2015b) and
summarised in Table 1 below. A Monte-Carlo simulation process is used to explore these
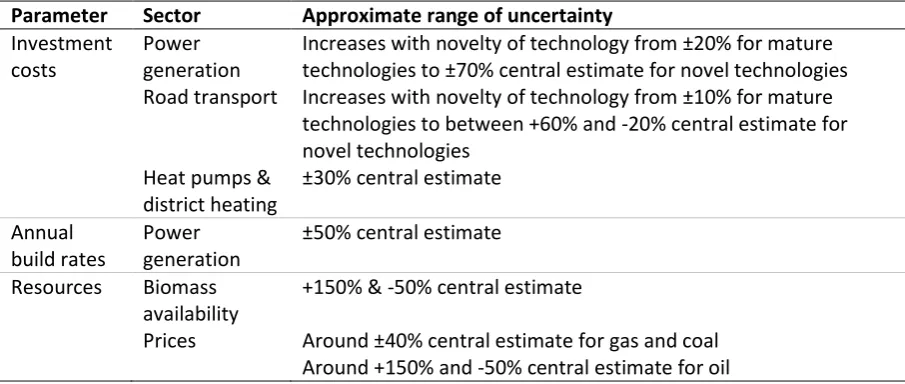
[image:9.595.72.525.363.555.2]uncertainties with 250 runs implemented for each of the above three scenarios.
Table 1: Areas of uncertainty explored in ESME runs
Parameter Sector Approximate range of uncertainty
Investment costs
Power generation
Increases with novelty of technology from ±20% for mature technologies to ±70% central estimate for novel technologies Road transport Increases with novelty of technology from ±10% for mature
technologies to between +60% and -20% central estimate for novel technologies
Heat pumps & district heating
±30% central estimate
Annual build rates
Power generation
±50% central estimate
Resources Biomass availability
+150% & -50% central estimate
Prices Around ±40% central estimate for gas and coal Around +150% and -50% central estimate for oil
UKTM has a more detailed representation of the UK energy sector than ESME. It is therefore
more complex, and represents certain features of the energy system better, including
resource and upstream sectors, GHG emissions including CH4, and range of technologies in
end use sectors. This more detailed representation means that there is a consequent
better-9 defined but discrete scenarios. These scenarios are described in detail in Appendix B, with
some of the key assumptions that vary across each of the above scenarios are set out in
Table 2.
The first, called ‘Abandon’ assumes that climate change policy is downgraded in importance
during the late 2010s, meaning that limits on emissions beyond the 3rd carbon budget
(2018-22) are not implemented. Because of a relative lack of emphasis internationally on
moving away from fossil fuels, and consequently higher overall demand, thus the price of
fossil fuels is relatively high in this scenario. The second, Insular, scenario also assumes that
climate change policy is downgraded in importance during the late 2010s. Following the
recent decision to leave the EU, this scenario models a shifts towards a more inward looking
energy policy with, for example, much less electricity connection to the European continent.
Strict limits are placed on imports in favour of domestic fossil fuel (including new coal and
shale gas) and renewable resources, and prices of fossil fuels are relatively high as a result.
The Affordable scenario continues with commitment to climate change targets well into the
2020s. However, since the world is not acting sufficiently quickly to reduce emissions, this
commitment starts to falter. Policies to support the deployment of renewables are
progressively scaled back as is policy support for nuclear and CCS. In the Maintain scenario,
the UK continues its commitment to the long-term climate change targets (i.e. 80% GHG
emissions reduction by 2050). This drives down the costs of many low-carbon technologies
and energy efficiency measures, including CCS which is successfully commercialised and
‘rolled out’ (after 2025) alongside other low carbon technologies. Since the world shifts
10 The Maintain (tech fail) scenario is similar to Maintain, but there is a failure of efforts to
commercialise CCS technologies. More emphasis is therefore placed on other forms of
mitigation to meet UK targets such as renewables, nuclear power and energy efficiency.
These latter two scenarios are also required to keep within a cumulative level of emissions
between 2028 (the end of the 4th carbon budget period) and 2050. This ensures that there is
a steady progression towards the 2050 target and is used as a proxy for future carbon
budgets to be set by the Committee on Climate Change. Since the analysis undertaken in
this paper, the proposed level of the 5th carbon budget, for the period 2028-2032 has been
agreed, setting reductions (including international shipping) at 57% below 1990 levels (CCC,
2015). Both of these scenarios see reductions in this budget period at levels slightly lower
[image:11.595.70.528.479.723.2]than set out in the 5th carbon budget.
Table 2: Core assumptions varied across the UKTM scenarios. Under required emissions reduction, ‘Carbon Budgets’ refer to the 5 year periods across which average emission reductions have to be achieved, and which get progressively more ambitious over time to ensure the UK is on track to meet the long term 2050 reduction ambition.Thelatest agreed 5th Carbon Budget period will run between 2028-2032, and is near achieved in both Maintain scenarios.
Scenario Name Required GHG emissions reduction Technology availability Fossil fuel prices Import dependency Abandon
35% reduction by 2020 (meets 3rd Carbon Budget only)
No new coal
Nuclear delay High
Outcome of the model
Insular
35% reduction by 2020 (meets 3rd Carbon Budget only)
Max
interconnector 4 GW
High
Max 30% primary energy in 2020, falling to 5% by 2030
Affordable
50% reduction by 2025 (meets 4th Carbon Budget only)
60% reduction by 2050
Slow renewables deployment Delay in new nuclear Delay in CCS
Low Outcome of the model
Maintain
80% reduction by 2050 (meet all legislated Carbon Budgets, and 2050 target)
11
Maintain (tech failure)
80% reduction by 2050 (meet all legislated Carbon Budgets, and 2050 target)
No new coal
No CCS Central
Outcome of the model
3 Results
3.1 ESME results
Gas consumption in the three core ESME scenarios is presented in Figure 1 which shows the
implications of the uncertainties set out in Table 1. The maximum and minimum of these
uncertainty ranges describe the 10th to 90th percentiles of consumption from the 250 runs in
each time period i.e. the bottom of the range is defined by consumption in the 25th lowest
run and the top by consumption in the 225th lowest (or 25th highest) run.
Median gas consumption in the reference case (that meets the 4th carbon budget) initially
falls out to 2020 before rising rapidly between 2030 and 2040 and finishing at 4,250 PJ (115
Bcm), a 10% increase on 2010 levels. The uncertainty spread also grows over time from
around 25% of the median value1 in 2030 to over 60% by 2050.
12
Figure 1: UK gas consumption in the three core ESME scenarios. Top left: Reference case where only the climate ambition set out in the 4th Carbon Budget (2023-2027) is met. Top right: 80% reduction case meeting the UK legislated Carbon Budgets and 2050 target with CCS technologies available for deployment. Bottom: 80% reduction case but without CCS deployment. In all plots, the number of simulations run is 250. The light shaded areas represent the 10th to 90th percentile ranges, dark shaded areas the 33rd to 66th percentile ranges, and solid lines the medians. The left hand axis has units in PJ, and the right hand axis in Bcm.
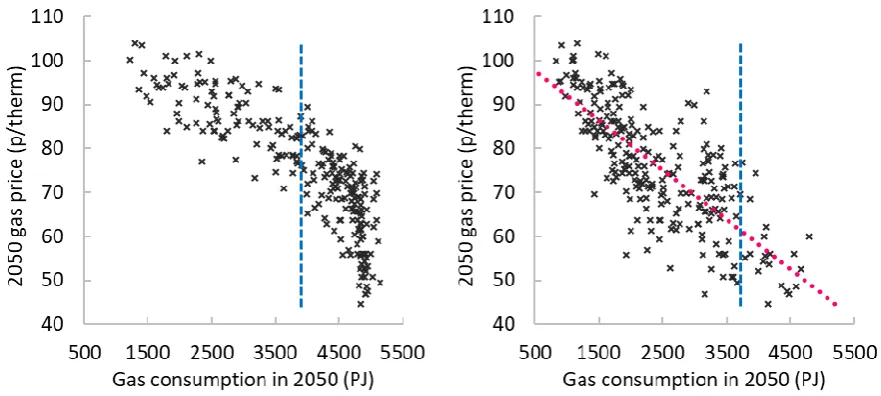
Figure 2 (left panel) gives the relationship between gas consumption in the Reference
scenario and gas prices in 2050 and it can be seen that consumption does not increase much
above 4,900 PJ (130 Bcm) regardless of the assumed gas price level. This ‘saturation level’
13 of household fuel (this could be 5 to 10% higher if there was no penetration of district
heating), and all Heavy Goods Vehicles (HGVs) are converted to run on natural gas. As a
result, there is little additional market share that gas can gain.
In the 80% reduction case with CCS, the median consumption initially falls but is then largely
flat to 2040 at just over 3100 PJ (around 85 Bcm) before exhibiting a large drop in the final
period and thus ending up 40% below 2010 levels. The uncertainty spread up to 2030 is
similar to that in the reference case but thereafter it grows rapidly to over 100% by 2050.
This rapid growth in uncertainty can be explained by the larger range of new technology
options that are available to the model in latter periods (such as conversion to hydrogen,
use with CCS in the power sector), but the wide spread in the costs and rates at which these
can be built. The changing manner in which gas is used out to 2050 is explored in more
[image:14.595.79.520.434.632.2]detail in the discrete UKTM scenarios below.
14 Comparing the median of the two scenarios it is again apparent that after 2020,
consumption is always lower in the 80% reduction case than in the reference case. Despite
the small rise over 2030-2040 in the ‘with-CCS’ scenario (a period in which CCS can start to
be deployed at scale), the predominant downward trend of the median throughout the
modelling period suggests that the ESME model finds little potential for gas to act as a
bridge in the UK in an optimal trajectory towards a low-carbon energy system.
Nevertheless, it can also be seen that there is significant overlap between the uncertainty
distributions for these two scenarios. Consumption in some of pathways towards the upper
end of the distribution in the 80% reduction case with CCS is not significantly lower than
2010 levels. In general, these occur whenever gas prices are low and the technology options
(e.g. hydrogen production or industrial use w/CCS) that can utilise gas as an input have
favourable cost and build rate assumptions. Figure 2 (right panel) indicates that future gas
levels in the 80% reduction case are closely (albeit not perfectly) correlated to assumed gas
prices. If gas prices remain low (below around 60p/therm out to 2050), and there is
sufficient technological innovation, including implementation of CCS, it could be possible for
gas consumption in 2050 to be at similar levels to those in 2010 whilst still meeting the UK’s
emission reduction goals.
Finally, gas consumption for the 80% reduction case without CCS exhibits a sharp decline
over the modelling period, and reaches less than 500 PJ (15 Bcm) by 2050. There is also
almost no uncertainty spread despite utilising the same range of uncertainties that were
explored in the previous two scenarios. This demonstrates that if CCS is not available, these
uncertainties have next to no effect on the level of gas consumption. Reaching the UK’s
15 prices, power and end-use sector build rates and investment costs, gas must be steadily
phased out over the next 35 years and thus be almost entirely removed from the UK energy
system by 2050.
This is not only because gas cannot itself be used with CCS in this scenario, which clearly
restricts its use when CO2 emissions reductions are required, but also because
decarbonisation of all secondary and end-use sectors is much harder to achieve without the
use of CCS. Sectors that may continue to rely upon unabated gas consumption in the 80%
reduction case with CCS therefore have to work additionally hard to reduce emissions. Gas
is no longer useful as these sectors must shift to other low or zero carbon sources.
3.2 UKTM results
The detail of the differences in the use of gas over time and between scenarios can be best
examined using the discrete runs implemented in UKTM. In this section we focus initially on
the three scenarios that miss the long-term 80% reduction goal (Section 3.2.1), next turning
to those that meet this goal (Section 3.2.2), and then finally comparing these to examine the
extent to which gas can act as a bridging fuel (Section 3.2.3).
16
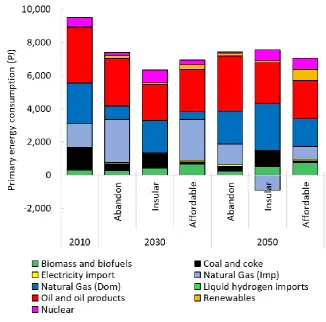
Figure 3 and Figure 4 present the changes in primary energy consumption and sectoral
changes in gas consumption in the Abandon, Insular, and Affordable scenarios: those that
are not required to reduce emissions by 80% by 2050. Primary energy consumption in all
scenarios in 2030 is at least 22% lower than in 2010, although it then stays relatively
17
Figure 3: Primary energy consumption (PJ) in UKTM scenarios failing to meet 2050 carbon targets.
Scenarios not meeting 2050 targets include abandon, insular, and affordable. Natural gas is split into domestic production (Dom) and net imports (Imp). Negative net imports under Insular in 2050 can be interpreted as exports.
Abandon exhibits the smallest drop to 2030 in overall primary energy consumption, much of
which is due to a reduction in coal consumption. Abandon also has the smallest change in
the level of gas consumption and in the way it is consumed. Despite dropping by nearly 20%
between 2010 and 2015, gas consumption after 2015 remains broadly constant. There is a
reduction in use in centralised gas generation over time, but this loss is compensated for by
an increase in the use of combined heat and power (CHP) units in both the residential and
industrial sectors. As a result, gas use in the residential sector actually increases steadily
18 In 2030 primary energy consumption in Affordable is relatively similar to that in Abandon
with slightly less coal consumption and higher levels of renewables and nuclear, but these
differences are small. Both cases show a strong push towards imported gas in the 2030s,
and then a large share towards domestic in the longer term, due to some exploitation of
shale (as imported prices make this resource viable). The largest difference is in gas
consumption, which exhibits a steadier decrease over time despite the availability of cheap
gas. As the need for a 60% reduction in emissions by 2050 is most cost-effectively met by
the decarbonisation of electricity, existing gas generation capacity is retired and is not
replaced. Consequently, between 2030 and 2050 gas use in centralised generation exhibits
the largest drop seen in any sector. In the residential sector there is a 1%/year average
decline in gas use made possible initially through efficiency measures and latterly by a small
degree of electrification of heat.
Insular displays the largest changes of the three scenarios in both 2030 and 2050. Given the
need to rely predominantly on domestic sources of energy production, there is a much
greater (and rapid) uptake in efficiency measures. Primary energy consumption is therefore
15% lower than in Abandon in 2030. Coal consumption is also significantly different, and
this is the only scenario in which coal maintains its current share of primary energy
consumption of around 15% throughout the model horizon; in all other scenarios, coal
drops to less than 5% by 2030 (and less than 2% in the Maintain scenarios discussed in the
next section). Between 2010 and 2030 total domestically produced gas use falls by 50%,
with gas entirely removed from the electricity sector, and residential sector consumption
19 Bcm) with all sectors continuing to maintain their levels of consumption. A small level of
[image:20.595.127.468.133.377.2]exports can be observed in 2050, as shale production increases.
Figure 4: Sectoral gas use in UKTM scenarios failing to meet 2050 carbon targets. Scenarios not meeting 2050 targets include abandon, insular, and affordable. The left hand axis has units in PJ, and the right hand axis in Bcm.
3.2.2 Focus on 80% reduction targets
Figures 5 and 6 next display primary energy consumption and sectoral gas consumption in
the two core scenarios that meet the UK’s long-term emission reduction targets. Over the
medium-term differences in energy consumption between these two scenarios and
between the scenarios described above do not appear too large. For example, primary
energy consumption in 2030 in both scenarios is 27% below 2010 levels, broadly similar to
the reduction in Affordable and at a greater level than was seen in Insular. It is unsurprising
that Maintain and Maintain (tech fail) are comparable in 2030 because the only difference
20 Maintain in 2025. Coal is effectively eliminated in both scenarios, but with a small fraction
[image:21.595.142.456.134.437.2]remaining in energy-intensive industries.
Figure 5: Primary energy consumption in UKTM scenarios that meet the UK’s 2050 carbon targets.
Scenarios meeting 2050 targets include maintain and maintain (tech fail). Natural gas is split into domestic production (Dom) and net imports (Imp).
Turning to gas consumption, which is increasingly met by imports due to higher production
costs in the UK, between 2010 and 2030 60% of the drop seen in both scenarios results from
falls in the electricity sector, with smaller drops in industry (accounting for 15% of the total
drop) and residential (20%). There is, however, significant construction of new CCGT
capacity throughout the 2020s (7.5 GW in Maintain (tech fail), 10 GW in Maintain),
although less than the 22 GW installed in Affordable. Despite this new plant, and the loss of
21 gas consumption) remain broadly flat in both Maintain scenarios. While it is therefore
cost-effective to construct some new efficient CCGT plants, this mainly serves to replace existing
coal and CCGT plant. Coal-to-efficiency and coal-to-renewables is found to be a more
cost-effective solution than coal-to-gas substitution. Since Affordable, which fails to meet the
long-term 80% reduction target, has a much greater level of coal-to-gas switching, this
highlights a potential risk of relying predominantly on coal-to-gas switching in the power
sector to meet the 2025 emissions reductions.
A small increase in the use of gas in transport can also be seen in both Maintain scenarios in
the medium term, reaching a maximum of 100 PJ in Maintain and 170 PJ in Maintain (tech
fail). In both cases there is some uptake of CNG in Light (LGV) and Heavy Goods Vehicles
(HGV). In both of these scenarios, this growth in CNG occurs while the technology market
for hydrogen matures and by 2050 in both scenarios, all HGV service demands are satisfied
by hydrogen. Possible alternatives for the road freight sector include biofuels and electric
vehicles. However, electrification of freight at scale was not an option due to battery size
and range issues (although recent developments in the market mean this assumption should
be questioned). On biofuels, bioenergy tends to be allocated for use in industrial and
electricity sectors, particularly in combination with CCS2; therefore, this leaves a limited
supply for domestic biofuel production.
2 Often referred to as BECCS (bioenergy with CCS). The system gets an emissions credit or negative emission
22
Figure 6: Sectoral gas use in UKTM scenarios that meet the UK’s 2050 carbon targets. Scenarios meeting 2050 targets include maintain and maintain (tech fail). The left hand axis has units in PJ, and the right hand axis in Bcm.
Over the long-term to 2050, there are much starker differences both between these two
scenarios and with the scenarios described above. Similar to what was seen in the ESME
scenarios above, it is clear that without CCS, gas is again almost entirely removed from the
UK energy system. What remains in Maintain (tech fail) is predominantly used in industry
(most of which is as a petrochemical feedstock or in non-energy uses) and as back up to the
intermittency of renewables in the power sector (installed gas capacity is used at less than
5% load factor). Overall consumption is less than 450 PJ (12 Bcm), a 90% reduction on 2010
levels.
In Maintain, there is a significant decrease in residential sector consumption, as this sector
increasingly electrifies with heat pump technologies, and increases district heating
23 industry, namely the steam methane reforming (SMR) of natural gas to produce hydrogen.
Crucially, this SMR is carried out in combination with CCS so that the overall level of
emissions that occurs is vastly reduced. Hydrogen in this context provides a useful vector for
decarbonising decentralised service demands, predominantly transport (as discussed above)
and industry, in approximately equal proportions. This technology is entirely absent in all
other scenarios examined, demonstrating the necessity of both emission reduction goals,
and the availability of CCS if gas for hydrogen production is to have any role in the future UK
energy system.
There again continues to be some use of gas in the electricity sector, both as back up to
renewable intermittency and as centralised CCS plant, although with only 2 GW of gas CCS
capacity installed in the final period, this latter role is marginal. There is also continued
reliance (around 300 PJ or 8 Bcm) on gas in industry, although as above, the majority of this
is as use as a feedstock for petrochemicals and in non-energy uses. The emergence of
hydrogen in the industry sector in latter periods impinges on the use of gas, as well the use
of biomass, which is more usefully deployed elsewhere.
Gas use in the residential and service sectors (Buildings in Figure 6) exhibits a rapid decline
between 2030 and 2050 in this scenario. It is only after 2035, as the 80% target becomes
increasingly difficult to meet, that the majority of changes occur in the use of gas in
buildings. This delayed action in respect of buildings poses challenges for emissions
reduction policies. Continued use of gas is a very cost-effective way to provide heating in
buildings, not least because all the necessary infrastructure has already been deployed over
the past number of decades. Shifting to an alternative energy source, such as widespread
24 distribution system), improved system balancing (to deal with a much larger peak demand),
new technologies across households, and the development of new markets. It is apparent
that alternatives are cost- effective only at higher CO2 prices (i.e. when the reduction targets
are increasingly stringent) and so only start to be adopted at a significant scale after 2035.
Replacing nearly all of the gas used in buildings with alternatives, including with district
heating but more significantly heat pumps, within a 15-year period is in reality extremely
ambitious,3 and would require significant development of infrastructure and market
capacity beforehand to achieve. In reality, it is likely that the transition away from the
consumption of gas in buildings will need to be underway in the mid-2020s. Key strategic
decisions will need to be made concerning residential heating, as Government, the network
operator, and utilities, in consultation with consumers, work through the different options,
which also include serious consideration of hydrogen supply to buildings, which would allow
for the existing gas pipeline infrastructure to be maintained (CCC, 2016).
3.2.3 Gas as a bridge
We can use the above UKTM results to address the question as to whether or not gas can
act as a bridging fuel towards a low-carbon UK energy system (Figure 7). Despite a small rise
(<3%) in Maintain between 2015 and 2020, and a very slightly higher level of consumption
(<4%) in the 2020s in Maintain compared with Abandon, gas consumption is lower in
Maintain in all subsequent periods and falls continuously from 2020.
3 For comparison, the natural gas appliance replacement programme required for moving from town gas to natural gas
25 Looking back to the requirements to classify gas as a bridge set out earlier, it is apparent
that gas acts as both a relative and absolute bridge only over the period 2015-20. Thereafter
it soon falls below the level of gas consumption in both Abandon and in 2010. However,
given that the absolute and relative increases in consumption between 2015 and 2020 are
so slight, and since ESME did not exhibit any similar such increases, we conclude that, on
our definitions of the term, there is practically no potential for gas to act as a bridge to a
[image:26.595.124.477.293.515.2]low-carbon economy in the UK.
Figure 7: Gas consumption over time in Abandon, Maintain, and Maintain (tech fail). The left hand axis has units in PJ, and the right hand axis in Bcm.
There is, nevertheless, some small potential for gas to act as a bridge fuel in specific niche
sectors. For example, as noted above, in both Maintain and Maintain (tech fail) there is
some uptake of CNG in LGVs and HGVs. This is also seen in Affordable but not in either of
the other two non-80% reduction scenarios. At its peak, nearly 35% of HGVs are CNG in
26 transport grows in both Maintain scenarios out to 2040, compared with both 2010 and
Abandon, it could therefore be reasonable to argue that natural gas can act as a bridge in
[image:27.595.77.521.197.525.2]the freight sector.
Table 3: Summary of scenario results
Scenario Name
GHG emission reductions (rel. to 1990)
Gas consumption level, PJ (% relative to 2010)
Key observations
2030 2050 2030 2050
Abandon -35% -33% 3,407 (88%) 3,223 (83%)
Limited reductions due to lack of either climate or security concerns. No increases due to higher gas price assumptions.
Insular -46% -43% 1,924 (50%) 1,900 (49%)
Rapid reduction in gas use by 2030 driven by energy security
concerns, with a strong shift towards domestic gas, including shale in the longer term.
Affordable -50% -60% 2,920 (75%) 2,442 (63%)
Stronger reductions than abandon due to higher climate ambition. Post 2030, more limited decline as climate ambition fails to
strengthen.
Maintain -53% -80% 2,579 (67%) 1,779 (46%)
Strong reductions by 2030 driven by climate ambition. These continue to 2050 although
considerable gas remains in system due to CCS.
Maintain (tech failure)
-53% -80% 2,262 (58%) 439 (11%)
Large reductions by 2050 in the absence of CCS, and under stringent climate policy.
4 Discussion and conclusions
Both the ESME modelling and the UKTM Maintain and Maintain (tech fail) scenarios make it
clear that meeting the 2050 target will constrain the role for natural gas in the UK’s energy
system in the 2020s and beyond. The nature of that role is dependent on other
27 efficiency improvement, demand reduction and the scale of renewable energy—and the
availability of key technologies. The ESME results make clear the significance of CCS to
keeping gas in the power generation mix and certain sectors of industry. Without CCS gas
must be steadily phased out over the next 35 years and almost entirely removed by 2050.
This represents a major challenge in relation to the decarbonisation of domestic heat and
undermines the economic logic of investing in new CCGT gas power generation capacity.
The Maintain and Maintain(tech fail) scenarios see a significant drop in the role of gas in
the electricity sector (60%) and smaller drops in industry and the residential sector in the
2020s. In the electricity sector, the observed fall in coal generation is more cost-effectively
replaced by increased end use sector efficiency and strong growth of renewables in the
generation mix. It is only in the 2030s and beyond that the two scenarios differ significantly.
The absence of CCS in Maintain(tech fail) —in keeping with the ESME results—means that
gas must eventually be almost entirely removed from the energy system. What remains is
used by industry and sparingly as back-up to renewable intermittency. Interestingly, the
Maintain scenario keeps a significant amount of gas with CCS in the mix by finding a new
role for it in the production of hydrogen. In the Maintain scenario, in addition to gas being
used as a back-up for intermittency in the power sector, the availability of CCS permits some
centralised CCS plant, and gas is used as a feedstock in industry. This scenario suggests that
under certain conditions a significant amount of gas consumption (40-50 Bcm, or 50% of
current levels) can still be compatible with the 2050 target.
Our analysis makes clear that determining the future role for gas in the UK is not a
straightforward matter. A simple decision to shut down all coal-fired power generation by
28 ‘lock in’ a significant amount of gas-fired capacity that would only be able to operate at very
low load factors in the 2030s and beyond, unless retrofitted with CCS. It is questionable
whether or not investors could be persuaded to build this capacity without very strong
policy incentives, if load factors were even lower than they are now. Incentivising them to
do so—for example via a capacity market—might not be the most cost-efficient solution.
Those resources (the cost of which would ultimately end up on consumer bills) might be
better used by replacing that lost coal capacity with additional energy efficiency and
demand reduction measures and/or additional renewable energy capacity. The analysis also
makes clear the centrality of CCS to retaining gas in the power generation mix and certain
sectors of industry. Without CCS, demand falls dramatically in the 2030s and beyond,
making it even harder to justify investing in new gas-fired power generation.
Two final notes of caution: First, timing is everything. Delays in commissioning a new fleet of
nuclear power stations and/or a slow-down in the deployment of renewable forms of
energy—particularly in a context of no coal-fired generation after 2025—may increase the
future role of gas to levels that are not compatible with the existing carbon budgets,
particularly in the absence of CCS. Thus, what happens in the 2020s is critical in determining
the path of the UK‘s energy system in the 2030s and beyond. It is important to avoid a high
carbon ‘lock in’ that would either cause carbon targets to be missed, or leave significant
amounts of infrastructure stranded due to a costly and rapid drive to a lower carbon system
in the 2040s. Second, our scenarios show that the UK debate should not be reduced to a
choice between a future with gas and a future without it. Our Maintain scenario
demonstrates that a significant amount of natural gas can still be consumed beyond 2030—
29 ‘soft landing’ for the gas-fired power generation sector that keeps sufficient capacity on the
mix as its role changes. In addition, alternatives to the use of gas outside the power sector,
particularly in heating homes, need to be explored urgently. It is not clear that current
policies will achieve this, which highlights the lack of a clear vision of the future role for gas
in the UK’s low carbon energy system.
The take-home message is clear. If all coal-fired power generation is to be removed by 2025,
and the opportunity for CCS is delayed by Government inaction or lack of global progress on
commercialisation, then policy makers must think very carefully about how best to replace
that capacity. A ‘second dash for gas’ may provide some short term gains in reducing
emissions. However, our modelling suggests that this is not be the most cost-effective way
to reduce emissions and, in the absence of CCS technologies, it may well compromise the
UK’s decarbonisation ambitions.
Finally, for other countries, gas may provide a stronger transition role, particularly in those
systems in which coal dominates, and where solutions are being sought to reduce CO2
emissions and tackle air pollution (McGlade et al., 2014). However, even in such countries,
careful consideration will need to be given to the longer term outlook for gas, such as we
have outlined here for the UK, since significant gas infrastructure investment is likely to be
required to push coal effectively out of the energy mix, investment that could be left
stranded if decarbonisation deeper than that offered by coal-to-gas switching is found to be
necessary.
In the context of the UNFCCC process, such issues are particularly pertinent, as countries
30 long term low GHG emission development Strategies.4 The role of natural gas in the future,
and decisions concerning investment in new infrastructure will need to be carefully
considered to avoid lock-in, given the level of ambition required under the Paris Agreement.
International cooperation on the development of CCS systems will be critical to reduce
uncertainty and allow for consideration of natural gas continuing to play a significant role in
the energy system in the 2040s and 2050s.
Acknowledgements
This paper was produced as part of the research programme of the UK Energy Research
Centre, supported by the UK Research Councils under EPSRC award EP/L024756/1.
References
Andrews, I.J., 2013. The Carboniferous Bowland Shale gas study: geology and resource estimation. London, UK.
BEIS, 2016. Digest of United Kingdom Energy Statistics 2016.
Bradshaw, M.J., Bridge, G., Bouzarovski, S., Watson, J., Dutton, J., 2014. The UK’s global gas challenge. UKERC: The UK Energy Research Centre.
Brandt, A.R., Heath, G.A., Kort, E.A., O’Sullivan, F., Pétron, G., Jordaan, S.M., Tans, P., Wilcox, J., Gopstein, A.M., Arent, D., 2014. Methane leaks from North American natural gas systems. Science (80-. ). 343, 733–735.
CCC, 2016. Next Steps for UK Heat Policy. London.
CCC, 2015. The Fifth Carbon Budget: The next step towards a low-carbon economy. London. CCC, 2013. Meeting Carbon Budgets – 2013 Progress Report to Parliament. London, UK.
CCC, 2010. The Fourth Carbon Budget: Reducing Emissions through the 2020s. The Committee on Climate Change (CCC), London, UK.
CCC, 2008. Building a low-carbon economy – the UK’s contribution to tackling climate change. London, UK.
Daly, H.E., Scott, K., Strachan, N., Barrett, J., 2015. Indirect CO2 Emission Implications of
4In accordance with Article 4, paragraph 19 of the Paris Agreement,
31 Energy System Pathways: Linking IO and TIMES Models for the UK. Environ. Sci.
Technol. 49, 10701–10709. doi:10.1021/acs.est.5b01020
DECC, 2016. Impact Assessment for the level of the fifth carbon budget.
DECC, 2013. UK Greenhouse Gas Inventory 2010: common reporting format tables, Submission 2013 v1.1. London.
DECC, 2011a. The Carbon Plan. London, UK.
DECC, 2011b. Digest of United Kingdom Energy Statistics 2011.
DTI, 2007. The MARKAL Energy Model in the 2007 Energy White Paper. London, UK. Ekins, P., Anandarajah, G., Strachan, N., 2011. Towards a low-carbon economy: scenarios
and policies for the UK. Clim. Policy 11, 37–41. doi:10.3763/cpol.2010.0126
ETI, 2016. ESME Data References Book.
Fais, B., Keppo, I., Zeyringer, M., Usher, W., Daly, H., 2016. Impact of technology uncertainty on future low-carbon pathways in the UK. Energy Strateg. Rev. 13–14, 154–168.
doi:10.1016/j.esr.2016.09.005
Heaton, C., 2014. Modelling Low-Carbon Energy System Designs with the ETI ESME Model. Howarth, R.W., 2014. A bridge to nowhere: methane emissions and the greenhouse gas
footprint of natural gas. Energy Sci. Eng. 2, 47–60. doi:10.1002/ese3.35
Howarth, R.W., Santoro, R., Ingraffea, A., 2011. Methane and the greenhouse-gas footprint of natural gas from shale formations. Clim. Change. doi:10.1007/s10584-011-0061-5 IEA, 2011. World Energy Outlook 2011. Paris.
IPCC, 2006. 2006 IPCC Guidelines for National Greenhouse Gas Inventories. IGES, Japan.
doi:http://www.ipcc-nggip.iges.or.jp/public/2006gl/pdf/2_Volume2/V2_3_Ch3_Mobile_Combustion.pdf
Kannan, R., Strachan, N., Pye, S. Anandarajah, G., & Balta-Ozkan, N., 2007. UK MARKAL Model Documentation.
Lawrence, M.C.I., Brown, L., Taam, M., 2011. A commentary on “ The greenhouse-gas footprint of natural gas in shale formations ” by R . W . Howarth ,. Clim. Change 11. doi:10.1007/s10584-011-0333-0
Levi, M., 2013. Climate consequences of natural gas as a bridge fuel. Clim. Change 118, 609– 623. doi:10.1007/s10584-012-0658-3
Loulou, R., Labriet, M., 2007. ETSAP-TIAM: the TIMES integrated assessment model Part I: Model structure. Comput. Manag. Sci. 5, 7–40. doi:10.1007/s10287-007-0046-z
MacKay, D.J.C., Stone, T., 2013. Potential Greenhouse Gas Emissions Associated with Shale Gas Extraction and Use. London, UK.
McGlade, C., Ekins, P., 2015. The geographical distribution of fossil fuels unused when limiting global warming to 2 °C. Nature 517, 187–190. doi:10.1038/nature14016
McGlade, C., Ekins, P., 2014. Un-burnable oil: An examination of oil resource utilisation in a decarbonised energy system. Energy Policy 64, 102–112.
32 McGlade, C.E., Bradshaw, M., Anandarajah, G., Watson, J., Ekins, P., 2014. A bridge to a low
carbon future? Modelling the long-term global potential of natural gas. London, UK.
McJeon, H., Edmonds, J., Bauer, N., Clarke, L., Fisher, B., Flannery, B.P., Hilaire, J., Krey, V., Marangoni, G., Mi, R., Riahi, K., Rogner, H., Tavoni, M., 2014. Limited impact on decadal-scale climate change from increased use of natural gas. Nature 514, 482–485. doi:10.1038/nature13837
Moniz, E.J., Jacoby, H.D., Meggs, A.J.M., 2010. The future of natural gas. Massachusetts Institute of Technology, Cambridge, Massachusetts.
National Grid, 2016. Future Energy Scenarios.
O’Sullivan, F., Paltsev, S., 2012. Shale gas production: potential versus actual greenhouse gas emissions, Environmental Research Letters. doi:10.1088/1748-9326/7/4/044030
Pye, S., Anandarajah, G., Fais, B., McGlade, C., Strachan, N., 2015a. Pathways to Deep Decarbonization in the United Kingdom. London, UK.
Pye, S., Li, F.G.N., Price, J., Fais, B., 2017. Achieving net-zero emissions through the reframing of UK national targets in the post-Paris Agreement era. Nat. Energy.
Pye, S., Sabio, N., Strachan, N., 2015b. An integrated systematic analysis of uncertainties in UK energy transition pathways. Energy Policy 87, 673–684.
doi:10.1016/j.enpol.2014.12.031
Remme, U., Goldstein, G.A., Schellmann, U., Schlenzig, C., 2002. Operations Research Proceedings 2001: Selected Papers of the International Conference on Operations Research (OR 2001) Duisburg, September 3--5, 2001, in: Chamoni, P., Leisten, R., Martin, A., Minnemann, J., Stadtler, H. (Eds.), . Springer Berlin Heidelberg, Berlin, Heidelberg, pp. 59–66. doi:10.1007/978-3-642-50282-8_8
United Nations, 2015. Adoption of the Paris Agreement. Conf. Parties its twenty-first Sess. 21932, 32. doi:FCCC/CP/2015/L.9
33
Appendix A. Description of models
UKTM
The national UK TIMES energy system model (UKTM) has been developed at the UCL Energy
Institute over the last two years as a successor to the UK MARKAL model (Kannan, R.,
Strachan, N., Pye, S. Anandarajah, G., & Balta-Ozkan, 2007). It is based on the model
generator TIMES (The Integrated MARKAL-EFOM System), which is developed and
maintained by the Energy Technology Systems Analysis Programme (ETSAP) of the
International Energy Agency (IEA) (Loulou and Labriet, 2007).
UK MARKAL was largely developed by UCL within UKERC, and was used as a major
underpinning analytical framework for UK energy policy making and legislation from 2003 to
2013 (CCC, 2008; DECC, 2011a; DTI, 2007; Ekins et al., 2011), and UKTM continues to
perform this role as the central long-term energy system pathway model used for policy
analysis at the former Department of Energy and Climate Change (DECC) and the Committee
on Climate Change (CCC). It has been used for DECC’s analysis of the 5th Carbon Budget,
which sets the limit on GHG emissions in the UK for the period from 2028 to 2032 (DECC,
2016). With the aim to increase the transparency in energy systems modelling and to
establish an active user group – including key decision makers – an open source version of
UKTM is being prepared that will be updated on a regular basis.
UKTM is a technology-oriented, dynamic, linear programming optimisation model
representing the entire UK energy system (as one region) from imports and domestic
production of fuel resources, through fuel processing and supply, explicit representation of
34 hydrogen), end use technologies and energy service demands. Like other models of this
type, as noted above, it minimizes the total welfare costs (under perfect foresight) to meet
the exogenously given sectoral energy demands under a range of input assumptions and
additional constraints and thereby delivers an economy-wide solution of cost-optimal
energy market development.
The model is divided into three supply side sectors (resources & trade, processing &
infrastructure and electricity generation) and five demand sectors (residential, services,
industry, transport and agriculture). All sectors are calibrated to the base year 2010, for
which the existing stock of energy technologies and their characteristics are taken into
account. A large variety of future supply and demand technologies are represented by
techno-economic parameters such as the capacity factor, energy efficiency, lifetime, capital
costs, O&M costs etc. Moreover, assumptions are laid down concerning energy prices,
resource availability and the potentials of renewable energy sources, etc. UKTM has a time
resolution of 16 time-slices (four seasons and four intra-day times-slices). In addition to all
energy flows, UKTM tracks CO2, CH4, N2O and HFC emissions. The model structure is
illustrated in Figure A.1. For more information on UKTM, see (Daly et al., 2015; Fais et al.,
2016; Pye et al., 2017, 2015a).
On gas resources, three supply steps are given for each of the four reserve types with
different cumulative potential and extraction costs, thus establishing resource supply curves
with 12 steps. The reserve types include i) located reserves, ii) reserves growth, iii) new
discovery, and iv) shale gas. Each resource step is associated with an activity in 2010
(calibrated to the DUKES energy balances, (DECC, 2011b)), a cost of activity, and the
35 BUEGO (McGlade and Ekins, 2014). The auxiliary gas use for extraction is taken into account
(based on the DUKES energy balances, assuming that 75% of auxiliary gas consumption is
used for production and 25% for transmission network operation). In addition, GHG
emissions from leakage and flaring during fossil fuel extraction are modelled in UKTM
[image:36.595.79.514.236.512.2](based on data from the GHG Inventory (DECC, 2013)).
36
Table A.1: UKTM sector descriptions
5 This model is used to produce the UK energy and emission projections, the latest of which can be found at
https://www.gov.uk/government/uploads/system/uploads/attachment_data/file/368021/Updated_energy_and_emission s_projections2014.pdf. The industry demand projections are not publically available but were provided by DECC on request.
Sector Description
Resources and trade
Includes potentials and cost parameters for domestic resources and traded energy products. For fossil fuels, assumptions are mainly based on results from the global energy system model TIAM-UCL (Anandarajah et al., 2011), while the assumptions on bioenegy potentials are aligned with the CCC’s Bioenergy Review and the Extended land use scenario (CCC, 2011).
Energy processing
Covers all energy conversion processes apart from electricity generation, including oil refineries, coal processing, gas networks, hydrogen production, bioenergy processing as well as CCS infrastructure.
Power generation
Represents a large variety of current and future electricity generation technologies as well as storage technologies, the transmission grid and interconnectors to Continental Europe and Ireland. The technology assumptions are mostly aligned with DECC’s Dynamic Dispatch Model (DDM) (DECC, 2012).
Residential
Domestic housing is divided into existing and new houses. In addition to a large portfolio of heating technologies for the two main energy service demands of space heating and hot water, other services like lighting, cooking and different electric appliances are represented. The technology data is based on various UK-focused building studies, including (Bergman and Jardine, 2009), (Davies and Woods, 2009), (Radov et al., 2009), and (Element Energy & Energy Saving Trust, 2013).
Services
As per residential structure, but stock divided into low- and high-consumption non-domestic buildings. The technology data is based mostly on the same UK-focused building studies mentioned for the residential sector.
Industry
Divided into 8 subsectors of which the most energy-intensive ones (iron & steel, cement, paper and parts of the chemicals industry) are modelled in a detailed process-oriented manner (Griffin et al., 2013), while the remaining ones are represented by generic processes delivering the different energy services demands. The demand projections are aligned with the DECC Energy and Emissions
Projections model (EEP).5
Transport
Nine distinct transport modes are included (cars, buses, 2-wheelers, light goods vehicles, heavy goods vehicles, passenger rail, freight rail, aviation and shipping). For road transport, the demand projections are based on the road transport forecasts 2013 (DfT, 2013) and the technology parameters are mainly sourced from (Ricardo-AEA, 2012).
Agricultural and land use
37
ESME
ESME (Energy Systems Modelling Environment), developed by the Energy Technologies
Institute (ETI), is a fully integrated ESM, used to determine the role of different low carbon
technologies required to achieve the UK’s mitigation targets. The model has been used in
this capacity by the UK Department for Energy and Climate Change (DECC) and the UK
Committee on Climate Change (CCC) (CCC 2011, CCC 2013, DECC 2011). Built in the AIMMS
environment, it uses linear programming to assess cost-optimal technology portfolios. The
uncertainty around cost and performance of different technologies and resource prices is
captured via a probabilistic approach, using Monte Carlo sampling techniques. The focus of
uncertainty is on technology investment costs in the power and transport sectors, fuel costs
and resource potential e.g. biomass imports. The characterisation of uncertainty,
implemented in ESME v3.2 which was used in this paper, is described in detail in (Pye et al.,
2015b).
The representation of energy demand sectors is typical of other ESMs, with representation
of power generation, industry, buildings and other conversion sectors e.g. biofuel
production, hydrogen production. The model endogenously determines how to meet these
demands in a cost-optimal manner, through investment in end use technologies (including
efficiency measures), and the production and supply of different energy forms. In the
household sector, a rich characterisation of low carbon technologies is provided, particularly
for heat pumps, district heating (incl. infrastructure) and building fabric retrofit. The
transport sector also incorporates key low carbon technologies, and the different
infrastructure required to deliver alternative fuels e.g. electricity charging infrastructure and
38 gains, fuel switching measures and carbon capture and storage (CCS). Transformation
sectors (power generation, hydrogen production, biofuel production) represent the key low
carbon technologies, and associated infrastructures (to enable inter-node transmission).
Primary resource supply is characterised by commodity price and resource availability, with
no distinction between imports and domestic indigenous production (except for biomass),
and no explicit representation of resource and upstream sectors.
On GHG emissions accounting, ESME accounts for CO2 but not other greenhouse gases (GHGs).
Therefore, the CO2 emissions constraints applied in the model exogenously assume the level of
non-CO2 GHG levels in future years, taking account of expected abatement, with necessary adjustments
made to the CO2 target. In this version of the model, a non-CO2 GHG level of 55 MtCO2e is assumed
in 2050, based on (CCC, 2010), allowing for 105 MtCO2 of CO2. A more detailed description of the
ESME model can be found in (Heaton, 2014), while an overview of the ESME data sources is
provided in (ETI, 2016).
Appendix B. Description of UKTM scenarios
The first, called ‘Abandon’ assumes that climate change policy is downgraded in importance
during the late 2010s. The Climate Change Act is repealed in 2021, partly due to political
opposition to the short-term costs of decarbonisation at a time of continued austerity, and
partly due to a failure by the international community to implement the ambitious deal
agreed in Paris in 2015. This means that further limits on emissions beyond the 3rd carbon
budget (2018-22) are not implemented. The UK maintains its commitment to international
trade and integration with international energy markets. However, because of a relative lack
39 overall demand, the price of fossil fuels is relatively high in this scenario. Despite the repeal
of the Climate Change Act, because of a desire to ‘sweat’ current assets and to ensure a
continued commitment to EU Directives, the existing pledge that no new unabated coal
power plants are to be constructed remains.
The second, Insular, scenario also assumes that climate change policy is downgraded in
importance during the late 2010s. The Climate Change Act is repealed in 2021, for similar
reasons to Abandon, which again means that further limits on emissions beyond the 3rd
carbon budget are not implemented. As a reaction to economic problems at home and the
perceived failure of international markets and institutions, UK citizens vote to leave the EU.
It also shifts towards a more inward looking energy policy with, for example, much less
electricity connection to the European continent. Strict limits are placed on imports in
favour of domestic fossil fuel (including new coal) and renewable resources, and prices of
fossil fuels are relatively high as a result.
The Affordable scenario continues with commitment to climate change targets well into the
2020s, but with an impression that the world is not acting sufficiently quickly to reduce
emissions, this commitment starts to falter. This results in a lack of agreement on the 5th
carbon budget (2028-32) because of the perceived high costs of meeting progressively
challenging targets and so only the 4th carbon budget (2023-27) is met. The UK shifts away
from any ambition to take a leadership position on climate change, and progressively argues
for the EU to play a following role in international negotiations. Policies to support the
deployment of renewables are progressively scaled back as is policy support for nuclear and
40 In the Maintain scenario, the UK continues its commitment to climate change targets (i.e.
80% GHG emissions reduction by 2050). The 5th carbon budget is agreed, broadly in line with
Committee on Climate Change advice. Part of the reason for this is a relatively strong
climate agreement in Paris and significant progress by many countries towards meeting
their commitments. This drives down the costs of many low carbon technologies and energy
efficiency measures and starts to remove trade barriers. This includes CCS technologies
which are successfully commercialised and ‘rolled out’ alongside other low carbon
technologies. Since the world shifts away from carbon-intensive fuels, particularly coal,
fossil fuel prices remain relatively low.
The Maintain (tech fail) scenario is similar to Maintain, but there is a failure of efforts to
commercialise CCS technologies. More emphasis is therefore placed on other forms of
mitigation to meet UK targets such as renewables, nuclear power and energy efficiency.
Some of the key assumptions that vary across each of the above scenarios are set out in
Table 2. The scenarios with 2050 emissions reduction targets are also required to keep
within a cumulative level of emissions between 2028 (the end of the 4th carbon budget
period) and 2050. This ensures that there is a steady progression towards the 2050 target
and is used as a proxy for future carbon budgets to be set by the Committee on Climate
Change. The cumulative constraint is constructed on the basis of a linear decrease from the
maximum emissions level in 2028 to the level required in 2050. For example, Maintain has
maximum emissions in 2028 of 430 Mt CO2-eq and 160 Mt CO2-eq in 2050. A linear decline
between these dates yields total emissions of 6750 Mt CO2-eq, which is therefore imposed