IMPUTATION-BASED GENETIC ASSOCIATION ANALYSIS OF COMPLEX TRAITS IN ADMIXED POPULATIONS
Qing Duan
A dissertation submitted to the faculty at the University of North Carolina at Chapel Hill in partial fulfillment of the requirements for the degree of Doctor of Philosophy in the Curriculum
in Bioinformatics and Computational Biology in the School of Medicine.
Chapel Hill 2016
Approved by: Terry S. Furey Ethan M. Lange Yun Li
© 2016 Qing Duan
ABSTRACT
Qing Duan: Imputation-Based Genetic Association Analysis of Complex Traits in Admixed Populations
(Under the direction of Yun Li)
Genetic association studies in admixed populations have drawn increasing attention from the genetic community, as performing association analysis in diverse populations allows us to gain deeper understanding of the genetic architecture of human diseases and traits. However, population stratification due to admixture poses special challenges. To address the challenges, I conducted the following studies from the perspectives of enhancing genotype imputation quality and providing proper treatment of local ancestry in the association analysis.
First, I provided a new resource of marker imputability information with commonly used reference panels to guide the choice of reference and genotyping platforms. To be specific, I systematically evaluated marker imputation quality using sequencing-based reference panels from the 1000 Genomes Project and released the information through a user-friendly and publicly available data portal. This is the first resource providing variant imputability information specific to each continental group and to each genotyping platform.
extremes. In addition, I recommended using haplotypes from Exome Sequencing Project alone or concatenation of the two panels over quality score-based post-imputation selection or
IMPUTE2’s two-panel combination.
Finally, I proposed a robust and powerful two-step testing procedure for association analysis in admixed populations. Through extensive numeric simulations, I demonstrated that our testing procedure robustly captures and pinpoints associations due to allele effect, ancestry effect or the existence of effect heterogeneity between the two ancestral populations. In
particular, our testing procedure is more powerful in identifying the presence of effect
heterogeneity than traditional cross-product interaction model. I further illustrated its usefulness by applying the two-step testing procedure to test for the association between genetic variants and hemoglobin trait in African American participates from CARe.
ACKNOWLEDGEMENTS
My research projects would not have been completed without the support of many people. It is a great pleasure to convey my gratitude to those who made this thesis possible.
First of all, I would like to express my profound gratitude to my adviser, Dr. Yun Li, for her invaluable mentorship. Her generous guidance, support and encouragement deeply inspired me and made this dissertation possible.
My sincere gratitude goes to Dr. Karen Mohlke, Dr. Leslie Lange, Dr. Kari North, Dr. Ethan Lange and Dr. Terry Furey for their invaluable advice and support in many ways.
I am truly grateful to my group colleagues for creating a stimulating, inspiring and friendly environment. Many thanks go in particular to Dr. Eric Yi Liu, Dr. Zheng Xu and Dr. Ying Wu who has been especially helpful to me in bringing these projects to completion.
My deepest gratitude goes to my beloved parents and husband. Their love, caring, understanding and support accompanied me and encouraged me throughout my study.
TABLE OF CONTENTS
LIST OF TABLES ... ix
LIST OF FIGURES ... x
LIST OF ABBREVIATIONS ... xi
CHAPTER 1: MOTIVATION AND SIGNIFICANCE ... 1
CHAPTER 2: LITERATURE REVIEW ... 5
2.1 Genome-wide association studies in non-European populations ... 5
2.2 Genotype imputation in admixed populations ... 8
2.3 Association studies in admixed populations ... 13
2.3.1 Local ancestry inference ... 13
2.3.3 Association tests in admixed populations ... 16
CHAPTER 3: A COMPREHENSIVE SNP AND INDEL IMPUTABILITY DATABASE ... 19
3.1 Introduction ... 19
3.2 Data setup and retrieval ... 20
3.2.1 Database ... 20
3.2.2 Methods ... 21
3.2.3 Usage ... 21
3.2.4 Examples ... 22
3.3 Conclusion ... 25
CHAPTER 4: IMPUTATION OF CODING VARIANTS IN AFRICAN AMERICANS ... 30
4.1 Introduction ... 30
4.2.1 Exome Sequencing Project ... 31
4.2.2 Exome Sequencing ... 31
4.2.3 Target African Americans ... 34
4.3 Results ... 35
4.3.1 Comparison of imputation quality ... 35
4.3.2 Impact of imputation reference panel ... 38
4.3.3 Alternative options to use or combine reference panels ... 38
4.4 Discussion ... 39
CHAPTER 5: ROBUST AND POWERFUL TWO-STEP TESTING PROCEDURE FOR ASSOCIATION ANALYSIS IN ADMIXED POPULATIONS ... 58
5.1 Introduction ... 58
5.2 Methods... 61
5.2.1 Simulation of admixed samples and reference haplotypes ... 61
5.2.2 Simulation of quantitative traits ... 62
5.2.3 Inference of local ancestry using HAPMIX ... 63
5.2.4 Association tests ... 64
5.2.5 CARe data set ... 66
5.2.6 WHI-SHARe data set ... 66
5.3 Results ... 66
5.3.1 Power evaluation with simulated data using true local ancestry ... 66
5.3.2 Type I error ... 70
5.3.3 Power in simulated data with estimated local ancestry ... 70
5.3.4 Application to real phenotypes ... 71
5.4 Discussion ... 72
CHAPTER 6: CONCLUDING REMARKS ... 89
LIST OF TABLES
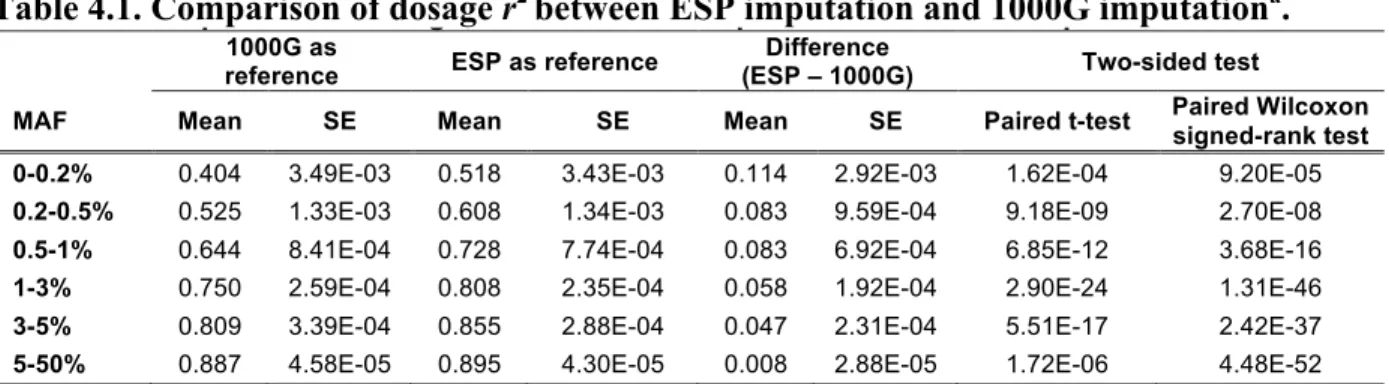
Table 4.1 Comparison of dosage r2 between ESP imputation and 1000G imputation…………..48
Table 4.2 Comparison of dosage r2 between ESP and 1000G full / relevant panels imputation…………...……….…..49
Table 4.3 Number and percentage of well-imputed exonic variants……….50
Table 4.4 Imputability of blood trait associated variants reported in Auer et al………...51
Table 4.5 Comparison of dosage r2 between ESP.extreme and ESP.normal imputation………..52
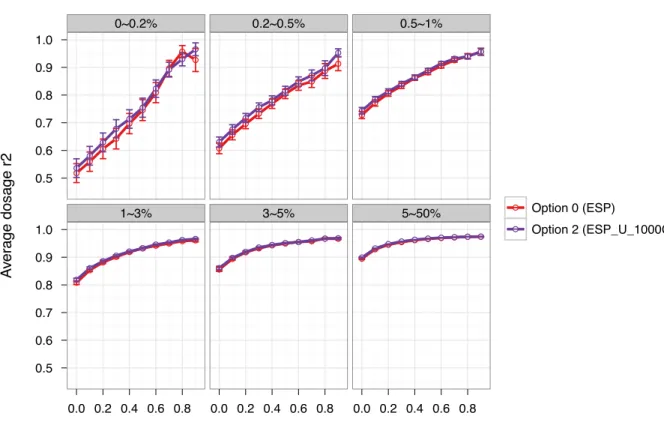
Table 4.6 Comparison of dosage r2 between option 2 and option 0………..53
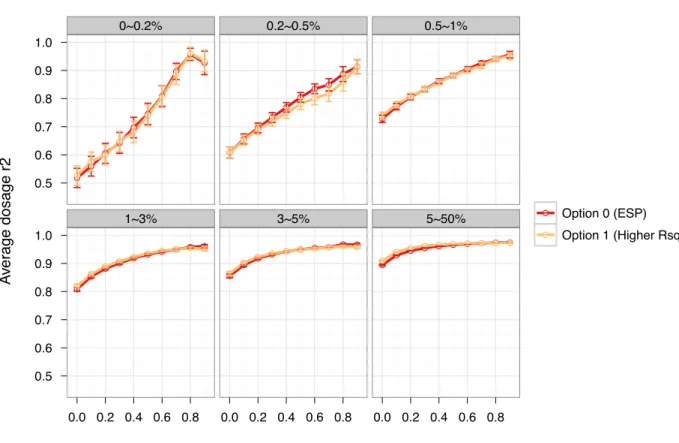
Table 4.7 Comparison of dosage r2 between option 1 and option 0………..54
Table 4.8 Comparison of dosage r2 between option 3 and option 0………..55
Table 4.9 Comparison of dosage r2 between IMPUTE2 results………56
Table 5.1 Four simulation settings……….………81
Table 5.2 Average proportion of times that the source of association is correctly identified...…82
Table 5.3 Ratio of the statistical power of T4 to that of T5 in Scenario 4……….………83
Table 5.4 Ratio of type I error to the nominal significance level………..84
Table 5.5 Median Pearson correlation coefficient……….85
Table 5.6 Ratio of the statistical power of T4 to that of T5 in Scenario 4 using two-step testing procedure and estimated ancestry……….………...……….86
LIST OF FIGURES
Figure 3.1 An example SNP/indel imputability record from the database……….. 27
Figure 3.2 The SNP and indel imputability database interface……… 28
Figure 3.3 Receiver operating characteristic (ROC) curve in the Cebu Longitudinal Health and Nutrition Survey………...…………..29
Figure 4.1 Comparison of dosage r2 between ESP-based and 1000G-based imputation...41
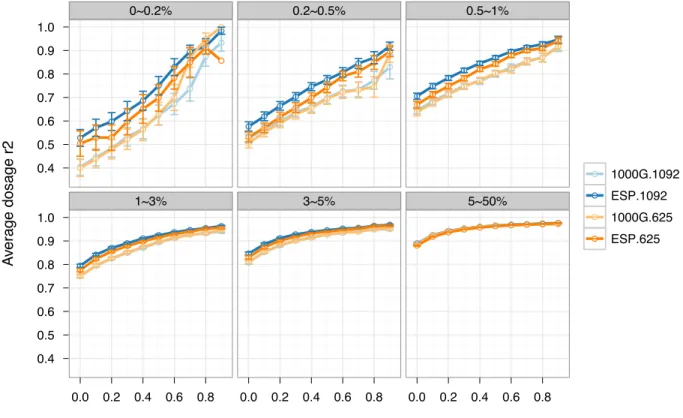
Figure 4.2 Comparison of dosage r2 between ESP and 1000G full/relevant Panel Imputation……...……….…….42
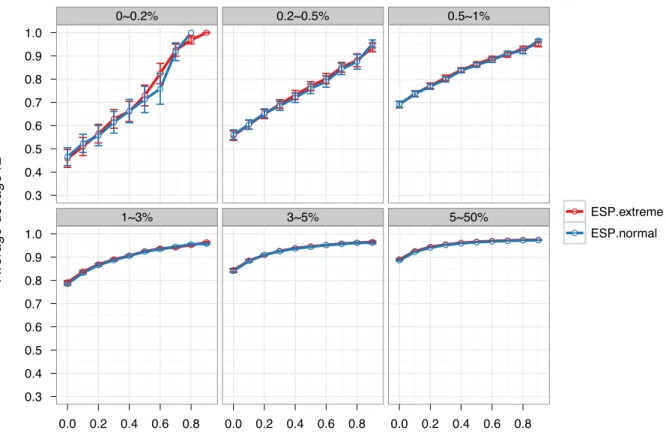
Figure 4.3 Comparison of dosage r2 between ESP.extreme and ESP.normal imputation…..…...43
Figure 4.3 Comparison of dosage r2 between using option 2 and option 0……….……..44
Figure 4.5 Comparison of dosage r2 between using option 1 and option 0……….……..45
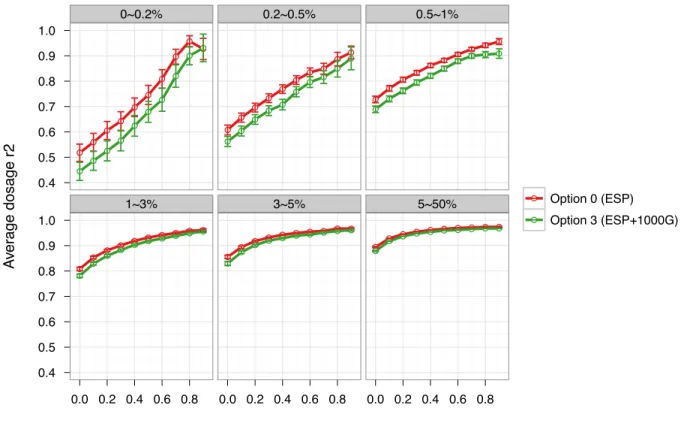
Figure 4.6 Comparison of dosage r2 between Option 0 (ESP) and Option 3 (ESP+1000G) imputation………..……….………….46
Figure 4.7 Comparison of dosage r2 between IMPUTE2 results and minimac results………...47
Figure 5.1 HapMix output (per marker per subject) as joint probability of genotype and local ancestry………..………...75
Figure 5.2 Statistical power of the four tests in Scenario 1………...76
Figure 5.3 Statistical power of the four tests in Scenario 2………...77
Figure 5.4 Statistical power of the four tests in Scenario 3………...78
Figure 5.5 Statistical power of the four tests in Scenario 4………...79
LIST OF ABBREVIATIONS
1000G 1000 Genomes Project AIM Ancestry informative makers
ARIC Atherosclerosis Risk in Communities
CARDIA Coronary Artery Risk Development in Young Adults CARe Candidate-gene Association Resource
CLHNS Cebu Longitudinal Health and Nutrition Survey ESP Exome Sequencing Project
GWAS Genome Wide Association Studies
HCHS/SOL Hispanic Community Health Study / Study of Latinos HMM Hidden Markov Model
IBD Identity-by-Descent JHS Jackson Heart Study LD Linkage Disequilibrium LDL Low-Density Lipoprotein MAF Minor Allele Frequency
MESA Multi-Ethnic Study of Atherosclerosis MI Myocardial Infarction
QC Quality Control
CHAPTER 1: MOTIVATION AND SIGNIFICANCE
In this document, I will discuss computational resources and statistical approaches for facilitating genetic association studies with complex human traits in admixed populations. This section provides an overview of the motivation and significance of this study.
Genome-wide association studies (GWAS) have been successful in improving our understanding of the genetic basis of numerous heritable diseases and quantitative traits
(Visscher et al., 2012). They have been useful in identifying genes associated with complex traits in various relevant biological pathways (Visscher et al., 2012). Although GWAS have initially been performed with individuals of European ancestry, the field has expanded to non-European populations (Rosenberg et al., 2010). Performing genetic association analysis in diverse
populations allows us to gain deeper understanding of the genetic architecture of human diseases and traits, through assessing the generalizability of risk variants (G. K. Chen et al., 2010;
Ioannidis et al., 2004), narrowing down the location of the functional variants over the risk region (International HapMap, 2005) or identifying novel disease loci which are absent or in low frequency in European population (Rosenberg et al., 2010).
presence of local ancestry, many methods developed in homogeneous populations needs to be modified before they could be applied to admixed populations. To address the challenges, I perform three studies from the aspects of enhancing genotype imputation quality with a focus on rare variants and applying proper treatment of local ancestry information in association analysis. Chapter 2 provides a literature review of genotype imputation and association analysis in admixed populations. To be specific, for genotype imputation, I will review several commonly used genotype imputation methods, how the methods are tuned to accommodate the unique LD structure in admixed populations and the practical guidelines for performing genotype
imputation in genetic association studies with a focus on improving rare variants imputation quality; for association analysis in admixed populations, I will review methods used for local ancestry inference and statistical methods that are adopted in performing association studies in admixed populations.
Chapter 3 discusses a new resource of marker imputability information based on the commonly used reference panels from the 1000 Genomes Project. Marker imputability information is highly desirable to guide study design, to prioritize imputable markers and to serve as a post-imputation quality control. However, there is no direct access to this information without performing genotype imputation. I fill in this gap by providing marker imputation accuracy information of four major continental groups through a user-friendly publicly available data portal. This is the first study to provide genome-wide high resolution profiling of variants imputability. This imputability information will be very useful to association studies in diverse populations including admixed populations.
study-specific reference panels. Also I provide guidelines regarding the optimal manner to maximize information from internal and external reference. Increasing number of medical studies includes deep sequencing of a fraction of the participants as part of the study design. Imputation using these internally built reference panel can potentially achieve better performance, particularly at low frequency variants, than using a publicly available panel, e.g., from 1000G, due to better match of ancestry, larger effective sample size and disease status (Fridley et al., 2010). However, limited studies have been performed to investigate the usefulness of study-specific reference panels in imputation, as compared with that from the public domain and none has been
performed in African American sample. The study in Chapter 4 serves as a proof-of-principle to show the feasibility and gain of using the internal reference. Additionally, this is the first study that addresses the potential influence on imputation performance by using a reference panel with sample ascertainment bias, which is common in re-sequencing-based studies. Moreover, this is the first study that explores the optimal usage of the combined information from internal and external reference.
Chapter 5 proposes a testing procedure to model and test allele and ancestry effect jointly taking into account of effect heterogeneity in association analysis with African American
sample. Historically, genetic linkage studies and admixture mapping have been treated as distinct methods and are performed separately in samples from admixed populations. It has been shown that the two methods contain independent information (Seldin et al., 2011). Thus, jointly
modeling allele and local ancestry effect would potentially increase statistical power (Pasaniuc et al., 2011). In Chapter 5, I propose a robust and powerful two-step testing procedure for
CHAPTER 2: LITERATURE REVIEW
2.1 Genome-wide association studies in non-European populations
Many genetic variants associated with human diseases and traits have been successfully identified and replicated in Europeans (Locke et al., 2015; Loth et al., 2014). Nonetheless, European population only consists of a proportion of human genetic variation, which may have different properties, such as allele frequencies, from those in other populations (Coram et al., 2013; Dhandapany et al., 2009; Myles et al., 2008). It is insufficient to study a single population to achieve the goal of fully uncovering the genetic architecture of complex human diseases and traits. Consequently, genome-wide association studies have been expanding into diverse populations such as Asian, African American and Hispanic populations (Franceschini et al., 2013; Kooner et al., 2011; Norris et al., 2009).
In non-European populations, the characteristics of genetic variation, maybe different from that in Europeans, provide a unique opportunity for gene mapping and refining our understanding of genetic variations. First, a genetic variant may be fixed for different alleles among diverse populations. For example, DARC null allele for white blood cells is close to fixation in sub-Saharan Africa, whereas the other wild-type allele is fixed in non-African populations (Lautenberger et al., 2000; Tournamille et al., 1995). Similar examples include
SLC24A5 for skin pigmentation (Lamason et al., 2005) and APOL1 for kidney disease
the same risk allele presents across populations, the risk allele frequency may vary. Risk alleles in certain populations with higher allele frequency may be easier to be identified in association analysis (McCarthy & Hirschhorn, 2008; Teo et al., 2009). Third, the strength of linkage
disequilibrium (LD) and the distance over which it extends may differ in different populations. It is observed that the extent of LD in a Nigerian population is markedly far less compared with that in a north-European population (D. E. Reich et al., 2001). The short-range LD in some populations may offer opportunity for fine mapping (Gabriel et al., 2002). Fourth, heterogeneity in allelic effects may present in distantly related populations. Causal variants may differ in the marginal allelic effect across populations as a result of differential environmental exposure (Morris, 2011). Thus some risk variants are more easily detected by using samples from certain relevant populations (Rosenberg et al., 2010). Finally, diverse populations facilitate the study of rare variant associations. Because of the substantially unexplained proportion of heritability as well as the drop in the whole-genome sequencing cost, many association studies have been focusing on rare variants. As the results of recent mutational events, rare variants are more likely to be geographically restricted (The 1000 Genomes Project et al., 2012). Therefore, different populations may have distinct pool of rare variants, which emphasizes the necessity of studying rare variant associations in diverse populations.
in CEU to maximize the number of markers “covered” by a tagSNP (in adequate LD with the tagSNP measured by r2) (Carlson et al., 2004). The coverage of genomic region can be reduced when the same tagSNP is applied in non-European populations due to the LD structure
differences. Nevertheless, more recent high-throughput genotyping chips are denser and less biased towards European ancestral populations. Additionally, recent chips have been designed with worldwide populations in mind. For example, Affymetrix Axiom Genome-Wide
Population-Optimized Human Array is customized for Caucasian, Asian and West African populations. Recently, Illumina collaborating with PAGE, CAAPA, and T2D-Genes Consortia has developed a multi-ethnic genotyping array, which adopts a novel tagSNP selection algorithm to optimize imputation accuracy across diverse populations (Gignoux, 2015). Moreover, the 1000 Genomes Project, a large-scale international collaboration, has substantially accelerated sequencing-based genetic association studies. The 1000 Genome Project aims to produce an extensive public catalog of human genetic variation by conducting whole genome sequencing of over 2500 individuals from 26 continental groups (The 1000 Genomes Project et al., 2010; The 1000 Genomes Project et al., 2012; The 1000 Genomes Project et al., 2015). Sequencing uncovers genetic variants in diverse populations with little ascertainment bias issue. The comprehensive reference panels provided by the 1000 Genome Project increase the chance of matched LD patterns between the study sample and reference haplotypes, thereby, permitting better imputation in diverse populations from Africa, Asia, America and Europe.
account for the differences, these observations motivate the search for genetic loci, which
contribute to the disease disparity in admixed populations.
Different from ancestrally homogeneous populations, such as Europeans, Africans or Asians, admixed populations have ancestry from more than one populations due to admixture process (Shriner, 2013). The chromosomes of admixed populations can be viewed as mosaic segments with different parental origins, leading to variable “global ancestry”, the individual ancestry proportion, as well as different “local ancestry”, the ancestral origin at a particular locus, across the genome (Bryc et al., 2010; Silva-Zolezzi et al., 2009; S. Wang et al., 2008).
Therefore, the LD patterns in admixed populations are complicated with a fine scale of ancestral LD and a coarse scale of admixture LD. It imposes challenges for genotype imputation, as there are no large and closely matched reference panels from the 1000 Genomes Projects (The 1000 Genomes Project et al., 2015). To meet the challenges, imputation methods have been modified to accommodate admixed populations and practical guidelines have been proposed, which will be reviewed in section 2.2.
Due to the genetic composition of multiple ancestries, population stratification is an intrinsic issue in admixed populations. The underlying population structure may give rise to spurious associations or false negative signals (Rosenberg & Nordborg, 2006). Consequently, computational tools and statistical methods have been developed aiming to resolve this issue in admixed populations, which will be reviewed in section 2.3.
2.2 Genotype imputation in admixed populations
sample that is moderately genotyped at a subset of the reference markers (Y. Li et al., 2010; Marchini & Howie, 2010). Genotype imputation has become a standard practice in GWAS, which markedly enhances statistical power (Spencer et al., 2009), facilitates fine mapping (Scott et al., 2007) and enables meta-analysis (de Bakker et al., 2008). Genotype imputation assumes that “unrelated” individuals could share identical by descent chromosome segment (IBD), i.e., identical short stretches of nucleotide sequences inherited from distant common ancestors. Conceptually, genotype imputation works by identifying the IBD segment for a study sample from the pool of reference haplotypes, based on the genotyped markers overlapping between reference and study sample. Then the genotype of the untyped markers in the study sample can be obtained by copying the corresponding marker genotype from the shared reference haplotype.
Currently, in genetic community, MaCH-Admix (E. Y. Liu et al., 2013), MaCH/minimac (B. Howie et al., 2012; Y. Li et al., 2010) and IMPUTE2 (B. N. Howie et al., 2009) are the widely used imputation software. These methods are highly accurate with adequate
computational efficiency and have facilitated genotype imputation in many large-scale genome-wide genetic studies.
𝑃 𝐺,𝑆 𝐻 =𝑃(𝑆!|𝐻) 𝑃(𝑆!|𝑆!!!,𝐻) !
!!!
𝑃(𝐺!|𝑆!,𝐻)
!
!!!
Where 𝑃(𝑆!|𝐻) is the prior probability of the initial mosaic state which is treated to be
equal in all configurations. The term 𝑃(𝑆!|𝑆!!!,𝐻) is the transition probability which models how the mosaic state changes along the haplotype. The switching of state between marker j and j-1 depends on the historical recombination events which is modeled as a function of the
crossover parameter 𝜃!:
𝑃 𝑆! 𝑆!!!,𝐻 =
𝜃!!/𝐻! 𝑖𝑓 𝑥
! ≠ 𝑥!!! 𝑎𝑛𝑑 𝑦! ≠ 𝑦!!!
1−𝜃! 𝜃!/𝐻+𝜃!!/𝐻! 𝑖𝑓 𝑥
! ≠𝑥!!! 𝑜𝑟 𝑦! ≠𝑦!!!
1−𝜃 !+2 1−𝜃
! 𝜃!/𝐻+𝜃!!/𝐻! 𝑖𝑓 𝑥! = 𝑥!!! 𝑎𝑛𝑑 𝑦! = 𝑦!!!
The term 𝑃(𝐺!|𝑆!,𝐻) is the emission probability which allows the observed genotype at marker j differs from the genotype of the underlying state which reflects the effect from mutation, gene conversion or genotyping error. It is modeled as a function of the error parameter 𝜖! (As shown below). Both 𝜃! and 𝜖! are inferred from data and updated in each iteration.
𝑃(𝐺!|𝑆!,𝐻)
G
0 1 2
S
0 1−𝜖! ! 2𝜖!(1−𝜖!) 𝜖!!
1 𝜖!(1−𝜖!) 1−𝜖! !+𝜖!! 𝜖!(1−𝜖!)
2 𝜖!! 2𝜖!(1−𝜖!) 1−𝜖! !
pre-calculated from the HapMap or the 1000 Genome project reference panel and 𝑁! is the pre-set effective population size. In addition, the mutation rate used in calculating emission probability is assumed to be constant which is from population genetics theory. The pre-calibrated
parameters can help reduce computation cost if using standard reference panels from the HapMap project and the 1000 Genome Project. However, with the increase of medical sequencing projects, more and more study-specific reference panels are available, where the model parameters may differ from the pre-calibrated ones. In these scenarios, MaCH, using the data-dependent parameters, may be advantageous.
IMPUTE2 is an improved version of IMPUTE1. In IMPUTE2, imputation accuracy is improved through two separate phasing and imputation steps. Because computational burden increases quadratically with the increase of reference size, IMPUTE2, similar to MaCH’s implementation, selects a subset of haplotypes so that computation cost increase linearly with a fixed number of selected haplotypes. The subset of reference haplotypes is selected based on their “closeness” to the haplotype of the target individual according to their Hamming distance. This is implemented in both phasing (B. N. Howie et al., 2009) and imputation (B. Howie et al., 2011) step. In addition, a data configuration was implemented to use multiple reference panels simultaneously.
strategy. Rather than identifying the effective reference haplotypes through calculating whole-chromosome Hamming distance, the piecewise IBS-matching method divides the whole-chromosome or target region into chunks and then the selection of effective reference haplotypes is conducted within each chunk for each individual, so that it allows the set of effective reference haplotypes differs across genomic regions and across individuals. It is shown that the piecewise IBS method is highly robust and stable and is particularly advantageous for uncommon variants imputation. With the implementation of piecewise IBS method in MaCH-Admix, one can impute study sample from admixed populations with high accuracy by using a cosmopolitan reference panel consisting of haplotypes from diverse continental groups. Another approach implemented in MaCH-Admix for handling admixed population imputation is ancestry-weighted approach. This method uses weighted combination panel, which is produced by duplicating reference haplotypes based on certain weights. Usually the weights are given according to the ancestry composition. For example, in African Americans, 2:8 CEU: YIR weighting scheme is preferred because on average the African American populations are composed of 20% European ancestry and 80% African ancestry. Besides taking the weights based on reported ancestry proportions, MaCH-Admix can estimate the ancestry proportions for target individuals internally, allowing more precise and flexible weighting scheme that can be the same for all or subgroup of individuals or specific for each target individuals.
Europeans, followed by Asians and Africans; choice of reference panel – reference panel that better represents the genetic diversity of the study sample results in better imputation quality; reference size – a larger pool of reference haplotypes increases the chance that a good match of haplotype between reference panel and target individual can be found.
Improving genotype imputation accuracy is critical, as better imputation accuracy leads to enhanced statistical power in the downstream genetic association analysis.
2.3 Association studies in admixed populations
Admixed populations are a growing proportion of the US population and suffer from disproportionately higher rates of cardiovascular diseases (Mensah et al., 2005) and certain type of cancer, such as prostate cancer (Bunker et al., 2002). Extending genetic association studies into admixed populations will provide a more complete understanding of the genetic bases of complex traits in human by identifying the shared and distinct genetic components compared with other population groups, which will in turn reduce medical disparity and benefit all people from the development of precision medicine.
2.3.1 Local ancestry inference
Unlike populations with a single ancestry origin, individuals from admixed populations vary in their proportion of parental ancestry. For example, the average proportion of African ancestry is about 80% in African Americans (Stefflova et al., 2011). The exact percentage in individual African American may vary between 0 and 1. This variation is due to the difference in ancestry proportion at each specific locus, which is known as local ancestry. Both global and local ancestry are unobserved, and yet they may be inferred from genotype data. Once local ancestry estimates are obtained, global ancestry can be calculated.
of the earliest methods is STRUCTURE (Falush et al., 2003; Pritchard et al., 2000), which uses a Bayesian framework and applies Markov Chain Monte Carlo (MCMC) to sample from the posterior distribution. This early method has complex model and suffers from high
computational cost, which is less practical for the analysis involving dense genome-wide genotyping data.
Later methods divide into two main classes – HMM-based and window-based approaches. The HMM-based methods take advantage of dense genotyping data, leveraging information from neighboring markers and explicitly modeling background LD. In these methods, hidden state corresponds to ancestral haplotype segments and the transition between states corresponds to recombination that happened within and between ancestral populations. The earlier method in this class, SABER (Tang et al., 2006), uses an extension of HMM, Markov–hidden Markov model, to model background LD, whereas this LD model cannot fully capture the complex nature of the LD pattern in the genome thus can lead to biased estimates (Price et al., 2009). More accurate LD models were developed and implemented in HAPMIX (Price et al., 2009) and HAPAA (Sundquist et al., 2008), where reference haplotypes are used to account for background LD. The choice of reference haplotypes is critical for inference accuracy, which serves as the proxies for the true haplotypes of the ancestral populations. HapMap CEU and YRI panel have been shown to be good reference haplotypes for inferring local ancestry in African American populations (Price et al., 2009). HAPMIX can only handle ancestry inference in populations with two-way admixture. The limitation of HMM-based methods is its high computational cost due to the large number of parameters involves in modeling LD.
methods are shown to be highly accuracy and much faster than HMM-based methods, even though they do not explicitly model LD and uses only unlinked markers. These methods usually find their application in populations with multi-way admixture, typically three-way admixture. The major methods include LAMP (Sankararaman et al., 2008), its extension WINPOP
(Pasaniuc et al., 2009) and recently LAMP-LD (Baran et al., 2012). LAMP (Sankararaman et al., 2008) assumes no recombination within each window, and performs a clustering algorithm to estimate the local ancestry for each SNP. In the end, a most likely ancestry of the SNP is taken by a majority vote over all windows that cover the SNP. LAMP is highly accurate when applied to populations with distant ancestral populations, whereas performs poorly in admixed
populations whose ancestral populations are closely related. As an extension of LAMP, WINPOP (Pasaniuc et al., 2009), enhances the inference accuracy in closely related ancestral populations by improving the modeling of recombination events by allowing less than one
admixture event per window and allowing adaptive window size depending on the local ancestral structure. To leverage haplotype structure for local ancestry inference without sacrificing
computation speed, LAMP-LD (Baran et al., 2012) uses combination of window-based method and HMM where HMM-based inference is applied within each window. It reduces the estimation bias in haplotype-based methods resulting limited reference size. Pasaniuc et al. (Pasaniuc et al., 2013) performs the first empirical assessment of local ancestry inference accuracy in Latinos, by measuring the rate of local ancestry assignments that cause Mendelian inconsistencies in local ancestry (MILANC) in trios. They demonstrate the superior performance of WINPOP and LAMP-LD as compared with two other methods.
Although methods within the two main classes are the commonly used ones in
handle local ancestry inference, such as PCAdmix (Brisbin et al., 2012), a PC-based method; SeqMix (Hu et al., 2013), which tackles local ancestry inference in exome-sequencing samples and RFMix (Maples et al., 2013), a random forest based method.
2.3.3 Association tests in admixed populations
Subpopulation structure in a study sample may confound phenotype-SNP associations leading to spurious results, primarily at markers with differential allele frequencies among subpopulations (Price et al., 2010). This issue of population stratification is well addressed in recent years. As a common practice, genomic control (Devlin & Roeder, 1999) is used to quantify the extent of inflation cased by population stratification or other confounders (such as cryptic relatedness) and principal components analysis (Price et al., 2006) is used to correct for stratification if necessary.
In admixed populations, the population stratification issue is intrinsic. Although controlling for global ancestry can reduce false positives, it cannot necessarily eliminate the confounding effect from local ancestry (Qin et al., 2010).
As an alternative, taking advantage of the correlation between phenotype and local ancestry, admixture mapping is developed to test for associated loci in admixed populations. The idea is that the genetic factors leading to disease disparity between the parental populations would have differential allele frequencies. By testing for the association between the ancestry of the chromosome segment and phenotype in admixed sample, the region harboring the causal variant may be identified (Winkler et al., 2010). Admixture mapping can be traced to
populations is large, as long as it is accounted for by genetic factors rather than entirely by environmental factors (Smith et al., 2004). One key advantage of genome-wide admixture mapping over genome-wide genetic linkage study is that it requires the use of much less markers (Smith et al., 2004), which reduces multiple testing burden. Moreover this is particularly
advantageous when genotyping is expensive. Due to recent admixture, the extend of admixture LD could be several megabases. Therefore, a few thousand ancestry informative markers (AIM; markers with large differential allele frequencies between parental populations) would be sufficient. Since the availability of the first dense map of AIM between Europeans and Africans (Smith et al., 2004), admixture mapping has been successfully applied in gene discovery in African Americans for diseases that differ in prevalence in parental populations, such as hypertension (Zhu et al., 2005), prostate cancer (Freedman et al., 2006), type II diabetes (Ng, 2015) and Proliferative Diabetic Retinopathy (Tandon et al., 2015). On the other hand, however, the long stretch of admixture LD limits the resolution of admixture mapping, which is higher than that of family based linkage analysis but is lower than that of ancestry LD based genetic association analysis (Shriner, 2013).
CHAPTER 3: A COMPREHENSIVE SNP AND INDEL IMPUTABILITY DATABASE1
3.1 Introduction
Genotype imputation has proven to be a powerful tool in genome-wide association studies (GWAS) by facilitating fine mapping and the merging of datasets from different genotyping platforms (Y. Li et al., 2009; Marchini & Howie, 2010). It is a way to predict genotypes computationally based on linkage disequilibrium patterns instead of obtaining
genotypes by laboratory-based procedure (Browning & Yu, 2009; B. Howie et al., 2011; Y. Li et al., 2010). As it has been shown to directly affect downstream analysis, imputation accuracy needs to be taken into consideration when designing and performing GWAS (Zheng et al., 2011). For instance, at the study design stage, a question of interest would be which commercially
available genotyping platform can provide the optimal imputation quality genome-wide or in certain genomic region(s) of interest. Such a question can be answered by assessing the imputation accuracy of relevant variants. However, there has been no resource available to provide variant imputability information without actually performing imputation.
A commonly used evaluation method is to mask a subset of markers, impute their
dosages and compare those dosages with the true (masked) genotypes for those markers (Y. Li et al., 2010). This method, however, can only be used after genotypes have already been obtained
1This chapter previously appeared as an article in Bioinformatics. The original citation is as follows:
and therefore cannot help guide study design decisions. In addition, the evaluation procedure can be computationally costly because of the requirement of conducting imputation, particularly with the emergence of reference panels built through re-sequencing efforts (Sampson et al., 2012) To facilitate genetic studies in the era of genomic re-sequencing, we have built a database
containing imputation accuracy information for SNPs and indels identified from the 1000 Genomes Project (The 1000 Genomes Project et al., 2010), a sequencing-based reference resource, which has demonstrated its potential for enhancing the power of genetic association studies in the post-GWAS era (Day-Williams et al., 2011; Holm et al., 2011; Huang et al., 2012). The assessment of marker imputability was carried out through a leave-one-out imputation
procedure: a single individual serves as the imputation target, and imputation is performed using haplotypes from all the other individuals as reference. Imputation accuracy was quantified within each of the four major continental groups surveyed by the 1000 Genomes Project. We anticipate this database containing imputation accuracy information searchable by continental group and by GWAS genotyping platform will be a useful resource for geneticists in this sequencing era.
3.2 Data setup and retrieval
3.2.1 Database
platforms, and separately for each of the four major continental groups [Europeans (EUR), Africans (AFR), Asians (ASN) and Americans (AMR)]. Details regarding sub-population constituents of the continental groups can be found at ftp://ftp-trace.
ncbi.nih.gov/1000genomes/ftp/release/20110521/.
3.2.2 Methods
The dosage r2 of each variant was obtained using a leave-one-out imputation procedure with MaCH-Admix (E. Y. Liu et al., 2013) [high Pearson correlation (0.85–0.94) with those obtained using minimac (B. Howie et al., 2012) and IMPUTE2 (B. Howie et al., 2011), and lower correlation (0.71–0.85) with those from BEAGLE (Browning & Yu, 2009), data not shown] on samples from the latest release of the 1000 Genomes Project (version 3 March 2012 release, 2184 haplotypes). We mimicked typical GWAS imputation practice by masking
genotypes at markers absent from the selected genotyping platform and treating them as untyped. These untyped markers were imputed in one individual at a time using the haplotypes of all the remaining individuals as reference (2182 haplotypes). The imputation accuracy of each marker, measured by dosage r2, was calculated separately in each of four continental groups currently available in the 1000 Genomes Project. The genotyping platforms we have evaluated include Affymetrix 5.0, Affymetrix 6.0, Affymetrix Axiom, Illumina Human1M, Illumina Omni 5 M and Illumina Omni ZhongHua. The results of the assessment are searchable through a publicly
available database.
3.2.3 Usage
Our database can take as input either a list of marker names or the start and end position of a genomic region on a specified chromosome. Users can choose to view information
and the choice of genotyping platform, our database returns imputability information for variants of interest ordered by their genomic location according to NCBI Build 37. Users have the option to display or to download the imputability information for each continental group or the
maximum dosage r2 across the four continental groups (max-r2). Moreover, users can filter results by max-r2. Markers with no rsID follow chromosome:physical-coordinate nomenclature (Figure 3.1A). In addition, for an SNP–indel pair with the same genomic location, the SNP is always listed before the indel (Figure 3.1B).
3.2.4 Examples
top three SNPs. For more realistic settings where the region of interest typically includes many more markers, we recommend prioritization of markers in the region (e.g. according to
functional annotation and/or evidence from existing association or functional studies, if available), followed by the examination and comparison of the max-r2 distribution through ‘Download Results’ or ‘Genome-wide Graphical Comparison’. Such comparison of imputation accuracy across platforms will facilitate decision making regarding the choice of genotyping assays.
Once the investigator has decided on the genotyping platform, a typical question is whether specific markers or markers in specific regions of interest can be imputed well (e.g. novel variants or associated regions identified in other cohorts). When computational resources are limited or when an investigator is interested in a considerable number of markers/regions, imputability information can help prioritize markers/regions that have the potential to be well-imputed as well as avoid wasting resources on markers/regions that have little potential for high-quality imputation. As shown in Figure 3.2, our database contains four dosage r2 values (one for each continental group) for each marker, given a genotyping platform. As false-negatives
(Lange et al., 2010) and Metabochip (Croteau-Chonka et al., 2012) genotypes. We imputed the Metabochip SNPs from the Affymetrix 5.0 data, using haplotypes from the 1000 Genomes Project as reference. We computed the imputation accuracy in this sample (CLHNS-specific dosage r2) by comparing the imputed dosages with the genotypes obtained through genotyping using Metabochip. The y-axis shows the proportion of poorly imputed SNPs (CLHNS-specific dosage r2 < 0.2) removed and the x-axis shows the proportion of well-imputed SNPs (CLHNS-specific dosage r2 > 0.8) sacrificed for SNPs in different minor allele frequency (MAF)
categories (defined within CLHNS). Using a max-r2 threshold of 0.7, which removes ~15 million of the ~31 million markers in the latest release from the 1000 Genomes Project, we found that the database filters out 77%, 58%, 51% and 42% of the poorly imputed SNPs (again, SNPs with CLHNS-specific dosage r2 < 0.2) at the cost of 0.3%, 0.8%, 1.5% and 4.6% well-imputed
markers (SNPs with CLHNS-specific dosage r2 > 0.8) in the MAF categories of >5%, 3–5%, 1–3% and 0.5–1%, respectively. Using a different threshold of 0.5 (0.9), which removes ~12 (~20)
million of the ~31 million markers, we can filter out 54%, 32%, 29% and 26% (92%, 80%, 75% and 66%) of the poorly imputed SNPs at the cost of 0.1%, 0.3%, 0.2% and 2.1% (4.8%, 6.1%, 7.5% and 17.2%) well-imputed SNPs. We also confirmed in samples of Caucasians and samples of African Americans (data not shown) that a max-r2 in the range of 0.5–0.8 serves as a
curve is 0.97, 0.91, 0.88 and 0.79, respectively, for markers with MAF>5%, 3–5%, 1–3% and 0.5–1%.
3.3 Conclusion
In summary, we have built a publicly available database for marker imputability to aid genetic association studies in the re-sequencing era (Fridley et al., 2010; Y. Li et al., 2011; Sampson et al., 2012). Reference panels built from re-sequencing studies bring us the benefits of improved imputation accuracy and the potential to impute low-frequency variants. These benefits come, however, at the cost of heavy computational burden for imputation if we impute every marker discovered by sequencing, which is 430 million in the latest release from the 1000 Genomes Project. It is therefore desirable to have direct access to marker imputability
Figure 3.1. An example SNP/indel imputability record from the database. A.SNPs and indels with no rsID are named by chromosome number followed by genomic location in base-pairs (e.g., chr20:4910201). B.When a SNP and an indel have the same genomic location, the SNP is listed first and the indel second (e.g., at position 4895999, SNP rs77916149 is listed first followed by indel chr20:4895999).
A
28
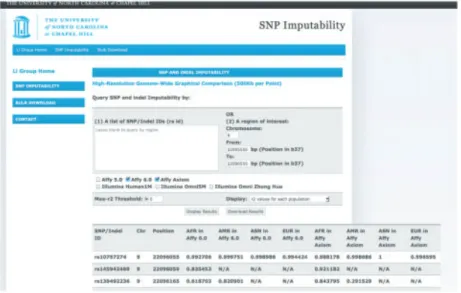
Figure 3.2. The SNP and indel imputability database interface.
from 0 to 2—and the observed/masked genotypes—taking values 0, 1 or 2 copies of a given allele) for every non-singleton SNP and indel discovered by and passing default quality filters in the 1000 Genomes Project (The 1000 Genomes Project Consortium,
2010). The dosager2of each variant reflects its potential
imput-ation accuracy when conducting imputimput-ation using haplotypes from the 1000 Genomes Project as reference. Imputability infor-mation is available for multiple genotyping platforms, and separately for each of the four major continental groups [Europeans (EUR), Africans (AFR), Asians (ASN) and Americans (AMR)]. Details regarding sub-population constitu-ents of the continental groups can be found at ftp://ftp-trace. ncbi.nih.gov/1000genomes/ftp/release/20110521/.
Methods: The dosage r2 of each variant was obtained using a
leave-one-out imputation procedure with MaCH-Admix (Liu
et al., 2012b; http://www.unc.edu/!yunmli/MaCH-Admix/)
[high Pearson correlation (0.85–0.94) with those obtained using
minimac (Howie et al., 2012) and IMPUTE2 (Howie et al.,
2011), and lower correlation (0.71–0.85) with those from BEAGLE (Browning and Yu, 2009), data not shown] on samples from the latest release of the 1000 Genomes Project (version 3 March 2012 release, 2184 haplotypes). We mimicked typical GWAS imputation practice by masking genotypes at markers absent from the selected genotyping platform and treating them as untyped. These untyped markers were imputed in one individual at a time using the haplotypes of all the remaining individuals as reference (2182 haplotypes). The imputation
accuracy of each marker, measured by dosager2, was calculated
separately in each of four continental groups currently available in the 1000 Genomes Project. The genotyping platforms we have evaluated include Affymetrix 5.0, Affymetrix 6.0, Affymetrix Axiom, Illumina Human1M, Illumina Omni 5 M and Illumina Omni ZhongHua. The results of the assessment are searchable through a publicly available database.
Usage: Our database can take as input either a list of marker names or the start and end position of a genomic region on a specified chromosome. Users can choose to view information corresponding to one or more specific genotyping platforms. Given the marker or region input and the choice of genotyping platform, our database returns imputability information for vari-ants of interest ordered by their genomic location according to NCBI Build 37. Users have the option to display or to download the imputability information for each continental group or the
maximum dosager2across the four continental groups (max-r2).
Moreover, users can filter results by max-r2. Markers with no
rsID follow chromosome:physical-coordinate nomenclature (Supplementary Fig. S1A). In addition, for an SNP–indel pair with the same genomic location, the SNP is always listed before the indel (Supplementary Fig. S1B).
Examples: The first example shows the utility of our database at the study design stage. Specifically, suppose an investigator wants to decide between two genotyping platforms, Affymetrix 6.0 and Affymetrix Axiom, based on imputation accuracy within a 1-kb region on chromosome 9p21 (22,095,555 to 22,096,555 bp) harboring the SNP rs10757274 known to be associated with risk of coronary heart disease and multiple related phenotypes
(Cunningtonet al., 2010; McPhersonet al., 2007). Our database
interface, the example query, as well as the results of the query are shown in Figure 1. Given the regional input (start and end
position 22 095 555 and 22 096 555 on chromosome 9), our data-base returns a list of markers within the region (only the top three are shown). For each marker, the database shows its
marker name, genomic location and dosage r2 for the two
se-lected genotyping platforms across four continental groups. To
ease comparison, users can choose to display max-r2instead ofr2
values for each population separately and/or filter by setting
non-zero max-r2 threshold. Based on what is shown in Figure
1, we would recommend the Axiom over the 6.0 panel, unless the samples under study are Americans (e.g. Hispanic or African Americans) and the SNP of primary interest is rs139492236. Note that this is a toy example mainly meant to introduce the interface of our database where we show only the top three SNPs. For more realistic settings where the region of interest typically includes many more markers, we recommend prioritiza-tion of markers in the region (e.g. according to funcprioritiza-tional anno-tation and/or evidence from existing association or functional studies, if available), followed by the examination and
compari-son of the max-r2 distribution through ‘Download Results’ or
‘Genome-wide Graphical Comparison’. Such comparison of imputation accuracy across platforms will facilitate decision making regarding the choice of genotyping assays.
Once the investigator has decided on the genotyping platform, a typical question is whether specific markers or markers in specific regions of interest can be imputed well (e.g. novel vari-ants or associated regions identified in other cohorts). When computational resources are limited or when an investigator is interested in a considerable number of markers/regions, imput-ability information can help prioritize markers/regions that have the potential to be well-imputed as well as avoid wasting resources on markers/regions that have little potential for high-quality imputation. As shown in Figure 1, our database
contains four dosage r2 values (one for each continental group)
for each marker, given a genotyping platform. As false-negatives (markers that can be well-imputed but with bad predicted imputation accuracy such that one would not perform actual imputation) are typically more costly than false-positives (the consequence would be wasted computational resources on markers/regions that are truly not imputable), we recommend
using the maximum dosage r2 across the four continental
groups (max-r2) to guide decisions, particularly for samples
involving admixed individuals. Figure 2 shows the
Fig. 1. The SNP and indel imputability database interface
SNP and indel imputability database
at University of North Carolina at Chapel Hill on May 20, 2013
http://bioinformatics.oxfordjournals.org/
Figure 3.3. Receiver operating characteristic (ROC) curve in the Cebu Longitudinal Health and Nutrition Survey. Sensitivity_Specificity (cutoffs by 1000G max.dosageR2)
Proportion of Good SNPs Removed
Propor
tion of Bad SNPs Remo
ved
0.0 0.2 0.4 0.6 0.8 1.0
0.0 0.2 0.4 0.6 0.8 1.0
MAF
CHAPTER 4: IMPUTATION OF CODING VARIANTS IN AFRICAN AMERICANS2
4.1 Introduction
Increasingly large reference panels available in the public domain [e.g. those from the 1000 Genomes Project (The 1000 Genomes Project et al., 2010; The 1000 Genomes Project et al., 2012) and UK10K project (Futema et al., 2012) together with improved statistical methods (B. Howie et al., 2012; E. Y. Liu et al., 2013) have enhanced imputation quality, especially for rare variants with minor allele frequency (MAF) < 5%. These improvements have resulted in both discovery and refined mapping of association with complex traits (Auer et al., 2012; Holm et al., 2011; Huang et al., 2012). However, few studies have examined the use of large study-specific reference panels, particularly the use of exome sequencing-derived panels in admixed populations. Here, we present a new resource for imputation in African Americans, built from 1692 African Americans sequenced by the Exome Sequencing Project (ESP) (Tennessen et al., 2012). We assessed the use of the ESP data as an imputation reference panel and compared the results with those obtained using the 1000 Genomes Project Phase1 data (1000G; version 3, March 2012 release) (The 1000 Genomes Project et al., 2012). Additionally, we evaluated the potential consequences of using a reference panel built from samples selected on the basis of phenotypic extremes or disease status instead of a population-based random sample. Lastly, we
2This chapter previously appeared as an article in Bioinformatics. The original citation is as follows:
compared multiple approaches to combine the ESP and 1000G panels for the imputation of rare coding variants.
4.2 Methods
4.2.1 Exome Sequencing Project
The complete ESP dataset (Fu et al., 2013) consists of whole exome data for 6823
individuals. Samples were sequenced at the University of Washington (SeattleGO) and the Broad Institute (BroadGO). Among the 6823 individuals, 1692 participants were African Americans with genome-wide association data available for analysis. The 1692 African Americans ESP samples include 845 from the Women’s Health Initiative (WHI) study (The Women’s Health Initiative Study, 1998) as part of the WHI Sequencing Project (WHISP), and a total of 847 including Atherosclerosis Risk in Communities (ARIC) (Muntaner et al., 1998) (N=282),
Jackson Heart Study (JHS) (Taylor et al., 2005) (N=366), Multi-Ethnic Study of Atherosclerosis (MESA) (Bild et al., 2002) (N=146) and Coronary Artery Risk Development in Young Adults (CARDIA) (Friedman et al., 1988) (N=53) as part of HeartGO. Most WHISP and HeartGO participants were selected on the basis of primary phenotypes for ESP, which included extremes of body mass index, blood pressure, low-density lipoprotein (LDL), cholesterol, early onset myocardial infarction (MI) cases and controls, ischemic stroke with either early onset or positive family history. Approximately 15% of samples were selected because of having non-missing data for a selected set of core phenotypes, but were not ascertained based on trait values.
4.2.2 Exome Sequencing
quantification (PicoGreen), confirmation of high-molecular weight DNA, fingerprint genotyping and sex determination. Samples were failed if total mass, concentration, integrity of DNA or quality of preliminary genotyping data was too low or sex typing was discordant. Following QC, 2mg of extracted genomic DNA was subjected to shotgun library preparation and exome capture as previously described (Tennessen et al., 2012).
4.2.2.1 Genotype Calling
For read mapping and variant analysis, samples were aligned to a human reference (hg19) using Burrows–Wheeler Aligner (H. Li & Durbin, 2009). Variant detection and genotyping were performed on both exomes and flanking 50bp of intronic sequence.
Typical mean coverage of the target was 60–80x. Variant data for each sample were formatted (variant call format) as ‘raw’ calls for all samples. Filters considered the total read depth, the number of individuals with coverage at the site, the fraction of variant reads in each heterozygote, the ratio of forward and reverse strand reads carrying reference and variant alleles and the average position of variant alleles along a read. Variant calling was performed across all 6515 samples at the University of Michigan (UMich). Only single nucleotide polymorphisms (SNPs) that passed the UMich support vector machine quality filter were retained for analysis. Details were previously described (Fu et al., 2013).
4.2.2.2 Reference Panel Construction
overlap with the 702 205 GWAS SNPs. There were 10130 SNPs that overlapped between ESP and the 702 205 GWAS markers. SNPs with concordance 595% were removed (65 SNPs). For overlapping SNPs that passed this concordance filter, GWAS genotype was retained for consistency with the target individuals. A total of 1 077 164 autosomal SNPs were included in the reference panel. These 1 077 164 markers were phased across all 2163 samples using BEAGLE v3.3.1 (Browning & Yu, 2009).
4.2.2.3 ESP ‘Extreme’ and ‘Normal’ Panel Construction
The 1692 ESP African Americans were selected based on the following phenotypic traits: (i) LDL (N = 254: 131 with high LDL and 123 with low LDL), (ii) blood pressure (N = 247: 132 with high blood pressure and 115 with low blood pressure), (iii) body mass index (BMI, N = 609: 429 with high BMI and 180 with normal to low BMI), (iv) early onset MI (EOMI, N = 324: 39 EOMI cases and 285 EOMI controls), (v) stroke (N = 40, all cases) and (vi) random samples (N = 218). We constructed one ESP ‘Extreme’ panel and one ESP ‘Normal’ panel each with 853 individuals. The ESP ‘Extreme’ panel included (i) 254 individuals with high/low LDL (131 with high LDL and 123 with low LDL), (ii) 247 individuals with high/low blood pressure (132 with high blood pressure and 115 with low blood pressure), (iii) 40 stroke cases, (iv) 39 EOMI cases and (v) 273 individuals with high BMI. The ESP ‘Normal’ panel consists of 80% individuals with ‘non-extreme’ phenotypes and 20% with extreme phenotypes so as to better represent a population sample. Individuals with ‘non-extreme’ phenotypes (N = 683) are from random sample, EOMI controls and low BMI group. Individuals with extreme phenotypes (N = 170) are from high (N = 85) and low LDL (N = 85) group.
The 1000 Genomes Phase1 data were downloaded from
http://www.sph.umich.edu/csg/yli/ mach/download/1000G.2012-03-14.html. Details regarding the generation of the data can be found in the Phase 1 article (The 1000 Genomes Project et al., 2012).
4.2.3 Target African Americans
4.2.3.1 GWAS Data
All of the 1661 target African Americans in this study were genotyped using the
Affymetrix 6.0 genotyping platform as part of the WHI SNP Health Association Resource study. Before phasing and imputation, we removed Affymetrix 6.0 SNPs with genotype call rates <90%, or Hardy–Weinberg exact test (Wigginton et al., 2005) P<106 or MAF < 1%. QC details were described previously (Auer et al., 2012; Reiner et al., 2011).
4.2.3.2 Metabochip data
All of the 1661 target African Americans in this study were also genotyped using the Metabochip (Voight et al., 2012) in an attempt to generalize genetic effects across racial groups by the WHI Population Architecture using Genomics and Epidemiology (PAGE) study. Standard QC was performed, including removal of markers with genotype call rate < 95% or Hardy– Weinberg P<106, as well as exclusion of individuals who showed excess heterozygosity, were part of an apparent first-degree relative pair, or were ancestry outliers as determined by Eigensoft (Price et al., 2006). Details can be found in the PAGE Metabochip article (Buyske et al., 2012).
Genotypes at the Metabochip SNPs were not used for imputation but rather used for assessment of imputation quality. In total 5035 markers, which were on Metabochip, in 1000G and in ESP, but not on Affymetrix 6.0, were used for imputation quality assessment.
African Americans present in ESP were not included as target. In other words,
individuals in the reference ESP and the target were mutually exclusive. In addition, we removed any target with PLINK (Purcell et al., 2007) estimated identity-by-descent (IBD) ≥ 0.2 with any reference individual such that our final target set did not contain any apparent first-degree relative with the reference ESP.
4.2.3.4 Imputation using IMPUTE2
In the main text, unless otherwise specified, we present results using minimac for imputation. Figure 4.7 and Table 4.8 showed that our recommendation of ESP alone or
concatenation of ESP with 1000G (ESP_U_1000G) over 1000G still held when IMPUTE2 was used for imputation. We note that in the main text, our recommendation against IMPUTE2’s two panel mode (option 3: ESPþ1000G) was confounded by software/method choice: ESP alone or ESP_U_1000G using minimac performed better than IMPUTE2’s ESP + 1000G, but when using IMPUTE2 for all, ESP alone or ESP_U_1000G performed similarly as ESP + 1000G.
4.3 Results
4.3.1 Comparison of imputation quality
Imputation into the 1661 target WHI African Americans was performed with minimac (B. Howie et al., 2012) (similar results were obtained with IMPUTE2; see Methods) using their Affymetrix 6.0 genotypes only; genotypes from the Metabochip genotyping were saved for evaluation. Following the literature (Browning & Yu, 2009; Y. Li et al., 2010), we used dosage r2 [squared Pearson correlation between imputed dosages (ranging continuously from 0 to 2) and
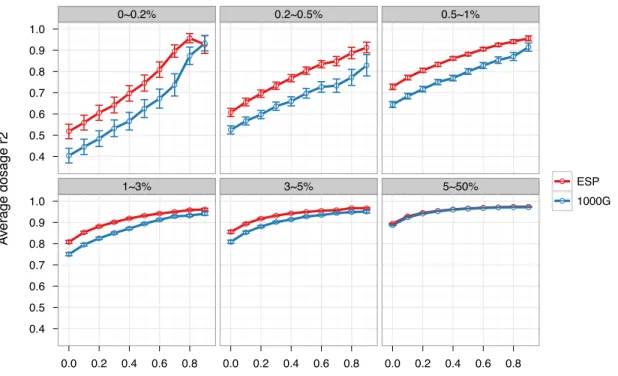
experimental genotypes (coded as 0, 1 or 2)], which directly determines effective sample size for subsequent association analysis (Pritchard & Przeworski, 2001), to gauge imputation quality. We also use Rsq, the estimated dosage r2 generated by minimac, as the post-imputation QC metric. We observed 8.3–11.4% increases in average dosage r2 for variants with MAF<1% using the ESP reference panel compared with the 1000G reference panel (paired Wilcoxon P<1.3×10⁻⁴ - 4.1×10⁻¹⁶ ). Such increases were observed without applying any post-imputation QC, that is, when every imputed variant was retained. Similarly increased dosage r2 was observed across a broad range of post-imputation QC stringency (removing 0–90% of variants; Figure 4.1 and Table 4.1). As imputation is routinely performed in 10 000–100 000 individuals (Auer et al., 2012; Cho et al., 2012; Dastani et al., 2012; Holm et al., 2011; Teslovich et al., 2010), such an increase would correspond to increasing the sample size for association testing by 1000–10 000 samples.
Because the ESP panel is larger and consists entirely of African Americans, we
(Figure 4.2 and Table 4.2). For example, when comparing ESP.1092 with 1000G.1092 and retaining all imputed variants in the analysis (no post-imputation QC), we observed an average dosage r2 increase of 11.3, 4.6 and 6.1% for variants with MAF < 0.2%, 0.2–0.5% and 0.5–1%, respectively. The corresponding dosage r2 increases for a comparison of ESP.625 with
1000G.625 were 13.9%, 1.0 and 3.1%, respectively. The superior performance of ESP over 1000G was likely driven by two primary factors. First, genotypes for rare variants from ESP were derived from high coverage sequencing, whereas those from 1000G were in part from low coverage sequencing (1000G data we used here are the integrated panel constructed from low coverage whole genome sequencing, deep exome sequencing and SNP array genotyping). Second, ESP African Americans (~50% also from WHI, detailed in Materials and Methods) were better matched to the ‘target’ WHI African Americans for ancestry than were the samples in the 1000G panel, which were pooled from several populations of European, African and African American ancestry.
4.3.2 Impact of imputation reference panel
Many subjects sequenced in ESP were selected on the basis of phenotypic extremes or disease status (detailed in Materials and Methods), an approach that has been shown to increase power for association testing of the specific phenotype (Barnett et al., 2013; Guey et al., 2011; Kryukov et al., 2009). To our knowledge, the consequences of such a design for developing an imputation reference panel have not been previously evaluated. To this end, we constructed two ESP-derived reference panels: ‘ESP.extreme’ and ‘ESP.normal’ each of size H=853×2. The former included 254 African Americans from LDL cholesterol extremes, 247 from blood
pressure extremes, 40 stroke cases, 39 early onset MI (EOMI) cases and 273 with extremely high BMI. The latter included 85 samples with high LDL, 85 with low LDL and 683 from the
‘middle’ of the phenotype distributions. We observed no loss of imputation quality using the ‘Extreme’ panel. (Figure 4.3 and Table 4.5).
4.3.3 Alternative options to use or combine reference panels
Although our results suggested that the ESP panel led to substantially improved
the two (ESP_U_1000G). Option 3 was to impute using IMPUTE2, which allows two separate reference panels (ESP + 1000G).
The best option among the four was the concatenation of the two panels (Option 2) with ESP alone (Option 0), a close second best. For example, the average dosage r2 increased by 1.8%, 2.3% and 1.5%, respectively, for markers with MAF<0.2, 0.2–0.5 and 0.5–1% using Option 2 over Option 0 (Figure 4.3 and Table 4.6). We observed no noticeable gains using Option 1 compared with Option 0 with differences in dosage r2 in the range of 0.02–1.5% (Figure 4.5 and Table 4.7). Therefore, we would not recommend using Option 1, the Rsq-based selection, because higher Rsq does not guarantee better imputation quality. In fact a low quality reference panel could lead to poorly estimated Rsq values. Finally, IMPUTE2’s ability to combine two reference panels (Option 3), led to decreased imputation quality compared with Option 0. For example, dosage r2 decreased by an average of 7.3, 4.3 and 3.9% for markers with MAF<0.2, 0.2–0.5 and 0.5–1% (Figure 4.6 and Table 4.8). Although less accurate, the
convenience provided by IMPUTE2’s approach warrants closer consideration. Decreases in quality could be due to software implementation because we used minimac for options 0–2 and IMPUTE2 for option 3. But importantly, our recommendation of concatenation of the two or ESP alone over 1000G alone or post-imputation Rsq-based selection holds when IMPUTE2 was used for all four options (see ‘Imputation using IMPUTE2’ in Materials and Methods, Figure 4.7 and Table 4.9).
4.4 Discussion
We note that ESP is heavily enriched for extremes from several phenotypes rather than a single phenotype. Thus, it is unclear whether these results generalize to a design where
select one phenotype for evaluation, as doing so would reduce our reference size to below 300, which we view as of little value for the imputation of rare variants. We expect such ‘Extreme’ panels to make little difference for imputation overall and may affect imputation in the specific trait associated regions when the causal variant(s) exert large effect(s).
Although we recommend the concatenation of ESP and 1000G, we observed only modest gains in imputation quality by combining the two. Previous studies suggest that these gains may depend in part on the ethnic make-up of the study subjects (Browning & Yu, 2009) and whether 1000G data add substantial haplotype diversity. These gains should be weighed against the logistical challenges of combining data from multiple sources to avoid batch effects (e.g.
mismatched strands, inconsistent marker naming schemes or systematic differences in genotype calling, QC or phasing).
Figure 4.1. Comparison of dosage r2 between ESP-based and 1000G-based imputation. The x-axis is the proportion of SNPs that were removed based on elevated Rsq threshold (QC). The y-axis is the mean dosage r2 (squared Pearson correlation between imputed dosages and
experimental genotypes). ESP vs 1000G (Mean Dosage R2 +/− SE)
Proportion of SNPs removed
A
ver
age dosage r2
0.4 0.5 0.6 0.7 0.8 0.9 1.0 0.4 0.5 0.6 0.7 0.8 0.9 1.0 0~0.2% ● ● ● ● ● ● ● ● ● ● ● ● ● ● ● ● ● ● ● ● 1~3% ● ● ● ● ● ● ● ● ● ● ● ● ● ● ● ● ● ● ● ●
0.0 0.2 0.4 0.6 0.8
0.2~0.5% ● ● ● ● ● ● ● ● ● ● ● ● ● ● ● ● ● ● ● ● 3~5% ● ● ● ● ● ● ● ● ● ● ● ● ● ● ● ● ● ● ● ●
0.0 0.2 0.4 0.6 0.8
0.5~1% ● ● ● ● ● ● ● ● ● ● ● ● ● ● ● ● ● ● ● ● 5~50% ● ● ● ● ● ● ● ● ● ● ● ● ● ● ● ● ● ● ● ●
0.0 0.2 0.4 0.6 0.8
● ESP