Ultrafiltration Rates and the Quality Incentive Program:
Proposed Measure Definitions and Their Potential
Dialysis Facility Implications
Jennifer E. Flythe,*†Magdalene M. Assimon,*‡Julia B. Wenger,* and Lily Wang†‡ Abstract
Background and objectivesRapid ultrafiltration rates are associated with adverse outcomes among patients on hemodialysis. The Centers for Medicare and Medicaid Services is considering an ultrafiltration rate quality measure for the ESRD Quality Incentive Program. Two measure developers proposed ultrafiltration rate mea-sures with different selection criteria and specifications. We aimed to compare the proposed ultrafiltration rate measures and quantify dialysis facility operational burden if treatment times were extended to lower ultrafi l-tration rates.
Design, setting, participants, & measurementsData were taken from the 2012 database of a large dialysis organization. Analyses of the Centers for Medicare and Medicaid Services measure considered 148,950 patients on hemodialysis, and analyses of the Kidney Care Quality Alliance measure considered 151,937 patients. We described monthly patient and facility ultrafiltration rates and examined differences in patient characteristics across ultrafiltration rate thresholds and differences in facilities across ultrafiltration rate measure scores. We computed the additional treatment time required to lower ultrafiltration rates,13 ml/h per kilogram.
ResultsUltrafiltration rates peaked in winter and nadired in summer. Patients with higher ultrafiltration rates were younger; more likely to be women, nonblack, Hispanic, and lighter in weight; and more likely to have histories of heart failure compared with patients with lower ultrafiltration rates. Facilities had, on average, 20.8% 610.3% (July) to 22.8%610.6% (February) of patients with ultrafiltration rates.13 ml/h per kilogram by the Centers for Medicare and Medicaid Services monthly measure. Facilities had, on average, 15.8%68.2% of patients with ultrafiltration rates$13 ml/h per kilogram by the Kidney Care Quality Alliance annual measure. Larger facilities (.100 patients) would require, on average, 33 additional treatment hours per week to lower all facility ultrafiltration rates,13 ml/h per kilogram when total treatment time is capped at 4 hours.
ConclusionsUltrafiltration rates vary seasonally and across clinical subgroups. Extension of treatment time as a strategy to lower ultrafiltration rates may pose facility operational challenges. Prospective studies of ultrafi l-tration rate threshold implementation are needed.
Clin J Am Soc Nephrol11:ccc–ccc, 2016. doi: 10.2215/CJN.13441215
Introduction
Growing evidence supports fluid management as a critical contributor to outcomes for patients on hemo-dialysis (HD). Suboptimalfluid management leads to increased hospitalizations, patient discomfort, and substantial cost (1–3). However, evidence-based guidelines are currently lacking. Accurate target weight estimation and interdialytic weight gain (IDWG) reduction have proven elusive (3). Fluid re-moval during dialysis (ultrafiltration [UF]) is a poten-tially modifiable, facility–controlled aspect of fluid management. Some experts have advocated for im-plementation of UF rate ceiling thresholds to reduce complications fromfluid removal practices (4).
The US Centers for Medicare and Medicaid Services (CMS) is considering a UF rate measure for inclusion in the 2019 ESRD Quality Incentive Program (QIP).
Before the QIP incorporation, proposed measures are vetted by technical expert panels and considered for endorsement by the National Quality Forum (NQF) (5). In May of 2015, the NQF considered two UF rate measures proposed by CMS (measure 2700) and the Kidney Care Quality Alliance (KCQA; measure 2701) (6). The NQF endorsed the KCQA measure, but CMS has notfinalized the measure (7). Both UF rate measures assess facility fluid management by calculating the proportion of pa-tients with delivered UF rates above specified thresholds (.13 ml/h per kilogram for the CMS measure and$13 ml/h per kilogram for the KCQA measure). Although similar in construction and interpretation, the measures differ in patient selection criteria, time windows, and number of contributing HD treatments. Neither measure has provisions for patient subpopulations with plausibly different UF rate risk thresholds.
*University of North Carolina Kidney Center, Division of Nephrology and Hypertension, Department of Medicine, University of North Carolina School of Medicine, Chapel Hill, North Carolina;†Cecil G. Sheps Center for Health Services Research, University of North Carolina, Chapel Hill, North Carolina; and ‡Department of Epidemiology, University of North Carolina Gillings School of Global Public Health, Chapel Hill, North Carolina
Correspondence: Dr. Jennifer E. Flythe, University of North Carolina Kidney Center, 7024 Burnett-Womack CB #7155, Chapel Hill, NC 27599-7155. Email: [email protected]
To lower UF rates, dialysis facilities can extend treatment time (TT) or decrease UF volumes. Both strategies have important patient and facility implications, and both will likely be necessary to adequately reduce UF rates. The least operationally disruptive strategy is intensive dietary coun-seling to minimize weight gains and thus, obligate UF volumes. However, dietary counseling is standard in most nutritional programs, and high weight gains remain com-mon (8). TT extension will likely be necessary to lower UF rates for many patients. Using 2012 data from a single large dialysis organization (LDO), we sought to (1) de-scribe UF rate distributions and patterns, (2) compare fa-cilities with higher (versus lower) percentages of patients with elevated UF rates, and (3) investigate the amount of additional facility TT required to meet specified UF rate thresholds.
Materials and Methods UF Rate Measures
We evaluated the CMS and the KCQA proposed UF rate measures submitted to the NQF May 2015 multistake-holder Standing Committee meeting (6). The CMS-proposed measure was developed in consultation with nephrolo-gists and measure development experts at the University of Michigan under the ESRD Quality Measure Develop-ment, Maintenance, and Support contract. The KCQA-proposed measure was developed by the KCQA, a dialysis measure development body supported by Kidney Care Partners, a multistakeholder coalition that aims to im-prove care through legislative, regulatory, and quality initiatives (9).
We analyzed UF rates according to the CMS and the KCQA measure specifications at the patient and facility levels using 2012 data from a single LDO (Figure 1, Sup-plemental Table 1) (6). The UF rate measures reflect the percentage of patients at a dialysis facility with elevated UF rates (.13 ml/h per kilogram across all delivered TTs for the CMS measure and$13 ml/h per kilogram across delivered TTs,240 minutes for the KCQA measure). The measures are reported as proportions (percentages of fa-cility patients with UF rates above specified thresholds). Lower scores are more favorable. We also evaluated a modified KCQA measure, in which we omitted the TT,240 minutes requirement. In all analyses, delivered UF rate (milliliters per hour per kilogram) was calculated by (predialysis weight2postdialysis weight [milliliters])/ delivered TT (hours)/postdialysis weight (kilograms).
In primary analyses, monthly CMS UF rate measures were calculated by dividing the number of facility patients with UF rates.13 ml/h per kilogram by the total number of facility patients on HD on a monthly basis. The UF rate was calculated from the pre- and postdialysis weights and delivered TT from the HD treatment corresponding to the day of the monthly clearance assessment. The KCQA mea-sure was calculated by dividing the total number of facility patients with an average UF rate$13 ml/h per kilogram and an average delivered TT ,240 minutes by the total number of facility patients on HD on a monthly basis. The KCQA monthly UF rate was computed as a mean of UF rates from the treatments during the monthly clearance assessment week. Facility monthly UF rate measure values were averaged to create an annual measure per the KCQA
specifications. In secondary analyses, we considered alter-native UF rate calculations by varying data collection days and the number of treatments contributing to UF rate cal-culations.
Monthly (CMS) and annual (KCQA) facility UF rate measure scores were dichotomized at the 75th percentile to mirror the CMS facility performance evaluation. Facilities in the highest score quartile had the largest proportion of patients with UF rates above the specified threshold compared with lower quartile facilities.
Study Design and Selection Criteria
This study was approved by the University of North Carolina at Chapel Hill Institutional Review Board. Data were taken from 196,635 patients from 2449 facilities with available data in a single LDO’s 2012 database. Cohort entry was dy-namic and could occur between January 1 and November 30, 2012. Patients entered and exited the cohort and contributed to different facility monthly cohorts according to selection criteria application on a rolling monthly basis. This design mirrors real world measure implementation and facilitates calculation of monthly proportions of facility patients with UF rates above proposed thresholds.
Patient eligibility criteria were assessed monthly (Figure 1, Supplemental Table 1). Inclusion criteria for both mea-sures were patients on HD ages$18 years old and present at the reporting facility for$30 days. Exclusion criteria for both measures were patients on peritoneal dialysis or home HD, patients dialyzing at units with ,11 patients, and patients with incomplete UF rate data. For the CMS measure, we excluded patients on dialysis for ,90 days and patients with reported UF rates,0 or.50 ml/h per kilogram. For the KCQA measure, we excluded patients with less than seven treatments at the facility in the report-ing month and patients with four or more treatments dur-ing the weekly calculation period.
Data Collection
Study data were obtained from the LDO’s medical re-cord. Demographic data were documented at admission to one of the organization’s facilities. Comorbid conditions were assessed by the nephrologist at facility admission and updated on the basis of clinical course. Dialysis ade-quacy (Kt/V) was measured at least monthly. When more than one Kt/V measurement was available, the last monthly value was selected. Treatment variables, includ-ing pre- and postdialysis weights, delivered TTs, and vas-cular access type, were recorded every treatment. BP was measured pre- and postdialysis and at least every 30 min-utes during HD. Intradialytic hypotension was defined as nadir intradialytic systolic BP ,90 mmHg in .30% of treatments in the prior month. Low pre–HD systolic BP was defined as pre–HD systolic BP,100 mmHg in .30% of treatments in the prior month. Facility geographic region was assigned using US Census designations.
Statistical Analyses
summarized across the full cohort and across key sub-groups. Facility characteristics were stratified by region (western versus nonwestern region). Differences in the percentage of patients at a dialysis facility with elevated UF rates across the CMS and the KCQA criteria were com-pared using pairedttests. Two–tailedPvalues,0.05 in-dicated statistical significance.
To show facility burden resulting from implementation of the proposed KCQA UF rate threshold, we computed the additional TT required to lower prescribed UF rates to,13 ml/h per kilogram. Total TT was capped at 4 hours per the KCQA specifications. For these analyses, prescribed UF rate (milliliters per kilogram) was calculated using the for-mula (predialysis weight from current treatment2 post-dialysis weight from previous treatment [milliliters])/ prescribed TT (hours)/postdialysis weight from previous treatment (kilograms). Supplemental Table 2 shows de-tailed methods.
Results
Cohort Characteristics
Figure 2 displays patient and facility selection (Figure 2A) and facility locations (Figure 2B). Analyses of the CMS measure considered 148,950 unique patients from 1902
facilities, and analyses of the KCQA measure considered 151,937 unique patients from 1901 facilities. In the CMS cohort, the mean age was 62 years old, 36.7% were black, 25.9% had heart failure, and 25.6% dialyzed at facilities in the western United States as of thefirst reporting month. In the KCQA cohort, the mean age was 62 years old, 36.4% were black, 24.8% had heart failure, and 26.2% dialyzed at facilities in the western United States as of thefirst report-ing month. The cohorts were similar to the broader United States HD population in terms of age, sex, race, and co-morbidities (10).
UF Rate Operational Definitions
proportions of facility patients with monthly UF rates above measure thresholds differed significantly comparing the CMS and the KCQA criteria (monthlyPvalues,0.001) (Table 1).
Because the CMS measure relies on a single UF rate value, we performed secondary analyses varying the UF rate collection day. UF rates calculated from the last
lowest UF rates. Supplemental Table 3 displays differences across UF rate operational definitions.
Patient and Facility Characteristics across UF Rate Groups and Thresholds
Patients with UF rates.13 ml/h per kilogram in thefirst reporting month were younger; more likely to be women, nonblack, and Hispanic; and more likely to have histories of heart failure, lower body weight, greater dialysis vin-tage, higher predialysis BP, greater IDWG, and shorter TT compared with patients with lower UF rates. Findings were consistent across measures and months (Table 2). Facilities falling in the highest UF measure quartile (facil-ities with.28.3% of patients with UF rates.13 ml/h per kilogram by the CMS criteria and facilities with.20.3% of patients with UF rates $13 ml/h per kilogram by the KCQA criteria) were more likely to be located in the west-ern United States, have ,25 patients, have fewer black patients, and have more Hispanic patients compared with facilities in lower quartiles (Table 3).
We applied a lower UF rate threshold of 10 ml/h per kilogram to the full cohort and key subgroups (Supple-mental Table 4). Among the CMS cohort patients with heart failure (n=38,506), 24.8% had UF rates .13 ml/h per kilogram, and 45.4% had rates.10 ml/h per kilogram. Among patients with histories of intradialytic hypotension (n=30,045), 20.7% had UF rates .13 ml/h per kilogram, and 40.5% had rates.10 ml/h per kilogram. Measure and monthly results were similar.
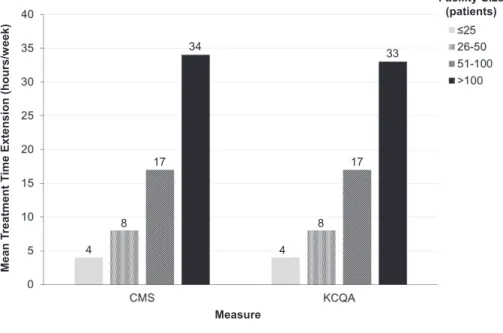
Facility TT Burden in the Setting of UF Rate Thresholds Among 103,850 patients in the January 2012 KCQA cohort, 20,152 (19%) had UF rates$13 ml/h per kilogram. Figure 3 depicts a single patient’s TT extension over 1 month in response to application of the KCQA UF rate threshold. To lower UF rates to ,13 ml/h per kilogram via TT extension (with total TT remaining at $4 hours), facilities would require a mean additional TT of 17616 h/wk. Larger facilities would require proportionately more TT compared with smaller facilities, with facilities with.100 patients requiring an additional 33 h/wk (Fig-ure 4). Percentages of patients with UF rates remaining $13 ml/h per kilogram after application of varied TT ex-tension paradigms are presented in Table 4. Supplemental Figure 2 displays facility TT burden if TTs were extended to bring UF rates to ,13 ml/h per kilogram without ap-plication of a 4-hour total TT maximum.
Discussion
In this study, we examined UF rate patterns and pro-posed UF rate quality measures and calculated the facility TT burden with UF rate threshold implementation. Patient UF rates fluctuated over the course of the year, with the highest UF rates occurring in winter and the lowest rates occurring in summer. Patients with higher UF rates were more likely to be women, nonblack, and Hispanic and have lower body weight and heart failure. Facilities with higher percentages of patients with elevated UF rates were more likely to be located in the western Unites States and have fewer black and more Hispanic patients compared with facilities with lower percentages. Extension of TT as a
strategy to reduce UF rates resulted in a mean weekly facility burden of 17 TT hours when total TTs were capped at 4 hours.
Existing observational data suggest an association be-tween higher UF rates and adverse outcomes (11,12). Al-though these associations have not been prospectively tested, they are supported by plausible physiologic mech-anisms, including UF–related end organ ischemia and hy-pervolemia from hemodynamic instability reactive measures (13,14). UF rates are determined by the amount offluid removed (typically equivalent to IDWG) and HD duration. Dialysis providers prescribe UF volume and TT, rendering UF rates within facility control. Reducing UF volumes to curb UF rates without concurrent IDWG re-duction would leave patients disadvantageously volume expanded. Thus, extending TT or adding supplemental treatments would likely be required to lower UF rates. However, patients are generally averse to longer TTs (15), raising concern about patient acceptance and under-scoring the need for prospective study. Despite these un-certainties, CMS is considering inclusion of a UF rate quality measure in the 2019 QIP (7).
The ESRD QIP aims to promote patient health by providingfinancial incentive for dialysis facilities to deliver high-quality care. In this value–based care model, clinical measures are intended to improve outcomes, reduce dis-parities, and limit unintended consequences (16). We eval-uated UF rate patterns and considered different approaches to measure definition. We found that UF rates vary over the calendar year. This month to month varia-tion, plausibly related to seasonal hydration patterns, sug-gests that a monthly measure, as proposed by CMS, best captures facility UF rate practices. An annual measure, as recommended by KCQA, obscures seasonal variation. Also, we showed that UF rates vary by assessment day, with greater UF rates occurring after the long interdialytic break. Mean–based UF rate measures, as proposed by KCQA, may best capture facility practices and thwart gaming, a practice made easier by reliance on a single value. Although single UF rate values are easier to collect, theirfluctuations limit utility, particularly if day of week collection standards are not specified.
Our data highlight patient and facility differences across higher (versus lower) UF rates that may have unintended consequences. We showed that patients with higher UF rates are more likely to be women, nonblack, and Hispanic and have lower body weight. Facilities with higher UF rate measure scores (less favorable) were more likely to be located in the western United States compared with facilities with lower scores. Lower proportions of black patients, higher proportions of Hispanic patients, and body size differences likely account for these geographic differ-ences (Supplemental Table 5). Such discrepancies highlight the importance of additional investigation of the UF rate and outcome association across categories of race, sex, and body size.
at rates.13 ml/h per kilogram. This risk threshold varied by subgroups: patients with heart failure had a higher mortality risk at lower UF rates (10–13 ml/h per kilo-gram), whereas patients without heart failure did not (12). In this study, we reported that almost 50% of patients with heart failure had UF rates.10 ml/h per kilogram. We found that over one third of other hemodynamically vulnerable subpopulations, such as patients with low pre–HD BP and intradialytic hypotension, had monthly UF rates .10 ml/h per kilogram. The proposed thresh-old might leave many high–risk patients inadequately protected.
Selection criteria designation is critical to measure de-velopment. The KCQA and the CMS measures differ in numerator specifications. The KCQA measure includes a TT caveat: the numerator includes patients with UF rates $13 ml/h per kilogram and TTs,240 minutes. The
treating .100 patients required 33 h/wk of extra treat-ment to lower UF rates to ,13 ml/h per kilogram in the setting of a 4-hour TT maximum. When the 4-hour TT cap was omitted, the additional weekly facility treatment hours tripled. Increased TT is associated with substantial costs related to staffing, supplies, water, and utilities. Fur-thermore, added TT has implications beyond cost. Extend-ing HD treatments would have consequences for other patients who would be subject to fluctuating start times
when earlier patients required longer treatments. In this regard, the 4-hour TT carve out might minimize disrup-tions to other patients.
Titrated HD treatments pose substantial patient and facility challenges, suggesting that IDWG reduction may represent the most feasible UF rate reduction approach. Intensive dietary salt counseling has been shown to reduce weight gains (17,18). Nutritional programs that teach salt (and fluid) restriction in ways that are relatable to and Figure 4.|Weekly required additional facility treatment time (TT) for a maximum run time of 4 hours with the application of a 13-ml/h per kilogram ultrafiltration (UF) rate threshold stratified by facility size.The additional TT required to lower prescribed UF rates to,13 ml/h per kilogram was computed at the facility level and stratified by facility size. Total TT was capped at 4 hours per the Kidney Care Quality Alliance (KCQA) specifications. For these analyses, prescribed UF rate (milliliters per hour per kilogram) was calculated using the formula (predialysis weight from current treatment2postdialysis weight from previous treatment [milliliters])/prescribed TT (hours)/postdialysis weight from previous treatment (kilograms). For treatments with a prescribed UF rate of,13 ml/h per kilogram, no additional TT was assigned. For treatments with a prescribed UF rate of$13 ml/h per kilogram, the additional TT (minutes) needed to achieve the UF rate,13 ml/h per kilogram was calculated as follows: ([predialysis weight from current treatment2postdialysis weight from previous treatment (milliliters)]/[postdialysis weight from previous treatment (kilograms)312.9])3602prescribed TT (minutes). Total TT was capped at 4 hours per treatment, such that the UF rate remained at$13 ml/h per kilogram for treatments in which UF rate reduction to rates,13 ml/h per kilogram would result in TT ex-tension beyond 4 hours. Additional patient TTs were then summed for the month at the patient and then facility levels. Detailed methods for estimation of TT extension are described in Supplemental Table 2. CMS, Centers for Medicare and Medicaid Services.
Table 4. Proportion of patients with ultrafiltration rates‡13 ml/h per kilogram after application of varied hypothetical treatment time extension paradigms
Facility TT Change
UF Rate$13 ml/h per kg before TT Extension,
% (no. of patients)
UF Rate$13 ml/h per kg after TT Extension,
% (no. of patients)
Extend TT by 15 min if TT is,240 min 19.4 (20,152) 15.8. (16,418)
Extend TT by 30 min if TT is,240 min 19.4 (20,152) 12.8 (13,332)
Extend TT to 240 min if TT is,240 min 19.4 (20,152) 11.0 (11,395)
Extend TT long enough to achieve
UF rate,13 ml/h per kg if TT is,240 min
19.4 (20,152) 3.1 (3199)
Extend TT long enough to achieve
UF rate,13 ml/h per kg regardless of TT
19.4 (20,152) 0.0 (0)
achievable by patients are needed. However, it is unlikely that dietary restrictions on their own will be enough to lower UF rates for all patients, and facilities will need to adopt a moreflexible approach to dialysis provision. An-other approach to weight gain reduction is dialysate so-dium adjustment, but outcome data are mixed (19,20). Finally, it is plausible that UF rate threshold implementa-tion will incentivize some patients to curb excessive salt andfluid intake to avoid longer treatments, offsetting fa-cility burden.
Overall, our data highlight the challenges, uncertainties, and potential consequences of an ESRD QIP UF rate measure. Incorporation of exceptions and flexibility not previously applied to other QIP measures might optimize the UF rate measure. For example, should facilities be exempted from financial penalties if patients decline longer treatments and the facility documents good faith efforts at IDWG reduction? Would it be feasible to tie reimbursement to dialysis time rather than the currentfixed reimbursement per treatment? How can reimbursement policies be altered to incentivize home-based therapies that allow for more frequent treatments with more gradual UF? How should patient preferences be incorporated into measure implementation? The proposed UF rate QIP measure is a criticalfirst step in codifying optimal volume management into high–quality dialysis care, but the challenges of volume management, particularly given the ab-sence of objective measures, introduce complexities that should be recognized.
Our results must be considered in the context of study limitations. First, most importantly, we considered data from a single LDO. The facility–level UF rate patterns that we observed may not be representative of other dialysis organizations’facility patterns. UF rate patterns may vary under different clinical protocols. Second, our study is de-scriptive. Conclusions about differences in the UF rate and outcome association across subpopulations cannot be drawn. Third, we estimated the amount of additional fa-cility TT that would be required with UF rate threshold implementation. In these calculations, we used prescribed rather than delivered UF rates and assumed that treat-ments for all patients with elevated UF rates would be extended. We were unable to account for patient refusal of TT extension or potential effects from more intensive dietary counseling. Fourth, we used UF rate measure def-initions and selection criteria according to the CMS and the KCQA specifications. Results cannot be generalized to excluded populations, such as children and patients from facilities with,11 patients.
In conclusion, ourfindings suggest a need for reconsid-eration of the proposed UF rate measure definition and additional research regarding the UF rate to outcome association in key subpopulations. Before adoption of UF rate as a dialysis facility quality indicator, prospective studies of patient and facility consequences of UF rate threshold implementation as well as pilot studies of the proposed rule are needed.
Acknowledgments
The authors thank Alan Brookhart for data access and his in-sightful comments on analyses and Diane Reams for her data and contract management assistance. The authors also thank DaVita Clinical Research for providing data for this study.
M.M.A. is supported by National Institute of Diabetes and Di-gestive and Kidney Diseases of the National Institutes of Health grant T32 DK007750.
DaVita Clinical Research had no role in the design or im-plementation of this study or the decision to publish.
Disclosures
J.E.F. has received speaking honoraria from Dialysis Clinic, Incorporated; Renal Ventures; American Renal Associates; the American Society of Nephrology; and Baxter. J.E.F. and M.M.A. have received research funding for studies unrelated to this study from the Renal Research Institute, a subsidiary of Fresenius Medical Care, North America.
References
1. Arneson TJ, Liu J, Qiu Y, Gilbertson DT, Foley RN, Collins AJ: Hospital treatment for fluid overload in the Medicare hemodi-alysis population.Clin J Am Soc Nephrol5: 1054–1063, 2010 2. Stefa´nsson BV, Brunelli SM, Cabrera C, Rosenbaum D, Anum E,
Ramakrishnan K, Jensen DE, Sta˚lhammar NO: Intradialytic hy-potension and risk of cardiovascular disease.Clin J Am Soc Nephrol9: 2124–2132, 2014
3. Weiner DE, Brunelli SM, Hunt A, Schiller B, Glassock R, Maddux FW, Johnson D, Parker T, Nissenson A: Improving clinical out-comes among hemodialysis patients: A proposal for a “volume first” approach from the chief medical officers of US dialysis providers.Am J Kidney Dis64: 685–695, 2014
4. Agar JW: Personal viewpoint: Limiting maximum ultrafiltration rate as a potential new measure of dialysis adequacy.Hemodial Int20: 15–21, 2016
5. National Quality Forum: About us. Available at: http://www. qualityforum.org/story/About_Us.aspx. Accessed November 30, 2015
6. National Quality Forum: Renal: Draft report. Available at: https:// www.google.com/url?sa=t&rct=j&q=&esrc=s&source=web&cd= 1&cad=rja&uact=8&ved=0ahUKEwja5cqlzr7JAhXDPiYKHTQUCHU QFggcMAA&url=http%3A%2F%2Fwww.qualityforum.org%2 FProjects%2Fn-r%2FRenal_Measures%2FDraft_Report_for_Comment. aspx&usg=AFQjCNFGMoefydMrs7WvIqT7_l1_3wncjw&sig2= f0jP__24ngTVnc9pohVNBA. Accessed November 30, 2015 7. National Archives and Records Administration: Federal Register.
Available at: http://www.gpo.gov/fdsys/pkg/FR-2015-11-06/pdf/ 2015-27928.pdf. Accessed November 30, 2015
8. Cabrera C, Brunelli SM, Rosenbaum D, Anum E, Ramakrishnan K, Jensen DE, Sta˚lhammar NO, Stefa´nsson BV: A retrospective, longitudinal study estimating the association between inter-dialytic weight gain and cardiovascular events and death in he-modialysis patients.BMC Nephrol16: 113, 2015
9. Kidney Care Partners: Available at: http://kidneycarepartners. com/. Accessed February 22, 2016
10. US Renal Data System:USRDS 2013 Annual Data Report: Atlas of End-Stage Renal Disease in the United States, Bethesda, MD, USA: National Institutes of Health, National Institute of Diabetes and Digestive and Kidney Diseases, 2013
11. Movilli E, Gaggia P, Zubani R, Camerini C, Vizzardi V, Parrinello G, Savoldi S, Fischer MS, Londrino F, Cancarini G: Association between high ultrafiltration rates and mortality in uraemic pa-tients on regular haemodialysis. A 5-year prospective observa-tional multicentre study.Nephrol Dial Transplant22: 3547– 3552, 2007
12. Flythe JE, Kimmel SE, Brunelli SM: Rapid fluid removal during dialysis is associated with cardiovascular morbidity and mortal-ity.Kidney Int79: 250–257, 2011
13. Burton JO, Jefferies HJ, Selby NM, McIntyre CW: Hemodialysis-induced cardiac injury: Determinants and associated outcomes. Clin J Am Soc Nephrol4: 914–920, 2009
14. McIntyre CW, Odudu A: Hemodialysis-associated cardiomy-opathy: A newly defined disease entity.Semin Dial27: 87–97, 2014
16. Centers for Medicare and Medicaid Services: End-Stage renal disease quality incentive program. Available at: https://www. cms.gov/medicare/quality-initiatives-patient-assessment-instruments/ esrdqip/index.html. Accessed November 30, 2015
17. Chazot C: Can chronic volume overload be recognized and prevented in hemodialysis patients? Use of a restricted-salt diet. Semin Dial22: 482–486, 2009
18. Kayikcioglu M, Tumuklu M, Ozkahya M, Ozdogan O, Asci G, Duman S, Toz H, Can LH, Basci A, Ok E: The benefit of salt re-striction in the treatment of end-stage renal disease by haemo-dialysis.Nephrol Dial Transplant24: 956–962, 2009 19. Davenport A, Cox C, Thuraisingham R; PanThames Renal Audit
Group: The importance of dialysate sodium concentration in de-termining interdialytic weight gains in chronic hemodialysis patients: The PanThames Renal Audit.Int J Artif Organs31: 411–417, 2008 20. Mc Causland FR, Waikar SS: Optimal dialysate sodium-what is
the evidence?Semin Dial27: 128–134, 2014
21. KCQA: KCQA Measure Development. Available at: http:// kidneycarepartners.com/kidney-care-quality-alliance-kcqa/ measure-development-process/. Accessed February 22, 2016
Received:December 18, 2015Accepted:April 4, 2016
Published online ahead of print. Publication date available at www. cjasn.org.
See related editorial,“Fluid First or Not So Fast: Ultrafiltration Rate and the ESRD Quality Incentive Program,”on pages XXX–XXX.