Non-adaptive phenotypic plasticity: the effects of
terrestrial and aquatic herbicides on larval salamander
morphology and swim speed
NICHOLAS A. LEVIS
†*, MITCHELL L. SCHOOLER, JARRETT R. JOHNSON and
MICHAEL L. COLLYER
Department of Biology, Western Kentucky University, Bowling Green, KY, 42101, USA
Received 20 July 2015; revised 16 November 2015; accepted for publication 16 November 2015
Phenotypic plasticity, although ubiquitous, may not always be advantageous. Non-adaptive plasticity is likely to occur in response to novel environmental stress. Anthropogenic contaminants, such as herbicides, are novel stressors that are not present in the evolutionary history of most species. We investigated the pattern and consequences of phenotypic plasticity induced by four glyphosate-based herbicides (two terrestrial and two
aquatic) in larvae of the spotted salamander,Ambystoma maculatum, by determining (1) whether the herbicides
induced different morphologies; (2) if different morphologies translated to differences in burst swim performance; and (3) how induced individuals performed relative to non-induced controls. Different herbicide formulations led to the production of significantly different head and tail morphologies, and tail morphology correlated with fastest escape speed. However, escape speed did not vary among treatments. In addition, three out of four herbicide treatments experienced accelerated growth rates, in terms of the lateral size of tails, although the tail shapes were either similar to preliminary controls or intermediate between preliminary and final controls. These observations suggest that herbicide-induced morphology is a case of non-adaptive phenotypic plasticity, and that there is potentially a trade-off between growth and development for larvae exposed to different formulations. Understanding the functional significance of induced phenotypes is important for determining their importance in shaping an organism’s ecological interactions and evolutionary trajectories. Furthermore, under different conditions, the morphological changes that we observed in response to exposure to herbicides might affect
salamander fitness and influence population dynamics. © 2016 The Linnean Society of London, Biological
Journal of the Linnean Society, 2016,118, 569–581.
KEYWORDS: adaptation – amphibian – ecotoxicology – morphometrics – pesticide.
INTRODUCTION
The capacity of a single genotype to exhibit a range of phenotypes (i.e. developmental plasticity) is often advantageous in heterogeneous environments where selection favours different phenotypes depending on the environmental conditions (Gilbert & Epel, 2009). Such developmental (or phenotypic) plasticity in response to local environmental conditions provides a mechanism through which organisms can cope with spatial or temporal heterogeneity and improve their fitness in variable environments (Whitman & Agrawal, 2009). Furthermore, plasticity can play an
important role in the evolution of organisms (Pfennig et al., 2010; Moczek et al., 2011; Wund, 2012). For example, developmental plasticity may lead to the induction of behavioural, physiological or morpholog-ical traits that, by chance, improve an organism’s
fit-ness under stressful conditions (West-Eberhard,
2003). If there is heritable variation in the form or degree of plasticity to the stressful conditions, then selection should favour those genes that best extend, refine or stabilize them, a process dubbed genetic accommodation (West-Eberhard, 2003). In this way, plasticity may facilitate adaptation to a stressful environment.
A key caveat to this process of adaptive evolution is that some of the induced phenotypes, by coinci-dence, approach an adaptive peak in the stressful conditions. However, if the stressor is truly novel
*Corresponding author. E-mail: [email protected] †Current address: Department of Biology, University of North Carolina, Chapel Hill, NC 27599, USA
(i.e. unlike anything the species experienced in its evolutionary history), there is no reason to suspect that past selection has shaped reaction norms to
allow for phenotype–environment matching. In these
situations, most induced variants would likely be cases of non-adaptive plasticity where disturbance to development and/or breakdown of physiological pro-cesses results in environmentally induced pheno-types with a reduced fitness relative to the ancestral
phenotype (Ghalambor et al., 2007). Despite this
fit-ness reduction, traits exhibiting non-adaptive plastic-ity should be under strong directional selection and thus be able to potentiate rapid adaptive evolution
(Ghalamboret al., 2015).
Pond-breeding amphibians exhibit a wide variety of plastic responses to overcome an array of natural
environmental stressors (Pfennig, 1990; Relyea,
2001, 2002; Touchon & Warkentin, 2011). Perhaps their most striking plastic responses are morphologi-cal changes that are induced by predators (Van Bus-kirk & Relyea, 1998). Evidence from tadpoles of Rana lessonae suggests that different morphologies may be favoured in different environments (Wilson, Kraft & Van Damme, 2005). Tadpoles with low tails and narrow heads were considered to be good swim-mers and were induced by a ‘chase’ predator,
pump-kinseed sunfish (Lepomis gibossus). Conversely, an
ambush predator, dragonfly larvae (Aeshna cyanea),
induced high tails and wide heads, and tadpoles with this morphology were typically ‘bad swimmers’.
Simi-larly, the fastest Hyla versicolor tadpoles in a study
by Van Buskirk & McCollum (2000) had relatively shallow bodies and tail fins, which suggests that predator-induced high-tailed tadpoles were less vul-nerable to predation for reasons other than enhanced
swim performance. By contrast, deeper finned
Scaphiopus holbrookii and Rana sphenocephala tad-poles with small bodies produced the fastest speeds
(Dayton et al., 2005). In general, these
predator-induced morphologies are adaptive because they are all cases of a ‘natural’ stressor that the species has likely encountered at some point in its evolutionary history.
Glyphosate is a synthetic compound developed in the 1970s by the biotechnology corporation Monsanto and is marketed as an herbicide (glyphosate disrupts the plant-specific enzyme 5-enolpyruvylshikimate-3-phosphate synthase and kills plants by preventing aromatic amino acid synthesis) under the name ‘Roundup’. Glyphosate-based herbicides (GBHs) are the most widely applied herbicide in the world (Jones, Hammond & Relyea, 2011) and their use has increased 10-fold in the last 20 years (USGS, 2012). Additionally, the patent on glyphosate expired in 2000, leading to the development of many generic versions of the product that still use glyphosate as
the active ingredient but contain various other ingre-dients (e.g. the adjuvants). This growing number of formulations, coupled with increased rates of use, increases the likelihood of exposure on nontarget organisms such as amphibians. Because glyphosate is a synthetic compound developed within the last
50 years, many species may be evolutionarily na€ıve
in their response to its effects.
Indeed, various laboratory, mesocosm, and natural studies have found that GBHs negatively affect amphibians and aquatic systems through direct mor-tality or, more commonly, by sublethal effects such as altered physiology, morphology or food web
inter-actions (Baylis, 2000; Wojtaszek et al., 2004; Chen,
Hathaway & Folt, 2004; Edginton et al., 2004; Howe
et al., 2004; Cauble & Wagner, 2005; Relyea, Schoeppner & Hoverman, 2005; Bernal, Solomon &
Carrasquilla, 2009; Paganelli et al., 2010; Jones
et al., 2011; Ortiz-Santaliestra et al., 2011; Levis & Johnson, 2015). Most of these studies have primarily been interested in lethality and the conservation implications of amphibian exposure to GBHs because amphibians are experiencing global declines (Houla-hanet al., 2000; Stuartet al., 2004).
GBHs have also been shown to induce morphologi-cal changes in larval amphibians that can resemble
predator-induced morphologies in some species
(Relyea, 2012). Specifically, GBH exposure increased
tail depth in tadpoles ofRana pipiens and Rana
syl-vaticato the same extent as exposure to caged drag-onfly nymphs. This GBH-induced morphology is likely non-adaptive because (1) it occurs in the absence of dragonfly predators and (2) deep-tailed tadpoles grow more slowly and have a reduced sur-vival relative to ‘normal’ tadpoles when dragonflies are absent (Van Buskirk & Relyea, 1998). Because non-adaptive plasticity can lead to population
extinc-tion (Ghalamboret al., 2007; Morris & Rogers, 2013;
Morris et al., 2014), amphibians are already
experi-encing global population declines (Houlahan et al.,
2000; Stuart et al., 2004), and GBH use is so
wide-spread, an understanding of the implications of this novel stressor on induced phenotypes in amphibians is relevant for conservation efforts, as well as our general understanding of the role of plasticity in evo-lution.
To this end, we exposed spotted salamander larvae (Ambystoma maculatum; Shaw, 1802) to different GBH formulations, characterized the head and tail morphologies that these herbicides induced, and evaluated the swim performance of the induced mor-phologies. Using this approach, we aimed to answer three questions: (1) does exposure to different formu-lations result in different salamander morphologies and/or survival; (2) do morphological changes as a result of GBH exposure translate to differences in
functional swimming performance; and (3) do control individuals (i.e. individuals possessing the ancestral phenotype) outperform their induced counterparts? Swimming performance is a useful proxy for fitness for at least three reasons. First, amphibians with indirect development are fully aquatic and any per-turbation to their primary form of locomotion would likely have fitness consequences under natural condi-tions. Second, other environmental stressors (e.g. predators) induce adaptive changes that affect swim performance (see above). Third, environmental stress can lead to early metamorphosis, which involves dramatic morphological changes in amphibian lar-vae. Because other larval amphibians have produced similar tail morphologies in response to GBH and dragonflies (Relyea, 2012) and because spotted sala-mander larvae respond to dragonflies by developing shorter tails (Shaffery & Relyea, 2015), we expected this same outcome as a result of GBH exposure. However, an alternative morphology, such as larger tail fins, could also be expected because it represents the response of this species to a gape-limited ‘chase’ predator (Urban, 2010). We also predicted that indi-viduals possessing induced morphologies would be functionally inferior to controls (i.e. less fit or non-adapted) in terms of swim speed because GBHs are an evolutionarily novel stress resulting in poor
environment–phenotype matching.
MATERIAL AND METHODS ANIMAL COLLECTION
Four egg masses of A. maculatum were collected
from a pond in Warren County, KY (latitude:
36.87 N, longitude:86.25 W) on 16 April 2014. Egg
masses were held separately in plastic containers with 5 L of a 1 : 1 ratio of dechlorinated/deaminated tap water and natal pond water until hatching. For 2 weeks, larvae were held in their hatching
contain-ers and fed brine shrimp ad libitum daily. Water in
hatching boxes was partially changed once per week, and dead animals were removed. After 14 days post-hatching, five individuals from each egg mass were used to establish initial control morphological and
swim performance measurements (N=20) and then
25 other individuals were haphazardly divided
among four treatments and a final control (N=100).
Thus, each group (described below) contained five replicate individuals per egg mass from four repli-cate egg masses.
EXPERIMENTAL DESIGN
Despite the diversity of formulations available, all glyphosate-based herbicides can be placed into one of
two broad categories: ‘terrestrial’ and ‘aquatic’
depending on the presence or absence of surfactant compounds aimed at helping the glyphosate active ingredient to ‘stick’ to the plant for a sufficient length of time to be absorbed. Terrestrial GBHs con-tain a surfactant (often polyethoxylated tallowamine; POEA) and are typically restricted to terrestrial use, which is the most common location for GBH applica-tion (USGS, 2012). POEA has been found to nega-tively affect aquatic systems (Mann & Bidwell, 2001;
Tsui & Chu, 2003; Howeet al., 2004; Brausch, Beall
& Smith, 2007; Relyea & Jones, 2009). By contrast, aquatic GBHs lack a surfactant that may reduce potential toxicity to nontarget organisms, and are considered to be safe for aquatic systems if POEA is not added (Giesy, Dobson & Solomon, 2000; but see
Brodmanet al., 2010). Therefore, our five treatments
included two ‘aquatic’ herbicides, two ‘terrestrial’ herbicides, and dechlorinated/deaminated water as a control. For each herbicide class, one formulation was the Monsanto name-brand, and the other was a generic formulation. The specific herbicides were
AquaMaster (Monsanto), AquaNeat (Nufarm),
Roundup Pro Concentrate (Monsanto), and Helosate Plus Advanced (HELM). The key difference among these herbicides is that the terrestrial formulations each contain a proprietary surfactant and the aqua-tic herbicides do not. Typically, the aquaaqua-tic herbicide formulations would be combined with a surfactant before being used, although we did not add any sur-factants in this experiment. Thus, the aquatic herbi-cides can be considered as controls because they only contain glyphosate and not surfactant. Another dif-ference is that the name-brand and generic formula-tions potentially contain different amounts and compositions of other ‘inactive’, proprietary ingredi-ents (Table 1). These unknown differences may have important effects on amphibians.
Five larvae from each egg mass were placed indi-vidually into 500-mL glass jars containing 200 mL of
dechlorinated/deaminated tap water or 3 mg a.e. L–1
of each herbicide formulation. This concentration is within the range of actual observations recorded in nature (Edwards, Triplett & Kramer, 1980), but does not lead to significant mortality in this species (Relyea & Jones, 2009). Larvae were fed a 2-mL ali-quot of highly concentrated brine shrimp after place-ment into experiplace-mental jars. Because herbicides
break down over time, 5 L of 3 mg a.e. L–1 of each
herbicide was prepared and stored until jar water needed to be replaced because of fouling as a result of brine shrimp carcasses and larvae excretion. Therefore, the replacement water should have been at a similar concentration to the experimental water and not a ‘fresh’, higher-concentrated dose. Water
was changed in all jars halfway through the
experiment (i.e. after 7 days; total duration was 14 days) and a 2-mL aliquot of highly concentrated brine shrimp was again added. This relatively infre-quent feeding regime may have influenced larval morphology/swim performance. However, because conditions were consistent across treatments, valid comparisons can still be made (see Discussion).
SWIM TESTS
After 14 days, swim tests were performed by placing an individual in a clear plastic container containing 5 L of dechlorinated tap water on top of a grid and filming from above with a Nikon D700 camera at 29
frames s–1. After acclimation to the container for
2 min, each larva was gently prodded with a blunt wire perpendicular to the abdomen. Each individual was tested three times, although all larvae com-pleted their first trial before any individual was observed a second time. Similarly, all larvae com-pleted their second trial before any individual was tested for a third time. Videos were analyzed using the free, open-source Kinovea (http://kinovea.org) software that allows for placement of markers and timers on a slow motion video. We determined speed as the time that it took the larvae to swim three body lengths away from the point of origin because this distance exceeds the zone of danger presented by a sit-and-wait predator (Van Buskirk & McCol-lum, 2000). We determined the fastest speed as the fastest trial per individual. The conversion of this
time to a linear rate (mm s–1) based on larva length
altered neither interpretation, nor statistical out-comes. Each family had five individuals measured before exposure to any treatment (CI), as well as after 2 weeks of exposure to each treatment (de-scribed above), aiming to determine how morphology and swim speed changed during ontogeny when exposed to different conditions. After completion of all the swim trials, larvae were euthanized in 0.2% MS-222, fixed in 10% formalin, and stored in 70% ethanol until morphology was analyzed.
MORPHOLOGICAL DATA COLLECTION
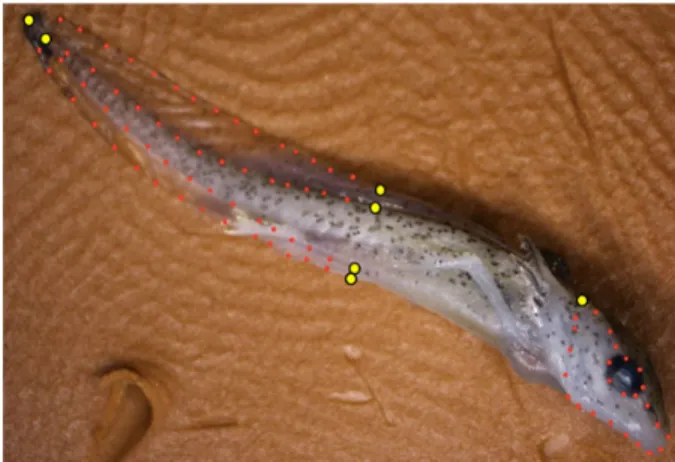
We photographed every viable specimen (some larvae were damaged during preservation) with a Shut-tlepix digital microscope (Nikon) mounted on a motorized stand, such that each specimen was pho-tographed with the same field depth. We used a photo-stacking technique that merged 12 digital images taken at equal height intervals over a range of 10 mm, ensuring visual focus despite the three-dimensional surface portrayed in the images. The right lateral surface of each specimen was pho-tographed in this manner. We digitized photos from 114 of the original 120 larval salamanders used in the experiment. Samples were comprised of 18 speci-mens from the initial control treatment (CI); 19 spec-imens from the final control treatment (CF); 20 specimens each from the aquatic generic and Mon-santo treatments (AG and AM, respectively); and 18 and 19 specimens from the generic (TG) and Mon-santo terrestrial treatments, respectively. For each specimen, we estimated tail shape using six fixed-and 58 semi-lfixed-andmarks fixed-and head shape using one fixed- and 25 semi-landmarks (Fig. 1).
Table 1. Description of the herbicides used in the present study
Herbicide Type Surfactant Percentage active ingredient Percentage unlisted ingredients
Roundup Pro Concentrate T Proprietary 50.2 49.8 (13% surfactant)
Helosate Plus Advanced T Proprietary 41.0 59.0
AquaMaster A None 53.8 46.2
AquaNeat A None 53.8 46.2
Both of the terrestrial herbicides contained a proprietary surfactant, and the aquatic herbicides lack a surfactant.
Herbi-cide concentrations used in this experiment were standardized to 3 mg acid equivalent (L glyphosate)–1. They had
differ-ent amounts of unlisted ingredidiffer-ents. Percdiffer-entage ingredidiffer-ent information came directly from the manufacturer’s label. T, terrestrial; A, aquatic.
Figure 1. Anatomical landmarks used in the present study. Large yellow points are fixed landmarks; small red points are semi-landmarks. Photograph by M. Schooler.
We used landmark-based geometric morphometrics to quantify attributes of body shape (Adams, Rohlf & Slice, 2013), based on anatomical landmarks digi-tized on resulting photographs. A generalized Pro-crustes analysis (GPA) (Rohlf & Slice, 1990) was used to render landmark configurations invariant in size, orientation, and position via generalized least squares superimposition. These ‘Procrustes’ residuals were projected into a Euclidean space tangent to the shape space that contains them, and used as shape variables for various statistical analyses that rely on linear models. During GPA, semi-landmarks (Book-stein, 1997; Gunz & Mitteroecker, 2013) were used to estimate curves based on a minimized squared Procrustes distances criterion (Procrustes distance is the square root of the summed squared distances between corresponding landmarks). Resulting Pro-crustes residuals (projected into tangent space) were used as shape variables in subsequent statistical analyses. Digitization of landmarks on specimens was performed with TPSDIG2 (Rohlf, 2014). GPA was performed with GEOMORPH, version 2.1.3 (Adams & Otarola-Castillo, 2013) within R, version 3.1.3 (R-Core-Team, 2015).
STATISTICAL ANALYSIS
At the individual level, correlations between shape, size, and swim speed were investigated by two-block partial least squares (PLS) analyses (Rohlf & Corti, 2000). PLS is a matrix association (correlation) test that performs a singular-value decomposition on the cross-covariances between variables of two matrices. A randomization test is used to infer the significance of matrix association. For univariate data, PLS is the same as a randomization test on a Pearson pro-duct-moment correlation coefficient. We performed PLS on associations between shape and size, fastest swim speed and size, and fastest swim speed and shape. Head and tail sizes were measured as the centroid sizes of their landmark configurations. Cen-troid size (CS) is calculated as the square root of the summed squared distances of landmarks from their centre of gravity (centroid), based on the configura-tions of landmarks that defined their shape, prior to GPA. CS values were log-transformed prior to analy-sis. PLS performed on head shape and tail shape is a test of their morphological integration (Bookstein et al., 2003). A significant result in this case would indicate that these separate aspects of shape are not independent.
We subsequently performed several analyses using a nonparametric method of (multivariate) analysis of variance (ANOVA) for high-dimensional data (Col-lyer, Sekora & Adams, 2015). High-dimensional data are comprised of variables that exceed the number of
subjects analyzed. The nonparametric ANOVA uses traces of sum of squares and cross-products matrices to calculate sums of squares and evaluate model effect sizes via a randomized residual permutation procedure (RRPP). These statistics are not dependent on degrees of freedom, and it has been shown that using more landmarks rather than less can increase effect sizes and result in a better resolution for
detecting subtle effects (Collyer et al., 2015). As
such, we were able to analyze treatment effects for the different representations of shape, size, and swim speed described above with the same analytical method. Initially, mixed linear models that included family effects, plus family nested in treatment effects, were used to determine whether family effects were significant or varied with treatments. The results of preliminary tests are provided in the Supporting information (Table S1). Two conclusions were pervasive: (1) although there were significant family effects in our analyses, the effect sizes for interactions between family and specimen size, or between family and treatment, were not significant and (2) although there was significant allometric scaling in our analyses (where shape allometry is the
covariation of shape and size), any interaction
between specimen size and a model factor (treatment, family) was not significant. We therefore removed interactions from the linear models, retained size as a covariate, and accounted for family as a ‘random’ effect by adjusting Procrustes residuals, as
y0j¼^lþyijyi;
where yijis the vector of Procrustes residuals for the
jth individual from family i, yi is the vector of
Pro-crustes residuals for the mean of family i, and ^l is
the overall mean. Thus,y0jis the vector of Procrustes
residuals independent of the effect of family. Subse-quent analyses used these Procrustes residuals as shape variables, treatment as a fixed effect, and the log of specimen CS as a covariate.
We performed a nonparametric ANOVA with RRPP for 1000 random permutations (including observed cases). In each test, the standard deviate of
observed SS for model effects (Z-score) from the
empirical sampling distributions of random SS was
calculated as a measure of effect size (Collyer et al.,
2015), which facilitated comparisons within and across analyses. An additional benefit of the non-parametric ANOVA procedure is that appropriate pairwise comparisons between treatments could be performed simultaneously with the same random permutations used to analyze model effects. We per-formed all pairwise comparisons of least squares means among treatments in each nonparametric ANOVA. The test statistic in each case was the
Procrustes distance between treatment levels. Because this procedure is a simultaneous test of mul-tiple tests statistics rather than mulmul-tiple post-hoc tests, we did not adjust the family-wise acceptable
type I error rate of a=0.05 for multiple
compar-isons. All statistical analyses were performed with GEOMORPH, version 2.1.3 (Adams & Otarola-Cas-tillo, 2013) within R, version 3.1.3 (R-Core-Team, 2015).
Visualization of shape variation in the space tan-gent to shape space (henceforth the morphospace) was made possible via a principal component (PC) analysis (performed on the covariance matrix esti-mated from allometry-free Procrustes residuals) and projection of Procrustes residuals onto the PCs. Shape allometry was held constant by first regress-ing Procrustes residuals against the log of specimen size and adding residuals from this regression to the consensus (overall mean) configuration, as was car-ried out with family effects previously. This proce-dure is analogous to finding least squares means in analyses of covariance, and was also justified by an indication that shape allometries were consistent
among treatments (see Supporting information,
Table S2 and above).
In addition to visualizing shape variation among specimens using allometry-free Procrustes residuals, a thin-plate spline (Bookstein, 1991) was used to generate transformation grids of different locations of means in the morphospace, providing a mechanis-tic interpretation of shape change among treatments.
RESULTS
We did not observe any differences in mortality among treatments; all animals survived for the dura-tion of the experiment. Our PLS tests revealed
sev-eral significant positive correlations (Table 2).
Significant allometric patterns suggested that, as the
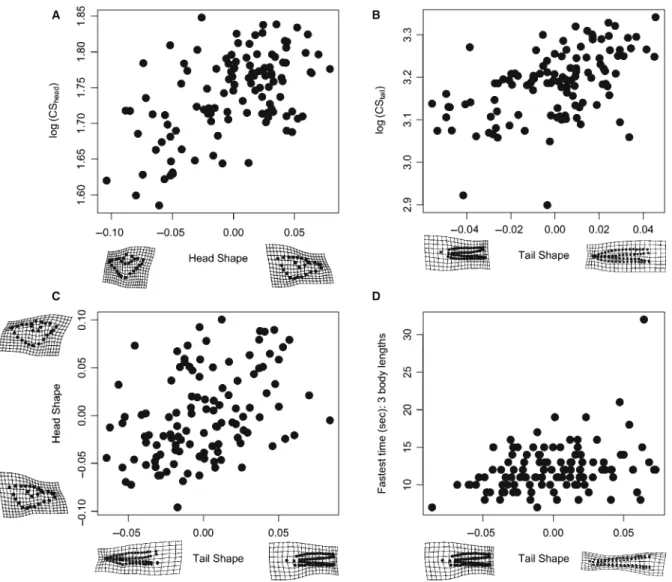
head and tail size increased, both shapes became more ‘pointed’ (Fig. 2A, B); furthermore, there was a significant integration of head shape and tail shape; individuals with ‘broad’ shaped heads tended to have tails with ‘broad’ tail fins (Fig. 2C). Swim speed was significantly correlated with tail shape (Table 2), but not tail size. Transformation grids associated with PLS shape scores suggested a greater propensity for deeper-finned tails, especially at the posterior of the tail, which was associated with a faster swim speed (Fig. 2D).
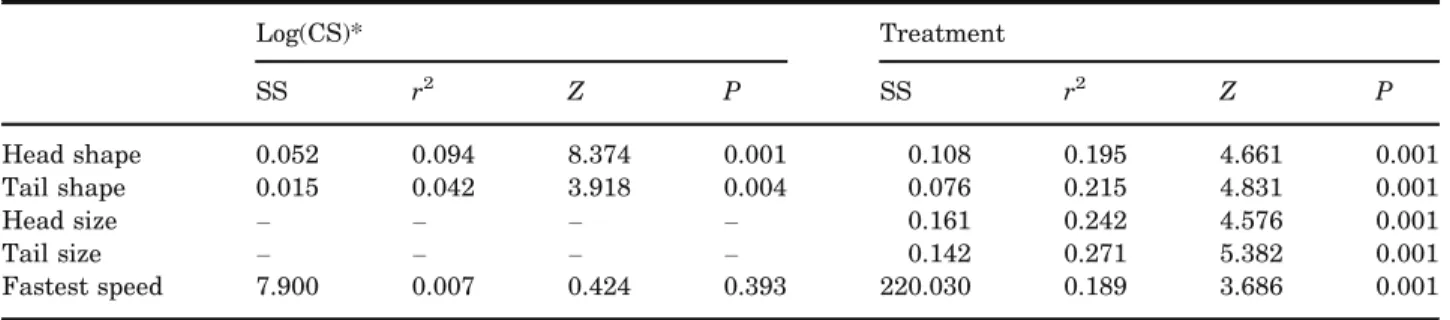
Shape variation among treatments was significant for each configuration and effect sizes were similar (Table 3). Pairwise Procrustes distances in head shape were significant in each case, except the con-trast between AG and AM, as well as the concon-trast between CF and TM. This pattern was similar for tail shape, although Procrustes distances between CI and both aquatic treatments, and between AM and TM were also not significant (Table 4). When viewed in terms of the contrast between CI and CF treat-ments, representing an expected shape change in the absence of GBH, no treatment diverged morphologi-cally from pre-treatment conditions as much as CF for either tail shape or head shape (Fig. 3). For head shape, the TG mean did not diverge significantly from the CI mean; all other treatment means diverged significantly in the same general direction as the CF mean but not to the same extent. As such, the first PC (42.8% of overall variation) largely
reflected a divergence axis associated with CI–CF
shape differences, which was principally indicative of snout elongation. For tail shape, the pattern of shape change was more complex. The AM and AG treat-ment means did not diverge significantly from the CI mean. The TM treatment mean diverged in a direc-tion consistent with the CF treatment but not to the same extent; the TG mean diverged in a direction almost opposite the CF mean along the first PC (38.0% of the overall variation explained). The first PC was again largely aligned with the shape change between CI and CF, and indicated tapering of the posterior tail (reduced tail fins) for the CF treatment. All other treatments either had less reduced tail fins (TM), retained deep-finned tails (AM and AG) or developed deeper-finned tails (TG). Tail shape varia-tion associated with the second and third PCs appeared to indicate more heterogeneity in the rela-tive depth of dorsal and ventral fins.
Although the GBH treatments appeared to hinder morphological development in terms of head and tail shapes, growth in head size was largely consistent with the control for all treatments (Fig. 4A) and growth in tail size generally exceeded the control for GBH treatments (Fig. 4B). All GBH treatments except the TG treatment, which had the relatively Table 2. Above the diagonal: two-block partial least
squares correlations (r) for relevant comparisons; below
the diagonal: correspondingP-values for each correlation
Head shape
Tail shape
log (CShead)
log (CStail)
Swim speed
Head shape – 0.398 0.53 NA 0.206
Tail shape 0.005 – NA 0.516 0.318
log(CShead) 0.001 NA – 0.438 0.087
log(CStail) NA 0.001 0.001 – 0.061
Swim speed 0.636 0.031 0.183 0.273 –
CS, centroid size; NA, not applicable (i.e. irrelevant com-parison that was not made).
Bold indicates significant correlations.
largest and deepest posterior tail fin, grew signifi-cantly larger tail sizes (measured as the log of cen-troid size) than the CF treatment, which did not significantly differ from the CI treatment mean. The TG treatment mean size was intermediate between CF and all other GBH means, and significantly lar-ger than the CI mean. The general trend was that GBH treatments (1) retarded snout elongation but had no effect on the increase in head size and (2) increased the size of the tail at the same time as maintaining a deep profile. For swim speed, signifi-cant inter-treatment variation was found but only because the CI treatment was faster than the others. Removal of the CI treatment rendered variation
nonsignificant in each case (results not shown; but see Fig. 4C). Our results could misinform actual swim speeds because we measured the amount of time to travel three body lengths. Larger salaman-ders would have to swim farther in the same amount of time to produce the same speeds as smaller sala-manders. We also converted the time to swim three body lengths into a rate, using body length to esti-mate distance. This conversion produced an almost identical correlation between swim speed and tail size, which was also not significant; results not shown. Furthermore, because the tail size was used as a covariate in the analysis of swim speed, a spuri-ous result is unlikely unless the experiment did not
A B
C D
Figure 2. Two-block partial least squares (2B PLS) projections of shape values for correlation analyses using shape. Transformation grids emphasize extremes along the shape axis. Greater change in shape indicates greater association between shape and the alternative variable. Individuals with larger heads (A) and tails (B) tended to have more pointed snouts and tails, respectively. Similarly, individuals with ‘broader’ heads typically had ‘broader’ tails (i.e. larger tail fin relative to tail muscle; C). In (D), burst swim time increased as tails became more pointed. Points in (D) are scaled rela-tive to tail size to help facilitate allometric scaling of shape.
adequately measure burst speed. Finally, it is odd that tail size and tail shape were correlated, and tail shape and fastest speed were correlated, although tail size and fastest speed were not. This is a possible outcome with multivariate data because correlations can manifest in different dimensions of the mor-phospace. This appears to be the case in the present study, as indicated by the transformation grids in these separate relationships (Fig. 2).
DISCUSSION
Our results indicate that these herbicide formula-tions are nontoxic to salamanders at the concentra-tions used, although they differentially alter both head and tail morphology. In addition, tail morphol-ogy was significantly correlated with the fastest escape swim speed (Fig. 2D and Table 2), although there was no difference in any swim speed measure-ment among treatmeasure-ments. Therefore, our data suggest
that herbicide-induced morphological change in
spotted salamanders has no negative consequences
on swim speed under controlled conditions. However, the observed plasticity may represent a trade-off between growth and development that could be adap-tive in other environmental contexts.
The significant correlation between head shape and tail shape (Table 2) suggests that these morpho-logical attributes were ‘integrated’. The pattern of morphological integration indicated that elongation of snouts is associated with tapering of the posterior tail. These patterns were largely consistent with allometric trends, suggesting that morphology is integrated through development. Despite this inte-gration, there was much variation in either shape with respect to the other shape, and treatment differences in head shape and tail shape were not completely consistent.
In terms of head shape and tail shape, the CF treatment had the most divergent mean shapes that also qualitatively tended more toward the typical head and tail shapes of terrestrial adult salamanders (similar to the expected changes preceding metamor-phosis). GBH-treated salamanders had head shapes that remained similar to initial larval head shapes or were intermediate between CI and CF head shapes, although they were the same size as the final untreated salamanders. These results suggest an arrest or slowing of morphological developmental change but a continuation of growth (i.e. hete-rochrony). We observed an increased lateral size of tails relative to controls for salamanders in three of the four GBH treatments, whereas tail shapes for these three treatments (AG, AM, and TM) were either similar to CI tail shape (AM or AG) or inter-mediate between CI and CF tail shapes (TM). The tail shape of salamanders in the TG treatment is slightly difficult to reconcile. On the one hand, the small change or intermediate tail shapes of salamanders in the other three GBH treatments with larger tail sizes could suggest either a slowing of the develop-mental process or its cessation early in the experi-Table 3. Nonparametric analysis of variance statistics for inter-treatment variation
Log(CS)* Treatment
SS r2 Z P SS r2 Z P
Head shape 0.052 0.094 8.374 0.001 0.108 0.195 4.661 0.001
Tail shape 0.015 0.042 3.918 0.004 0.076 0.215 4.831 0.001
Head size – – – – 0.161 0.242 4.576 0.001
Tail size – – – – 0.142 0.271 5.382 0.001
Fastest speed 7.900 0.007 0.424 0.393 220.030 0.189 3.686 0.001
Because variables significantly covaried with specimen size, effects are also presented for the log of centroid size (CS),
unless the response variable is a measurement of size itself. Effect sizes (Z-scores) indicate the size of the effect as a
standard deviate of the sums of squares (SS) from its sampling distribution.
*CS of tail shape used for swim trial analyses; otherwise, CS matched configuration used to estimate shape.
Table 4. Pairwise Procrustes distances in shape
AG AM CF CI TG TM
AG 0.030 0.042 0.041 0.044 0.039
AM 0.024 0.040 0.046 0.049 0.041
CF 0.049 0.043 0.072 0.073 0.024
CI 0.028 0.021 0.052 0.028 0.068
TG 0.045 0.041 0.072 0.032 0.069
TM 0.036 0.024 0.026 0.034 0.051
AG, aquatic generic; AM, aquatic Monsanto; CF, final control; CI, initial control; TG, terrestrial generic; TM, terrestrial Monsanto.
Distances for head shape are above the diagonal and dis-tances for tail shape are shown below. Disdis-tances that are
significantly>0 (P<0.05) are shown in bold.
ment, followed by recovery after growing larger tails. However, the deeper-finned tail shape of the TG salamanders, especially in the posterior of the tail, and an intermediate tail size that was more consis-tent with the tail size of salamanders in the CF treatment, suggests that larval salamanders can either grow larger tails or change the shape of their tails when exposed to herbicides. This result also suggests that different GBHs might induce different
size–shape trade-offs, presumably as a result of the
different chemical formulations of adjuvants. Despite the possibility of herbicide-induced heterochrony, we cannot say for certain whether a delay in develop-ment occurred because we terminated the experi-ment prior to metamorphosis to obtain morphometric data. Future studies aimed at collecting detailed lon-gitudinal data of larvae in GBH treatments that also vary the concentration of herbicides might clarify more precisely whether developmental trade-offs are pulsed or continuous during development.
The exact mechanism leading to our observed mor-phological changes is unknown. The mechanism may involve disruption of the hypothalamic-pituitary-thyroid axis because of its role in development and
metamorphosis (Fort et al., 2007). It may also
be related to perturbation of the immune system because previous studies have shown an increase in the number neutrophils, a decrease in the number of
lymphocytes, and a reduction in T-lymphocyte
recruitment in larval amphibians exposed to GBHs (Burraco, Duarte & Gomez-Mestre, 2013; Levis & Johnson, 2015). Another possibility is that elevated levels of corticosterone also played a role in the developmental plasticity that we observed. However, this is unlikely because the corticosterone level did
not change in response to 1 mg L–1 GBH in other
species (Burraco et al., 2013). Although the
mecha-nisms underlying developmental changes leading to metamorphosis are fairly well understood, much less is known about the mechanisms leading to the pro-duction of non-adaptive morphologies. Thus, further investigation of these possible pathways should yield valuable insights.
Although morphology significantly differed among treatments, swim speed did not appear to be affected. Consistent with previous studies (Landberg & Azizi, 2010), the fastest swim speeds were correlated with deeper tail fin area. However, all treatments, regard-less of morphology, had similar swim speeds. Differ-ences in morphology and swim speed between CI and all other treatments may be, at least partially, a result of differences in growth or feeding regime. Specifi-cally, the experimental larvae may have been under more food stress than CI because the brine shrimp in each jar died after approximately 3 days. However, because the non-CI treatments all experienced similar Figure 3. Principal component (PC) plots of shape variation in tail (A) and head (B). Plots are shown for the first three PCs, accounting for 63.2% and 73.2% of the overall shape variation in all dimensions for head shape and tail shape, respectively. Each treatment is represented by a 95% confidence ellipsoid (non-overlapping ellipsoids are generally but not necessarily significantly different because not all dimensions are shown). Transformation grids (deformation
scaled92) are shown (for some treatment means) to help visualize shape change (these grids were estimated using all
dimensions of shape). Treatment labels and colours correspond between this plot and those in Fig. 4. AG, aquatic gen-eric; AM, aquatic Monsanto; CF, final control; CI, initial control; TG, terrestrial gengen-eric; TM, terrestrial Monsanto.
feeding conditions, the differences in morphology, as well as similarities in swim speed, among them were likely a result of herbicide formulation differences or different interactions between herbicide exposure and food stress. In the case of morphology, herbicide differ-ences must be important because at least some of the treatment groups differed from CF, which is the group that only experienced food stress. Conversely, for swim speed, the potential food stress may be more important because all non-CI groups (including CF)
were similar. The similarity in fastest swim speed among non-CI groups suggests that the plasticity observed in the present study had little functional sig-nificance for swim speed and/or no costs associated with morphology change under our experimental con-ditions. Indeed, recent investigations suggest that the costs of plasticity are low or non-existent (Auld, Agra-wal & Relyea, 2009), although the apparent lack of costs in the present study may not hold under more realistic conditions.
For A. maculatum larvae, it may be that burst speed combined with manoeuverability is important for avoiding predators; thus, shape (the tail espe-cially) might be a better indicator than burst speed if the latter does not simulate predator avoidance well. In contrast to a previous study using larval anurans (Relyea, 2012), our GBH-induced morphology, specifi-cally increased tail size, is more consistent with the morphology induced by a gape limited predator of A. maculatum(Urban, 2010) and not the morphology induced by dragonfly larvae (Shaffery & Relyea, 2015), an ambush predator. This suggests the possi-bility that the morphological developmental path-ways activated (or inhibited) by GBH exposure are different for larval anurans and caudates. Because the typical escape response of this species is to turn away from the predator at the same time as acceler-ating, and deeper tail fins result in quicker bursts (Landberg & Azizi, 2010), the non-adaptive GBH-induced morphology that we observed might be advantageous in the presence of certain predators. More generally, under natural ecological conditions, the morphological changes that we observed may have considerable long-term fitness consequences.
CONCLUSIONS
We found that both salamander head and tail mor-phology were significantly affected by herbicide expo-sure, and there were no differences in our measure of swim speed among treatments. This suggests that our observations of herbicide-induced morphological changes had no apparent cost or disadvantages. However, under different conditions, these observa-tions may change and morphological variation could become more important. We did find evidence for a possible trade-off between growth and development. The largest individuals (as measured by tail size) had a morphology closely resembling the initial con-trol (i.e. larval) morphology and were the most distinct from the final control morphology. Determin-ing the patterns and consequences of plasticity devel-ops our understanding of how organisms interact with their environment and how these interactions shape their ecological and evolutionary trajectories. Figure 4. Treatment means and parametric 95%
confi-dence intervals for head size (A), tail size (B), and fastest swim speed (C). Colours match ellipsoid colour in Fig. 3. Sample sizes are shown at the bottom of all three plots. Letters above plots correspond to the results of pairwise tests and similar letters denote that the treatment means
are not significantly different (P>0.05). [Corrections
added on 01 March 2016, after first online publication: More details have been added in Figure 4 for clarity].
ACKNOWLEDGEMENTS
We thank A. Levis for assistance with animal care and rearing, as well as Antigoni Kaliontzopoulou and an anonymous reviewer for their comments that improved this manuscript. Animal collection was per-formed under the regulations of a Kentucky Educa-tional Collection Permit and animals were treated in accordance with institution animal care and use
com-mittee protocol designation (13–12). The authors
declare that they have no competing interests. NAL conceived and designed the study, performed the experiments with live animals, and drafted the manuscript. MLS acquired morphological data and participated in the statistical analysis. JRJ conceived and designed the study and critically revised the manuscript. MLC designed the study, oversaw data collection, analysis, and interpretation, and helped
revise the manuscript. All authors gave final
approval for publication. We thank the Western
Ken-tucky University Faculty-Undergraduate Student
Engagement (FUSE) program award, 14-FA141 (to MS and MLC), for financial support of this research.
REFERENCES
Adams DC, Otarola-Castillo E. 2013. Geomorph: an R package for the collection and analysis of geometric mor-phometric shape data.Methods in Ecology and Evolution4:
393–399.
Adams DC, Rohlf FJ, Slice DE. 2013.A field comes of age: geometric morphometrics in the 21st century.Hystrix24:7–14.
Auld JR, Agrawal AA, Relyea RA. 2009.Re-evaluating the costs and limits of adaptive phenotypic plasticity. Proceed-ings of the Royal Society of London Series B, Biological Sciences277:503–511.
Baylis AD. 2000. Why glyphosate is a global herbicide: strengths, weaknesses and prospects. Pest Management Science56:299–308.
Bernal MH, Solomon KR, Carrasquilla G. 2009.Toxicity of formulated glyphosate (Glyphos) and Cosmo-Flux to lar-val and juvenile Colombian frogs 2. field and laboratory microcosm acute toxicity.Journal of Toxicology and Envi-ronmental Health, Part A72:966–973.
Bookstein FL. 1991.Morphometric tools for landmark data: geometry and biology. Cambridge: Cambridge University Press.
Bookstein FL. 1997. Landmark methods for forms without landmarks: morphometrics of group differences in outline shape.Medical Image Analysis1:225–243.
Bookstein FL, Gunz P, Mitteroecker P, Prossinger H, Schaefer K, Seidler H. 2003.Cranial integration inHomo: singular warps analysis of the midsagittal plane in ontogeny and evolution.Journal of Human Evolution44:167–187.
Brausch JM, Beall B, Smith PN. 2007. Acute and sub-lethal toxicity of three POEA surfactant formulations to
Daphnia magna. Bulletin of Environmental Contamination and Toxicology78:510–514.
Brodman R, Newman WD, Laurie K, Osterfeld S, Lenzo N. 2010.Interaction of an aquatic herbicide and predatory salamander density on wetland communities. Journal of Herpetology44:69–82.
Burraco P, Duarte LJ, Gomez-Mestre I. 2013. Predator-induced physiological responses in tadpoles challenged with herbicide pollution.Current Zoology59:475–484.
Cauble K, Wagner RS. 2005.Sublethal effects of the herbi-cide glyphosate on amphibian metamorphosis and develop-ment. Bulletin of Environmental Contamination and Toxicology75:429–435.
Chen CY, Hathaway KM, Folt CL. 2004. Multiple stress effects of Visionâ herbicide, pH, and food on zooplankton and larval amphibian species from forest wetlands. Envi-ronmental Toxicology and Chemistry23:823–831.
Collyer ML, Sekora DJ, Adams DC. 2015. A method for analysis of phenotypic change for phenotypes described by high-dimensional data.Heredity115:357–365.
Dayton GH, Saenz D, Baum KA, Langerhans RB, DeWitt TJ. 2005. Body shape, burst speed and escape behavior of larval anurans.Oikos111:582–591.
Edginton AN, Sheridan PM, Stephenson GR, Thompson DG, Boermans HJ. 2004. Comparative effects of pH and Visionâherbicide on two life stages of four anuran amphib-ian species. Environmental Toxicology and Chemistry 23:
815–822.
Edwards WM, Triplett GB, Kramer RM. 1980.A water-shed study of glyphosate transport in runoff. Journal of Environmental Quality9:661–665.
Fort DJ, Degitz S, Tietge J, Touart LW. 2007. The hypothalamic-pituitary-thyroid (HPT) axis in frogs and its role in frog development and reproduction.Critical reviews in toxicology37:117–161.
Ghalambor CK, McKay JK, Carroll SP, Reznick DN. 2007. Adaptive versus non-adaptive phenotypic plasticity and the potential for contemporary adaptation in new envi-ronments.Functional Ecology21:394–407.
Ghalambor CK, Hoke KL, Ruell EW, Fischer EK, Reznick DN, Hughes KA. 2015. Non-adaptive plasticity potentiates rapid adaptive evolution of gene expression in nature.Nature525:372–375.
Giesy JP, Dobson S, Solomon KR. 2000.Ecotoxicological risk assessment for Roundup herbicide.Reviews of Environ-mental Contaminantion and Toxicology167:35–120.
Gilbert SF, Epel D 2009.Ecological developmental biology: integrating epigenetics, medicine, and evolution. Sunder-land, MA: Sinauer Associates.
Gunz P, Mitteroecker P. 2013.Semilandmarks: a method for quantifying curves and surfaces.Hystrix24:103–109.
Houlahan JE, Findlay CS, Schmidt BR, Meyer AH, Kuz-min SL. 2000.Quantitative evidence for global amphibian population declines.Nature404:752–755.
Howe CM, Berrill M, Pauli BD, Helbing CC, Werry K, Veldhoen N. 2004.Toxicity of glyphosate-based pesticides to four North American frog species.Environmental Toxi-cology and Chemistry23:1928–1938.
Jones DK, Hammond JI, Relyea RA. 2011. Competitive stress can make the herbicide Roundupâ more deadly to larval amphibians. Environmental Toxicology and Chem-istry30:446–454.
Landberg T, Azizi E. 2010.Ontogeny of escape swimming performance in the spotted salamander.Functional Ecology
24:576–587.
Levis NA, Johnson JR. 2015. Level of UV-B radiation influences the effects of glyphosate-based herbicide on the spotted salamander.Ecotoxicology24:1073–1086.
Mann RM, Bidwell JR. 2001.The acute toxicity of agricul-tural surfactants to the tadpoles of four Australian and two exotic frogs.Environmental Pollution114:195–205.
Moczek AP, Sultan S, Foster S, Ledon-Rettig C, Dwor- kin I, Nijhout HF, Abouheif E, Pfennig DW. 2011.The role of developmental plasticity in evolutionary innovation.
Proceedings of the Royal Society of London Series B, Biolog-ical Sciences278:2705–2713.
Morris MRJ, Rogers SM. 2013. Overcoming maladaptive plasticity through plastic compensation. Current Zoology
59:526–536.
Morris M, Rogers SM, Landry CR, Aubin-Horth N. 2014.
Integrating phenotypic plasticity within an ecological geno-mics framework: Recent insights from the genogeno-mics, evolu-tion, ecology, and fitness of plasticity. In: Landry CR, Aubin-Horth N, eds.Advances in Experimental Medicine and Biol-ogy. Ecological Genomics. Dordrecht: Springer, 73–105.
Ortiz-Santaliestra ME, Fernandez-Beneitez MJ, Lizana M, Marco A. 2011.Influence of a combination of agricul-tural chemicals on embryos of the endangered gold-striped salamander (Chioglossa lusitanica). Archives of Environ-mental Contamination and Toxicology60:672–680.
Paganelli A, Gnazzo V, Acosta H, Lopez SL, Carrasco AE. 2010.Glyphosate-based herbicides produce teratogenic effects on vertebrates by impairing retinoic acid signaling.
Chemical Research in Toxicology23:1586–1595.
Pfennig D. 1990. The adaptive significance of an environ-mentally-cued developmental switch in an anuran tadpole.
Oecologia85:101–107.
Pfennig DW, Wund MA, Snell-Rood EC, Cruickshank T, Schlichting CD, Moczek AP. 2010. Phenotypic plastic-ity’s impacts on diversification and speciation. Trends in Ecology & Evolution25:459–467.
R-Core-Team. 2015. R: A language and environment for sta-tistical computing, version 3.1.3. Vienna: R Foundation for Statistical Computing.
Relyea RA. 2001.Morphological and behavioral plasticity of larval anurans in response to different predators. Ecology
82:523–540.
Relyea RA. 2002.Competitor-induced plasticity in tadpoles: consequences, cues, and connections to predator-induced plasticity.Ecological Monographs72:523–540.
Relyea RA. 2012. New effects of Roundup on amphibians: predators reduce herbicide mortality; herbicides induce antipredator morphology.Ecological Applications 22: 634– 647.
Relyea RA, Jones DK. 2009.The toxicity of Roundup Origi-nal Max to 13 species of larval amphibians.Environmental Toxicology and Chemistry28:2004–2008.
Relyea RA, Schoeppner NM, Hoverman JT. 2005. Pesti-cides and amphibians: the importance of community con-text.Ecological Applications15:1125–1134.
Rohlf FJ. 2014.tpsDIG2, version 2.17.
Rohlf FJ, Corti M. 2000. Use of two-block partial least-squares to study covariation in shape. Systematic Biology
49:740–753.
Rohlf FJ, Slice D. 1990. Extensions of the Procrustes method for the optimal superimposition of landmarks. Sys-tematic Zoology39:40–59.
Shaffery HM, Relyea RA. 2015.Predator-induced defenses in five species of larvalAmbystoma.Copeia103:552–562.
Stuart SN, Chanson JS, Cox NA, Young BE, Ana SL, Fischman DL, Waller RW. 2004. Status and trends of amphibian declines and extinctions worldwide.Science306:
1783–1786.
Touchon JC, Warkentin KM. 2011. Thermally contingent plasticity: temperature alters expression of predator-induced colour and morphology in a Neotropical treefrog tadpole.Journal of Animal Ecology80:79–88.
Tsui MTK, Chu LM. 2003.Aquatic toxicity of glyphosate-based formulations: comparison between different organ-isms and the effects of environmental factors.Chemosphere
52:1189–1197.
Urban MC. 2010. Microgeographic adaptations of spotted salamander morphological defenses in response to a preda-ceous salamander and beetle.Oikos119:646–658.
USGS. 2012. Estimated agricultural use for glyphosate.
Pesticide National Synthesis Project. Available at: https:// water.usgs.gov/nawqa/pnsp/usage/maps/show_map.php?year= 2012&map=GLYPHOSATE&hilo=L&disp=Glyphosate
Van Buskirk J, McCollum SA. 2000. Influence of tail shape on tadpole swimming performance.Journal of Exper-imental Biology203:2149–2158.
Van Buskirk J, Relyea RA. 1998.Selection for phenotypic plasticity inRana sylvaticatadpoles. Biological Journal of the Linnean Society65:301–328.
West-Eberhard MJ 2003.Developmental plasticity and evo-lution. Oxford: Oxford University Press.
Whitman DW, Agrawal AA. 2009.What is phenotypic plas-ticity and why is it important? In: Whitman DW, Ananthakr-ishnan TN, eds.Phenotypic plasticity of insects: mechanisms and consequences. Boca Raton, FL: CRC Press, 1–63.
Wilson RS, Kraft PG, Van Damme R. 2005. Predator-spe-cific changes in the morphology and swimming performance of larvalRana lessonae.Functional Ecology19:238–244.
Wojtaszek BF, Staznik B, Chartrand DT, Stephenson GR, Thompson DG. 2004. Effects of Vision herbicide on mortality, avoidance response, and growth of amphibian larvae in two forest wetlands. Environmental Toxicology and Chemistry23:832–842.
Wund MA. 2012.Assessing the impacts of phenotypic plasticity on evolution.Integrative and Comparative Biology52:5–15.
SUPPORTING INFORMATION
Additional Supporting Information may be found online in the supporting information tab for this article:
Table S1.Summary statistics for likelihood ratio tests for family effects.
Table S2.Analysis of variance statistics for a test of homogeneity of slopes between log(CS) and treatment.