A STUDY ON MANDARIN FOCUS PRODUCED BY ENGLISH L2 LEARNERS
Siyun Zhu
A thesis submitted to the faculty at the University of North Carolina at Chapel Hill in partial fulfillment of the requirements for the degree of Master of Arts
in the Department of Linguistics.
Chapel Hill 2014
Approved by: Elliott Moreton Jennifer L. Smith
©2014 Siyun Zhu
ABSTRACT
Siyun Zhu: A Study on Mandarin Focus Produced by English L2 Learners (Under the direction of Elliott Moreton)
This thesis investigates how Mandarin focus intonation is realized in the production of English L2 learners by examining relevant measurements of its acoustic carrier, fundamental frequency (f0), and comparing the observed results with those of the native speakers. The
ACKNOWLEDGEMENTS
First of all, I’d like to thank my thesis advisor, Elliott Moreton, who encouraged me when I had doubt on my ability, inspired me when I faced difficulties and supported me whenever I was in need. He taught me how to think, learn and solve problems independently. Words cannot describe how grateful I am for having him as my advisor throughout the past year.
Advice and support from the other two committee members, Dr. Jennifer Smith and Dr. David Mora Marin are invaluable as well. Their detailed comments are extremely insightful. I’d also like to thank Chris Wiesen for his statistic support of the thesis. His expertise and patience verifies and standardizes the critical analysis and results of this study.
I’m grateful to have all the members in the department, especially the weekly p-side, for their kind feedback and abundant encouragement.
TABLE OF CONTENTS
LIST OF TABLES ... viii
LIST OF FIGURES ... ix
CHAPTER 1 INTRODUCTION ... 1
1.1 Problem and hypothesis ... 1
1.2 Lexical tones ... 4
1.2.1 Lexical tones in Mandarin Chinese... 4
1.2.2 Second language acquisition of Mandarin lexical tones ... 6
1.3 Focus ... 7
1.3.1 Focus ... 7
1.3.2 Focus in English ... 9
1.3.3 Focus in Mandarin ... 10
1.3.4 Second language acquisition of focus in Mandarin ... 11
1.4 Studies of Xu... 12
1.4.1 Xu (2005) on English focus ... 12
1.4.2 Xu (1999) on Mandarin focus and lexical tone ... 13
1.5 Summary and overview ... 13
2.2 Materials ... 15
2.3 Recording ... 17
2.4 Measurements ... 18
CHAPTER 3 RESULTS ... 20
3.1 Realization of Focus ... 20
3.1.1 F0 ... 21
3.1.2 Pitch Range ... 27
3.1.3 Duration ... 28
3.1.4 Summary ... 29
3.2 Realization of lexical tones ... 29
3.2.1 F0 ... 31
3.2.2 Slope ... 37
3.2.3 Summary ... 38
3.3 Comparison between L2 subjects and native speakers ... 38
3.3.1 L2 vs Native: Realization of focus ... 39
3.3.2 L2 vs Native: Realization of focus over four lexical tones ... 43
3.3.3 L2 vs Native: Realization of lexical tones ... 48
3.3.4 Summary ... 54
3.4 Comparison between subjects ... 55
3.4.1 Individual subject vs. Native speaker: Realization of focus ... 55
3.4.2 Individual subject vs. Native speaker: Slope ... 58
3.5 Summary ... 62
4.1 Answers to research questions ... 64
4.1.1 Research question 1 ... 64
4.1.2 Research question 2 ... 65
4.1.3 Research question 3 ... 71
4.2 The nature of English focus ... 73
4.3 Pedagogical implication on L2 instruction ... 74
CHAPTER 5 CONCLUSIONS AND FUTURE DIRECTIONS ... 76
5.1 Overall conclusions ... 76
5.2 Limitations of the current study and directions for future study ... 77
LIST OF TABLES
Table 1. Lexical tones of Mandarin Chinese in various representations ………5
Table 2-1. Words with varying lexical tones used as recording materials ………...……15
Table 2-2. Example of precursor questions ………..16
Table 3-1. Realization of Focus ………25
Table 3-2. Pitch ranges in different focus conditions ………...27
Table 3-3. Durations in different focus conditions ………...28
Table 3-4. Realization of lexical tones reflected in maximum and minimum f0 of each syllable34 Table 3-5. Slope of lexical tones in four focus conditions ………...38
Table 3-6. L2 vs Native: Realization of focus and lexical tones ………..54
LIST OF FIGURES
Figure 1. An example of segmentation of the second and third nucleus in Praat ……….19
Figure 2. Realization of focus produced by L2 shown in f0 curves ……….22
Figure 3. Realization of lexical tones of word 1 (the second syllable) ……….31
Figure 4. Realization of lexical tones of word 2 (the third syllable) ………32
Figure 5. L2 versus native speakers: Extent of variation in duration under various focus conditions ………..40
Figure 6. L2 versus native speakers: Extent of variation in pitch range under various focus conditions ………..41
Figure 7. L2 versus native speakers: Extent of variation in maximum f0 value under various focus conditions ………42
Figure 8. L2 versus native speakers: Extent of variation in minimum f0 value between various focus conditions ………42
Figure 9. L2 versus native speakers: Extent of variation in maximum and minimum f0 values under focus condition compared to neutral condition ………..43
Figure 10. L2 versus native speakers: Extent of variation in maximum and minimum f0 values under pre-focus condition compared to neutral condition ………45
Figure 11. L2 versus native speakers: Extent of variation in maximum and minimum f0 values under post-focus condition compared to neutral condition ………...45
Figure 12. Difference in the extent of variation between native speakers and L2 ………47
Figure 13. L2 vs Native: F0 curves of the second syllable in the neutral condition ……….49
Figure 15. L2 vs Native: Mean f0-max and f0-min of four lexical tones in neutral condition ….52 Figure 16. L2 vs Native: Mean f0-max and f0-min of four lexical tones under focus ………….53 Figure 17. L2 vs Native: Mean f0-max and f0-min of four lexical tones in pre-focus condition .53 Figure 18. L2 vs Native: Mean f0-max and f0-min of four lexical tones in post-focus condition54 Figure 19. Comparison between subjects: Variation in duration under varying focus condition..57 Figure 20. Comparison between subjects: Variation in pitch range under varying focus
CHAPTER 1
INTRODUCTION
1.1 Problem and hypothesis
Focus intonation is a communicative function used to emphasize semantic prominence of a sentence (Ladd, 1980; Xu, 2005; etc.). It is acoustically manifested through variations of
fundamental frequency (f0) (Johnson, 2012). Since f0 carries not only focus, but also lexical tones, it has been an interesting topic to explore how focus and lexical tones are realized simultaneously in tonal languages such as Mandarin Chinese (MC). Numerous theoretical models (Chao, 1968; Garding, 1987; Xu, 2001; etc.) have been proposed from various
perspectives with different specific predictions. Two general consensuses they have reached are: expansion of pitch range and increase of duration mainly characterize the effect of focus; the identity of the lexical tone under focus should be preserved.
As interest in Mandarin intonation, such as focus, has grown rapidly in recent years, few studies have shed light on the second language (L2) acquisition of the intonation of MC.
Inevitably, this study includes examination of lexical tones produced by the L2 learners. On the one hand, as mentioned earlier, lexical tones of MC are supposed to closely interplay with focus intonation: they manipulate f0 movement simultaneously. Therefore, a comprehensive analysis of focus needs to take a look at realization of lexical tones. Specifically, it is crucial to check whether tone identities are preserved under the influence of focus. On the other hand, given the fact that lexical tones of MC have been a big challenge (Ke, 2012; Zhang, 2013) to the English L2 learners of MC, who come from a non-tonal L1 background, examination on
realization of four lexical tones under the influence of focus might shed light on L2 acquisition of lexical tones.
After describing how focus is realized in L2 production, together with lexical tones, this study compares the current result with that of the native speakers collected by Xu (Xu, 1999), which explicitly shows how the production of L2 learners deviates from the production of the native speakers. Therefore, the study not only shows how the L2 learners produced focus, more importantly, it shows whether they were doing it right. The observed deviations from the native speakers reveal challenges in learning prosody of MC for L2 learners.
therefore, is to serve as a possible solution to the controversy based on performance of the English L2 learners of MC: If any typical English pitch accent in the focus condition could be found in the interlanguage, which is clearly a sign of L1 transfer of English prosody, then Xu’s conclusion is wrong. Because based on his idea, English L2 learners of Mandarin should produce focus just as the native speakers do without any negative transfer effect.
In sum, the purpose of this thesis is twofold: By looking at the interlanguage of English L2 learners when producing Mandarin focus, one could: (1) find out how English L2 learners of MC realize Mandarin focus; (2) to reveal whether the nature of English focus is a pitch accent or not. The first is a standard comparative analysis between L2 and the target language (Mandarin Chinese). The second is an innovative analytic method that using interlanguage data to examine properties of L1 (English) of the L2 speakers.
In order to find out the answers, specific research questions are raised as follows:
1) Will the English L2 learners of Mandarin be able to produce focus (not necessarily native-like) under the influence of lexical tones? How will they do that?
2) How might the production of the L2 learners deviate from that of native speakers? Are the deviations due to different ways of realizing focus?
3) How will each lexical tone be realized with the effect of focus? Will different lexical tones bring different levels of difficulty to the L2 learners in the production of focus?
The respective hypotheses are:
focus. More specifically, they will substitute lexical tones of MC with a pitch accent, which is transferred from intonation of L1. Secondly, their production of lexical tones in the neutral condition may not be perfectly native-like.
3) Most substitution errors will be found in the High and Rising tones, because they both end in a high pitch level, unlike the final low pitch level of a pitch accent. The Falling tone is the easiest to produce under focus, because it is similar to the pitch accent in terms of f0 contour. The Low tone, with a low dipping contour, brings a certain difficulty but less than the High and Rising tones.
The main findings of this thesis are: on average, the L2 subjects managed to realize focus without a pitch accent substitution over lexical tones. However, one particular subject failed to preserve tone identities by producing a pitch accent under focus, which proves Xu is wrong in terms of the nature of English focus intonation. Excluding the substitution error found in this one subject, based on averaged results, the pitch range, f0-max and f0-min in the production of the L2 learners varied in a much less extent compared to those of the native speakers between varying focus conditions. The L2 learners had most difficulty in producing the L tone, which is almost the same as the R tone in their production regardless of the focus condition.
1.2 Lexical tones
1.2.1 Lexical tones in Mandarin Chinese
Mandarin Chinese is a tonal language. Four lexical tones are employed to distinguish
in unstressed syllables and bears no pitch contour, is not discussed in this thesis and avoided in the experiment design. The acoustic carrier of lexical tones is f0.
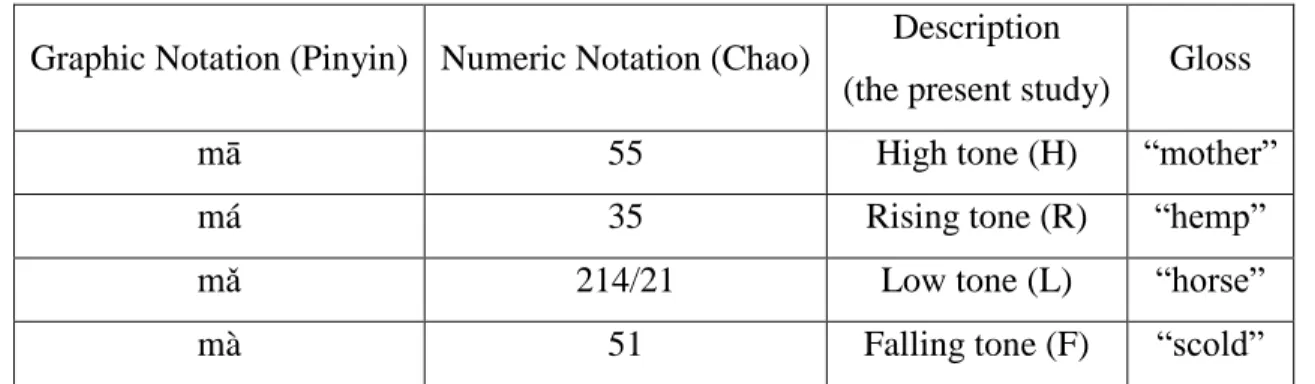
Multiple systems of tonal representation of MC have been developed and adopted for various purposes. Some of them graphically display patterns of pitch contour, focusing on the movement of the tones; some others employ numerals to indicate the height of the tones. “This practice implies that tone consists of two independent orthogonal dimensions: register and pitch contour” (Chen, 2000). Tone diacritics of Pinyin, which are officially used in Mainland China and commonly employed in textbooks of second language acquisition (SLA) of MC, belong to the first category, as shown in the leftmost column of Table 1-1. A numeric system created by Chao (1930, 1968), has been widely used in Chinese linguistic study, where a scale of 1-5 represents the relevant pitch levels of a speaker, with 1 as the lowest and 5 the highest. In this thesis, the lexical tones are descriptively represented as the High, Rising, Low and Falling tones (abbreviated as the H, R, L and F tones), following the practice of Xu for ease of comparison.
Table 1. Lexical tones of Mandarin Chinese in various representations
Graphic Notation (Pinyin) Numeric Notation (Chao) Description
(the present study) Gloss
mā 55 High tone (H) “mother”
má 35 Rising tone (R) “hemp”
mǎ 214/21 Low tone (L) “horse”
mà 51 Falling tone (F) “scold”
and then rises to a mid-high range, resulting in a “dipping” shape (In fact, the final raising is only produced in stressed, isolated and phrase-final positions. In most cases, the L tone is realized as a low tone, “21”); the F tone starts from the top and drastically declines to the bottom of the pitch range. Among the four lexical tones, the H, R and F tones start from a higher pitch range, hence in tonal categorization models that feature tone registers, they are characterized with a [+upper] feature (Yip 1980, 2001). As far as the target of the tonal movement, the H and R tones reach to a high pitch level, whereas the targets of the L and F tones are both relatively low.
Tone sandhi is an intensely discussed aspect of Mandarin tonal phonology (Chao, 1968; Chen, 2000; Wang, 2006; Zhang, 2103, among others). The experiment of this thesis was designed to exclude the effect of tone sandhi, in order to focus on the realization of focus intonation and simplify interactions between lexical tones themselves. Thus, detailed introduction of tone sandhi is omitted here.
1.2.2 Second language acquisition of Mandarin lexical tones
Studies have shown that the acquisition of MC lexical tones brings comparatively more challenge to the English L2 learners, who come from a non-tonal L1 background, than the segmental inventories (Miracle, 1989, Wang 2006, among others).
Previous studies mostly rely on tonal production or perception errors of L2 learners, mostly adults. As summarized by Sun (1998), some recurring themes include “(1) the establishment of an acquisition order among the four lexical tones; (2) the effect of a speaker’s pitch range on tone production; (3) the transfer of English suprasegmental features in tone perception and production; (4) the difference between native and non-native speakers of Mandarin in their
and (6) the ultimate phonological attainment by adult learners of tonal languages” (Sun, 1998, p. 6-17). This thesis is closely related to subject (3) but will shed light on subject (1) and (4) as well, so the results should be of theoretical and practical interest for the SLA studies of tones in MC. Though differing in experiment design and subject selection, these studies have reached some similar findings, such as: (1) learners have most difficulty contrasting the R and L tones in the production for their intrinsic phonetic similarities (Elliot, 1991; Miracle, 1989; Sun, 1998; Jin, 1996; etc.) (2) “the similar and different uses of pitch in English and Mandarin have been posited as a source of transfer in language learners” (Sun, 1998, p.12), and the transfer might be negative as well as positive. (3) The position where the lexical tone occurs is considered a crucial variable in the perception and production of MC lexical tones (Miracle, 1989; Lu, 1992; Sun, 1998, among others). (4) Universal phonological constraints, together with L1 transfer,
significantly affect the production of L2 learners in terms of lexical tones, as proposed in Zhang (2013).
1.3 Focus
1.3.1 Focus
Though a strict and unified definition of focus hasn’t been well established in the literature,
generally speaking, focus refers to a special emphasis or prominence given to a certain
constituent of a sentence, and it is usually determined by pragmatic or discourse contexts instead of requirement of the grammar. The focused parts normally provide new, special or contrastive information (Bolinger, 1958, etc), as illustrated in the conversation below:
In this case, the speaker of sentence (b) intends to contrast “mango” with other possible alternatives to the constituent, such as “apple” or “watermelon”. The focus is thus placed on the word “mango”, which carries information not shared by speaker (a). On the contrary, the rest of the sentence, sometimes referred as “presupposition” (Jackendoff, 1972), are shared by both the speaker and the hearer with no necessity to emphasize.
The focus described above is placed on an individual word “mango”, thus considered a “narrow focus”, contrasting with a notion of “broad focus”, which is firstly proposed by Ladd (1980). “Broad focus” is the focus on whole constituents or sentences instead of individual words. Broad focus normally occurs when the speaker believes that the whole constituent or sentence is new information to the hearer. This thesis only discusses narrow focus, thus the term “focus” only refers to narrow focus without further clarification.
Focus differs from stress. The former is on a sentence or post-lexical level, determined by pragmatic contexts, whereas the latter “belongs to the phonological component of the grammar and is responsible for the manifestation of focus” (Jin, 1996). Because of the existence of broad focus and phenomena like “contextual deaccenting” (Ladd, 1980), focus and stress do not have a straightforward one-to-one relationship, where the focused constituent is stressed and the
stressed component is the focus of the sentence. This idea has been proved by studies of Halliday (1967), Chomsky (1970), Schmerling (1976), Ladd (1980), etc.
1.3.2 Focus in English
Besides Xu (2005), previous studies have reached a general consensus on the realization of focus in English: “presence of pitch accents on focused constituents and absence of pitch accents on post-focal constituents”, as summarized in Chen & Gussenhoven (2008).
Pitch accent, first introduced by Bolinger (1958), is defined as “a local feature of pitch contour – usually but not invariably a pitch change and often involving a local maximum and minimum – which signals that the syllable with which it is associated is prominent in the utterance” (Ladd, 1996). In the British nuclear tone tradition, or the IPO model, the focus is mainly characterized as a High Fall nucleus, with a following nuclear tail and a preceding head (Cruttenden, 1997; O’Connor & Arnold, 1961). Based on the framework of the Autosegmental-Metrical (AM) theory, the focus of a declarative sentence in English contains H* (or L+H*) pitch accent followed by a L- phrase accent and an L% boundary tone, as summarized in Xu (2005). As mentioned before, Xu (2005) reevaluated and disagreed with the prevailing view of seeing English focus as a pitch accent. He believes that the British nucleus tradition and the AM theory characterize focus of English primarily in form, rather than an intonational function, which he proposes is the nature of English focus and is fundamentally the same as focus of MC. A brief summary of his argument will be given in section 1.4.1.
1.3.3 Focus in Mandarin
Since the acoustic manifestation of focus is the manipulation of f0, which in Mandarin also carries the contrast between four lexical tones, the surface f0 curve is not able to show
implementation of focus directly in MC. Therefore, the realization of focus in MC is always explored by investigating its interaction with lexical tones.
One of the pioneer studies on the interaction between intonation (including focus) and lexical tones is by Chao (1968). He describes the relationship between MC lexical tones and intonations as “small ripples riding on big waves”: If the lexical tone contours glide in the same pitch direction as the global intonation, they would be intensified. On the contrary, when the directions differ, the two counteract with each other.
A well-known “Range Grid” model proposed by Garding (1987) is considered the first to formalize variation of pitch range during the realization of lexical tones under varying
intonational contexts. In this model, focus is realized as expansion and compression of the grid, which affects the pitch range of the lexical tones. The notion of variation of pitch range
introduced by focus has been widely adopted in following studies, including this thesis.
Besides expansion of pitch range under focus, several studies discovered the abrupt fall of pitch value in the syllable immediately following the focused word (Liao, 1994; Tseng, 1981; Garding, 1987; Xu, 1999; among others).
Some other acoustic parameters, such as duration and intensity, have been examined as well. The duration of the syllable under focus is significantly increased (Shih, 1988; Liao, 1994; Shen, 1992; Jin, 1996; Xu, 1999; among others), however, it has been found that “intensity is not a reliable cue for stress” in MC (Jin, 1996; among others).
One crucial fact about the interaction between focus intonation and lexical tones in MC is that the identities of the four lexical tones are preserved (Ladd, 1996; Flemming, 2008; Zhang, 2013): “a focus neither replaces the tone directly under it, nor eliminates the tones after it” (Xu, 2005).
1.3.4 Second language acquisition of focus in Mandarin
Compared to SLA studies regarding segmental inventories, lexical tones and tone sandhi rules of MC, the amount of SLA studies on the perception and production of L2 intonation is extremely small, not to mention those specifically designed for the acquisition of focus. This situation is aligned with lack of intonation or prosody instruction in language classes of MC. In fact, studies on perception and production of L2 intonation in general, not just about MC, are far from enough. According to a survey, only 9 studies were found to investigate intonation in all the journals of SLA study of past 25 years (Mennen, 2006).
of English, Japanese and Korean on the L2 production of sentence-level prominence (narrow focus), and demonstrated a significant effect from universal phonological constraints as well. Her study differs from the current one mainly in that Zhang focused on acquisition of lexical tones, therefore focus is only introduced to induce error patterns in L2 production of lexical tones. However, some of her observations proved to be extremely helpful in analyzing and explaining results of the current study.
1.4 Studies of Xu
1.4.1 Xu (2005) on English focus
Xu studied phonetic realization of English focus in short declarative sentences by conducting detailed measurement over the f0 curves under various focus conditions (without focus or focus placed in different positions). He argues that focus in English should be seen as a function that manipulates the pitch range of the f0 curve, instead of a form, like a High-Fall nucleus tone, or a H* pitch accent, that is “anchored” onto the f0 curve regardless of the local f0 shape in the neutral condition. He disagrees that the nucleus pitch accent will be the only
intonational component once placed onto a word or syllable. The crucial evidence he found to support the idea is there is “local f0 movement largely independent of focus” and focus has a “three-zone pitch range manipulation” pattern that is independent of other factors as well. The so-called “local f0 movement” is mainly characterized by the position of the f0 peak, which Xu believes is not determined by focus.
of realizing Mandarin focus intonation. This prediction largely inspired the current study.
1.4.2 Xu (1999) on Mandarin focus and lexical tone
Xu (1999) conducted a detailed analysis over the effects of tone and focus on the formation
and alignment of F0 contour based on native production of Mandarin. His main conclusion is that “lexical tones and focus are implemented in parallel. More specifically, tone identities are implemented as local F0 contours while focus patterns are implemented as pitch range variations imposed on different regions of an utterance” (Xu, 1999).
The experiment design, methodology and main results of this study serve as reference for this thesis, which is required by a comparative analysis between the production of L2 and native speakers.
1.5 Summary and overview
CHAPTER 2
METHODOLOGY
This study not only aims to do descriptive analysis over production of L2 speakers, but also focuses on comparative analysis between current L2 data and data of native speakers from Xu (Xu, 1999). For the purpose of that, experiment design of the present study is largely inspired by and intentionally follows the study of Xu (1999) on native speakers. The biggest change is made over recording materials: only two instead of three syllables carry varying focus
conditions, considering the feasibility of the study and the fact that the change will not affect experiment results significantly given the purpose of the present study.
This chapter introduces details of subjects, materials, recording procedures, measurements of the study.
2.1 Subjects
Eight native speakers of American English, four males and four females, aged between 18 to 21, participated in this study. All of the subjects speak American English as their first
language and are monolingual.
They have been studying Chinese for no less than 2 years and have learned lexical tones of Mandarin since the beginning of their study of the language. The language course they were taking (CHIN 201 or 204) is considered intermediate level, and the primary textbook they were using is Integrated Chinese (Level 2 Part 1) by T. Yao et al (2005).
All subjects participated in the experiment voluntarily.
2.2 Materials
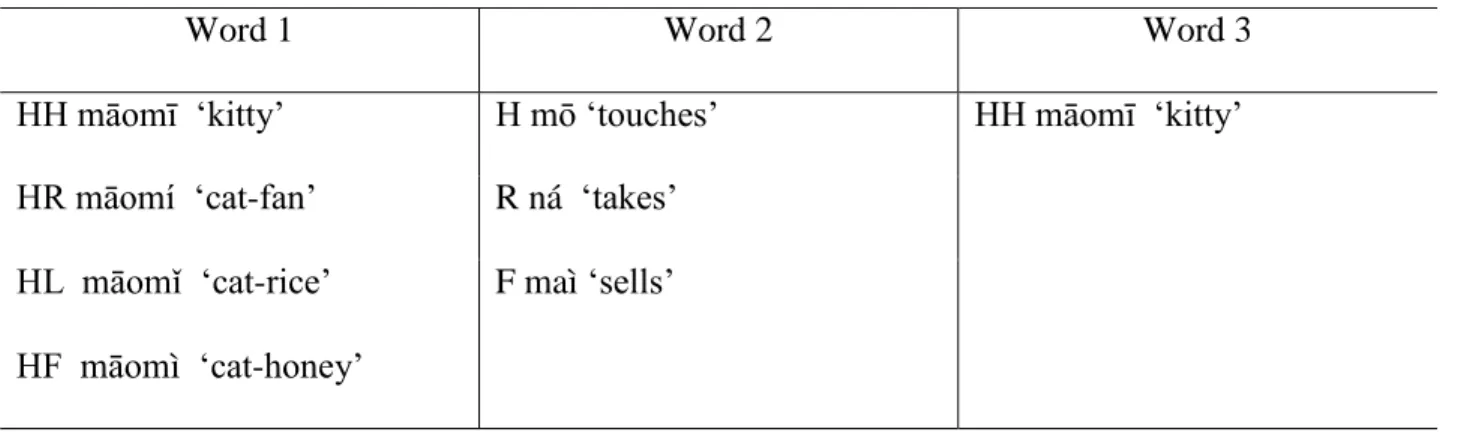
Sentences used in the experiment are composed of three words. The first word “mao mi” is disyllabic: “mao” with H tone is used as the first syllable consistently, and “mi” with four alternating lexical tones: H, R, L and F, is the second syllable. Some combinations are nonsense words created solely for the purpose of the study. The second word is monosyllabic, alternating between “mo” (H tone), “na” (R tone) and “mai” (F tone). The third word, “mao mi” is disyllabic and both syllables are produced with H tone consistently. Therefore, only the lexical tones of the second and third syllables alternate, and are under direct examination for the study. Table I below shows all the words in Pinyin with English translations used in the study. In total, 4 × 3 = 12 sentences with all possible combinations of syllables are produced by each subject.
Table 2-1. Words with varying lexical tones used as recording materials
Word 1 Word 2 Word 3
HH māomī ‘kitty’ H mō ‘touches’ HH māomī ‘kitty’ HR māomí ‘cat-fan’ R ná ‘takes’
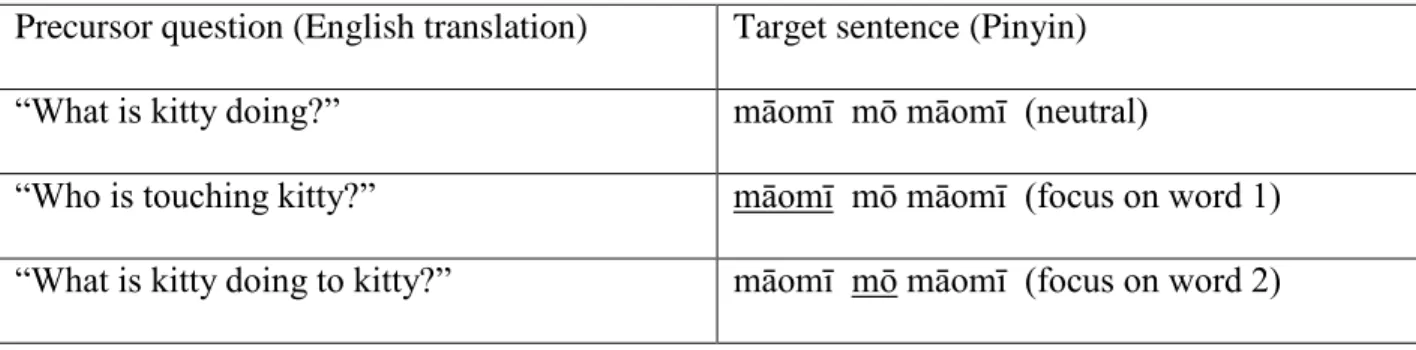
In order to study the realization of focus, these 12 sentences with different focus conditions are elicited using precursor questions asked by the researcher, as well as hints in reading
materials for the subjects. The critical focus conditions include: (1) neutral, which means no focus is placed on any word, (2) focus on word 1 (the second syllable), and (3) focus on word 2 (the third syllable). For each sentence, different precursor questions are used to elicit target sentences with particular focus conditions. Table 2-2 lists precursor questions in English
translations for the sentence “mao (H) mi (H) mo (H) mao (H) mi (H)”. All together, 12 × 3 = 36 individual sentences with different combinations of lexical tones and focus conditions are
produced by each subject.
Table 2-1. Examples of precursor questions
Precursor question (English translation) Target sentence (Pinyin) “What is kitty doing?” māomī mō māomī (neutral)
“Who is touching kitty?” māomī mō māomī (focus on word 1) “What is kitty doing to kitty?” māomī mō māomī (focus on word 2)
Each sentence will be repeated five times randomly by each subject, therefore, the number of sentences recorded for this study is 36 × 8 × 5 = 1440.
During the experiment, the subjects will see each target sentence present in Pinyin on a digital tablet individually and randomly. The lexical tones are shown in numeric number
word under focus is underlined and present in the red color. A sample sentence is given below to illustrate what subjects would see during the experiment:
103. mao1 mi4 na2 mao1mi1
In Xu (1999), the third word alternates between “mao (H) mi (H)” and “ma (L) dao (H)”, and additional focus condition is placed on the third word. This is the only difference between this study and his in terms of the recording materials. This change significantly reduces the amount of data and still makes it possible to examine the interaction between focus and lexical tones. For the ease of direct comparison, the number of subjects, the choice of words, the precursor questions and the number of repeats, all follow Xu (1999).
2.3 Recording
The recording was conducted in the soundproof phonetic lab located in Room 103 of Dey Hall at the University of North Carolina at Chapel Hill.
The recording was made after the subjects were familiar with the sample sentences and feeling comfortable producing focus according to the precursor questions and hints.
During the recording, a microphone-headset and a MacBook Air laptop with Version 10.9.3 of OS X were used, along with Praat of Version 5.3.63 in all default settings. The subject clicked the screen of an iPad 3 to view each individual sentence, and read it after the researcher asked the precursor question in Mandarin.
After the recording, the subjects received ten dollars as compensation.
2.4 Measurements
Critical measurements for the study include duration, pitch range, f0-max and f0-min of the second and third syllables. For the ease of visual inspection and comparison, time-normalized f0 curves are created as well.
Praat of Version 5.3.63 along with ProsodyPro (Xu, 2013), a Praat script written by Xu were used to segment the second and third syllables, and then generate duration, f0-max, f0-min and time-normalized f0 values, etc. for individual subject and across all subjects.
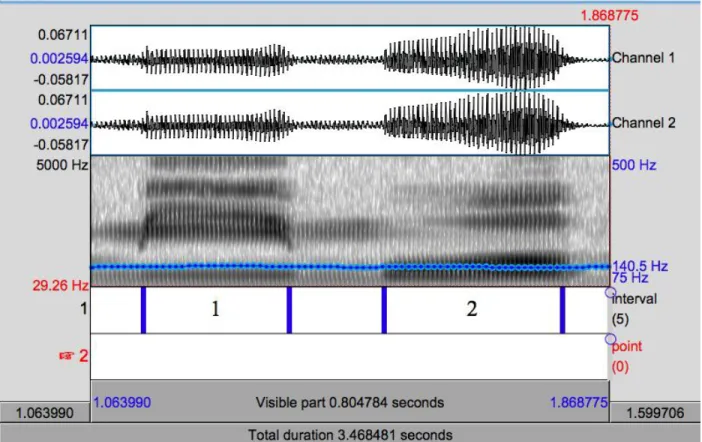
After running ProsodyPro in Praat, a window pops up and displays the waveform and spectrogram of the current sound together with optional pitch track and formant tracks in the spectrogram panel. Then the syllables were labeled according to both the waveforms and spectrograms. The syllables were considered to begin where the amplitude expanded
significantly and abruptly and end where it contracted. The boundaries are rather clear according to the spectrograms as well: the formants darken significantly within the nucleus. Figure 1 below demonstrates how the nucleus of the syllables were segmented and labeled in Praat.
Figure 1. An example of segmentation of the second and third nucleus in Praat
After individual segmentation of each sound file was done, ProsodyPro was run again and by checking “Process all sounds without pause” and setting the repetition number as “5”, it automatically generated a series of measurements averaged across all repetitions for each identical sentence, including mean f0-max, mean f0-min, mean duration, mean normalized f0, etc. After measurements for each subject were collected, by running the script again with all relevant files place together in a fold, the measurements across all subjects were automatically generated.
CHAPTER 3
RESULTS
This chapter presents the result of the experiment: how the subjects realized focus and lexical tones in their production. In section 3.1, with lexical tones being the controlled factor, realization of focus is reflected in differences in f0, pitch range, and duration when focus and non-focus contexts are compared. In section 3.2, in order to find out how the lexical tones were realized under each focus condition, focus conditions are held consistent and the f0 and slopes of the four lexical tones are examined. Both sections utilize graphic display of f0 curves for direct visual inspection, and then statistic analysis is adopted for further examination and verification. Then, comparative results are shown in section 3.3 and 3.4. Section 3.3 gives comparison on mean results between English L2 subjects of the current study and the native speakers of Xu’s study (Xu, 1999), showing how production of the L2 subjects deviated from that of the natives. After that, section 3.4 compares crucial measurements such as pitch range, f0-max and f0-min between individual subject and the native speakers, aiming to check if there’s any idiosyncratic behavior significantly deviant from the mean values.
3.1 Realization of Focus
This section aims to answer the first research question: Are the English L2 subjects able to
Since English is not a tonal language and it has been proved that lexical tones are extremely challenging to English L2 learners of Mandarin (Miracle, 1989, Wang 2006, among others), it is likely that under the pressure of producing accurate lexical tones of MC, the subjects might fail to make any significant adjustment in their production to suggest focus intonation or different positions of the focus. It should be noted that their production doesn’t have to be correct, or native-like, in terms of focus realization. Any consistent pattern that significantly differs variant focus conditions from the neutral condition should be considered a sign of successful focus realization. Measurements that are most likely to reflect focus realization include maximum f0 value (f0-max), minimum f0 value (f0-min), pitch range and duration, because English focus involves adjustment over these measurements, as well as Mandarin focus.
3.1.1 F0
3.1.1.1 F0: visual observation over f0 curves
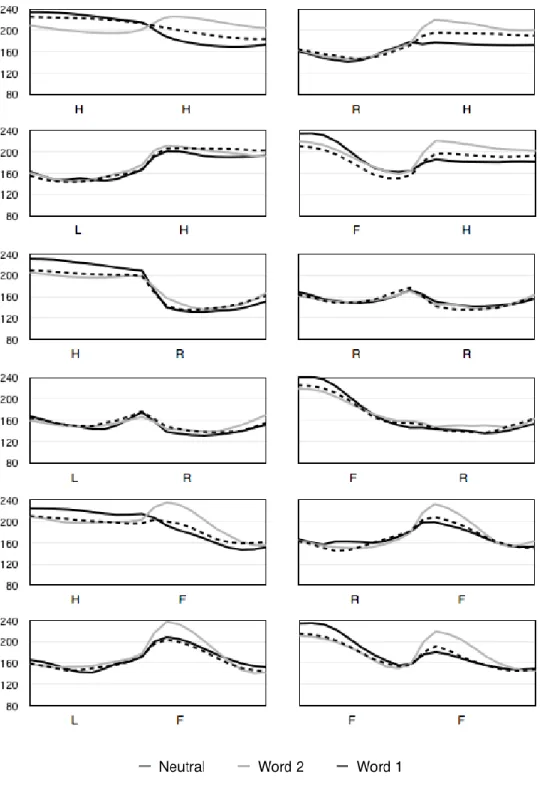
Focus, as an intonation type, is manifested in f0 contour. Visual observation over f0 curves provides a preliminary answer to the question of focus realization. For each identical sentence, there should be three f0 curves, each corresponding to a distinct focus condition: focus on word 1, focus on word 2, and neutral (no focus). If the f0 curves with focus, either on the first or second word, do not overlap with the one in the neutral condition, then it suggests that focus is somehow realized.
column and row. For example, panel C2R4 means the one on the second column and the fourth row.
The realization of focus can be most obviously seen in C1R1, where both syllables (as well as others that are not shown) bear the same lexical tone, the H tone, therefore the least
interference from lexical tones is introduced. As can be seen in this particular panel, the three curves did not overlap: When focus is placed on the first word, f0 of the focused syllable is raised a bit and that of the post-focus syllable is lowered a lot. When focus is placed on the second word, f0 of the pre-focus syllable is somewhat lowered, while that of the focused syllable is substantially raised. It is clearly shown in this panel that the subjects managed to produce focus of Mandarin by adjusting the height and shape of f0 contour when lexical tones are least introduced in their speech and the pattern seems to be raising the f0 value of the focused syllable. After checking on all 12 panels, it can be seen that focus is realized in most sentences (C2R3 and C1R4 are exceptions where all three curves almost overlapped). Based on visual inspection, some general patterns can be concluded: Compared to the neutral condition, (1) the f0 peaks are more or less raised when the syllable is under focus; (2) the height of the f0 curves right after focus is lowered in most cases, although the lowering is not very substantial (the solid black line over word 2 are mostly below the dotted lines, except in C2R3 and C1R6); (3) The height and shape of f0 curves before focus are barely changed in most panels (the grey lines over word 1 overlap with the dotted lines, except in C1R1, C2R2).
observed over syllables bearing the H and F tones. Thus, it seems that focus is easier to realize when a syllable carries the H or F tone.
Another observation is that the f0 curves are more likely to overlap with each other in the first syllable shown in the panel regardless of the lexical tone and the focus condition. It is possible that focus on word 2 is easier to produce than on word 1. Another possibility is that the focus was being realized on the first syllable of word 1 and so is simply not measured here. Overall, based on visual observation of f0 curves in Figure 2, there is no doubt that the English L2 subjects realized focus of MC in their production.
3.1.1.2 F0: statistic analysis
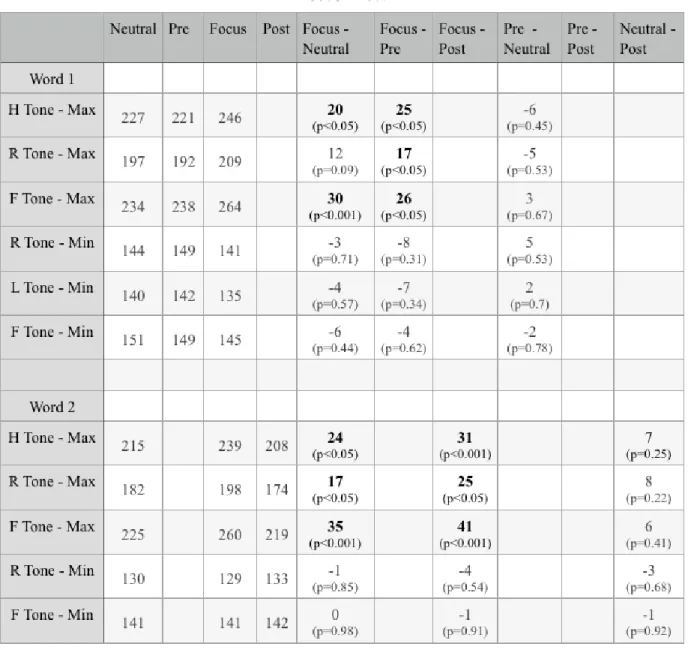
In order to verify and further analyze the patterns observed earlier, maximum and minimum f0 values of word 1 and word 2 in three different focus conditions were measured. In Table 3-1, the left four columns show mean maximum and minimum f0 values of tones in word 1 and word 2 as indicated in the headings of the rows. Differences in mean f0 values between different focus conditions are displayed in the right six columns, which are calculated the way suggested by the headings of the columns.
The purpose of Table 3-1 is to show whether focus significantly affects the f0 curves, including raising and lowering the curves in different focus conditions as observed in the panels of Figure 2. In order to prove statistic significance, two-tailed paired t-test with a probability level of 0.05 is adopted. In Table 3-1, if the probability value is less than 0.05, which suggests that the difference is significant, the number of that difference is marked in bold.
As can be seen in the table, all the maximum f0 values are higher when the word is
the R tone is not statistically significant. The mean difference ranges from 12 to 35 Hz. This verifies the pattern of raising f0 curve under focus observed before.
In contrast to overall substantial adjustment over mean maximum f0 value, the mean minimum f0 values under focus are not significantly lowered compared to those in neutral conditions, though the absolute values are often lower. This suggests that in the production of L2 subjects, focus is realized mainly by raising f0.
Mean maximum and minimum f0 values of words produced before focus are not
significantly different from those in neutral conditions, as shown in the “Pre-Neutral” column, which shows that focus doesn’t affect the portion before the focused syllable.
No difference exists between f0 values under neutral and post-focus conditions. The mean maximum values are only marginally smaller in post-focus conditions, as shown in the “Neutral-Post” column.
Therefore, the visually observed general pattern is verified: under focus condition, the peak of f0 curve is substantially raised; f0 curves of the post- and pre-focus syllables are not
significantly different from those in the neutral condition.
In terms of different lexical tones, it can be seen that the R and L tones show less
significant difference between different focus conditions. In word 1, not all the maximum and minimum f0 values of the R tone are significantly adjusted under focus. In word 2, the maximum f0 value is significantly raised, however the minimum f0 value is not significantly lowered. For the L tone, no significant difference is made over the minimum f0 value when produced under focus. In contrast, the H and F tones in both word 1 and word 2 show significant difference over maximum f0 value between focus and neutral conditions.
To sum up, statistic analysis verifies general patterns and detailed observations made from Figure 2. There is no doubt that the English L2 subjects successfully realized focus while
producing lexical tones. They achieved focus intonation of MC by adjusting f0 values according to different focus conditions. Different lexical tones and focus positions seem to affect the realization as well.
3.1.2 Pitch Range
Significant adjustment over pitch range is another effective indicator of successful
realization of focus. Having measured the f0-max and f0-min respectively, pitch range shows an overall adjustment over the f0 contour.
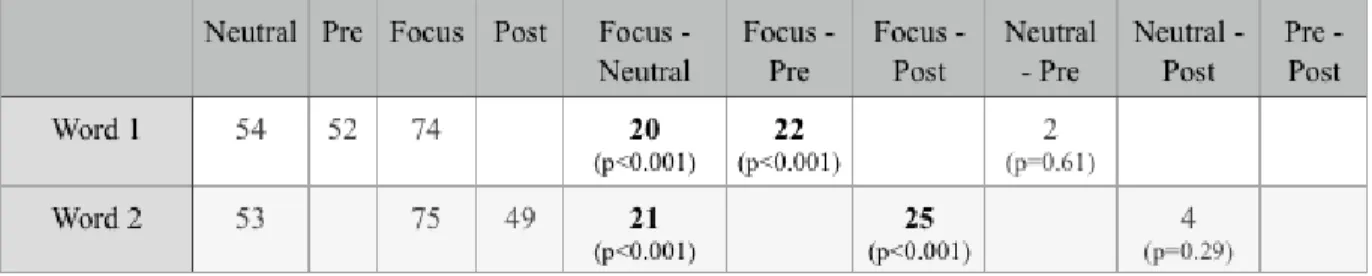
Table 3-2 below displays pitch ranges of both word 1 and word 2 in different focus
conditions. Pitch range is the difference between the highest and the lowest f0 values. In the six columns on the right, the differences of pitch range between different focus conditions are computed the way suggested in the headings of the columns. Same as in Table 3-1, a two-tailed paired t-test is used to show statistic differences and a significance level of 0.05 is adopted. Table 3-2. Pitch ranges in different focus conditions. (In the left four columns, each number is the pitch range in a specific position (word 1 or 2), under a particular focus condition. “Pre” is short for “the pre-focus condition”; “Post” represents “the post-focus condition”; “Neutral” means no focus is placed on any word and “Focus” indicates that the syllable is produced under focus. Numbers in the remaining six columns suggest variation in pitch range between
It is clear that pitch range is significantly greater when the word is produced under focus than in the neutral condition. Both in word 1 and word 2, the difference is around 20Hz. (The difference in word 2 is slightly bigger.) It seems that pitch range in post-focus condition is somewhat lowered compared to that in the neutral condition, however, it is proven not
statistically significant. Difference between pre-focus and neutral conditions is minimal, which again proves focus barely affects the syllable before it.
3.1.3 Duration
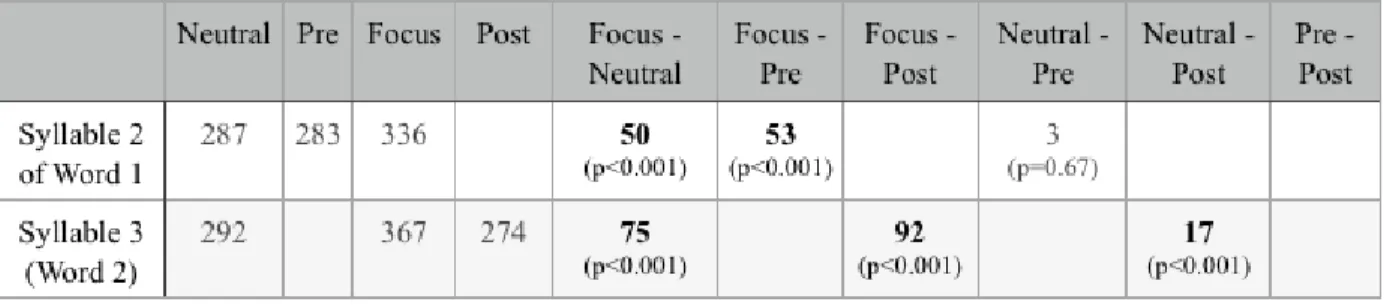
In both English and Mandarin, the focused constituent is produced with a longer duration. Even if lexical tones might bring difficulty in realizing focus for the English L2 subjects, the adjustment over duration is highly expected. Table 3-3 displays how different focus conditions affect the duration of the two syllables. Again, a two-tailed paired t-test was used to show statistic significance of the differences, with a probability level of 0.05. Significant differences are marked in bold.
It can be seen that when the syllable is produced under focus condition, its duration is significantly greater compared to any other focus conditions. No significant difference is found in the duration of syllables produced in neutral and pre-focus conditions. Duration of the syllable right after focus decreases significantly compared to that in the neutral condition.
By looking at changes in durations under different focus conditions, it again proves that the English L2 subjects did successfully differentiate the focused constituents from the neutral ones.
3.1.4 Summary
Display of f0 curves, detailed measurements and statistic analysis of pitch range and duration suggest that in the production of L2 subjects, focus is realized mainly in two ways: First, the overall pitch range increases under focus, while it does not change significantly before and after focus. Secondly, duration of the syllable under focus is significantly longer than any other conditions. It can be primarily concluded that on average subjects successfully realized focus in their production of Mandarin during the experiment. Whether or not their way of
producing focus is the same as that of native speakers will be discussed later in section 3.3 & 3.4.
3.2 Realization of lexical tones
transfer effect from L1. The result might answer the second research question on the deviation in production.
Since the predicted error entails the L2 subjects having difficulty realizing lexical tones under focus, more specifically, by replacing at least some of the lexical tones with a pitch accent, straightforward visual observation of f0 curves of the tones under varying focus conditions should be helpful. If each lexical tone were consistently associated with a distinct f0 curve in all focus conditions, then it indicates Mandarin lexical tones were realized under focus. Consistency is crucial: any identifiable pattern of f0 contour observed in the neutral condition should be found in focus conditions as well. Notice, again, the shape of the f0 contours does not have to be exactly the same as that of the native speakers, what matters is whether consistency exists throughout all focus conditions. If the pattern observed in the neutral condition can no longer be preserved and identified under focus, for example, the distinct f0 curves in the neutral condition tend to overlap and become hard to differentiate from each other under focus, then it might imply that the L2 subjects failed to realize lexical tones.
3.2.1 F0
3.2.1.1 F0: visual observation over f0 curves
Each panel in Figure 3 below shows f0 curves of word 1(the second syllable) when the following syllable carries the same lexical tone and the focus condition is held consistent. Panels on the same row share the same focus condition: neutral, focus on word 1 or focus on word 2. Within each row, each panel only differs in the lexical tone of the following word. Each f0 curve in word 1 corresponds to a lexical tone produced under the specific condition. In Figure 4, f0 curves of word 2 are under examination, therefore lexical tones of word 1 are controlled. Four f0 curves corresponding to the lexical tones were represented with lines in different shades and styles, as indicated in the legend.
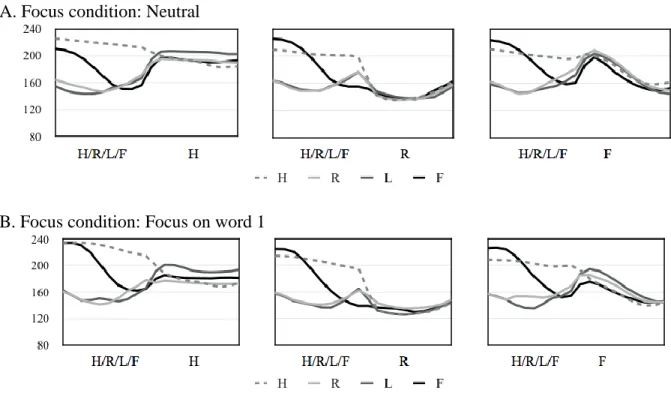
Figure 3. Realization of lexical tones of word 1 (the second syllable). (Lexical tones are labeled as H, R, L or F right below the syllable. “H/R/L/F” represents varying lexical tones in the position. Focus conditions are listed above each row. Lines in different shades and styles represent f0 curves when word 1 carries varying tones. Unit of the y-axis is Hz.)
A. Focus condition: Neutral
C. Focus condition: Focus on word 2
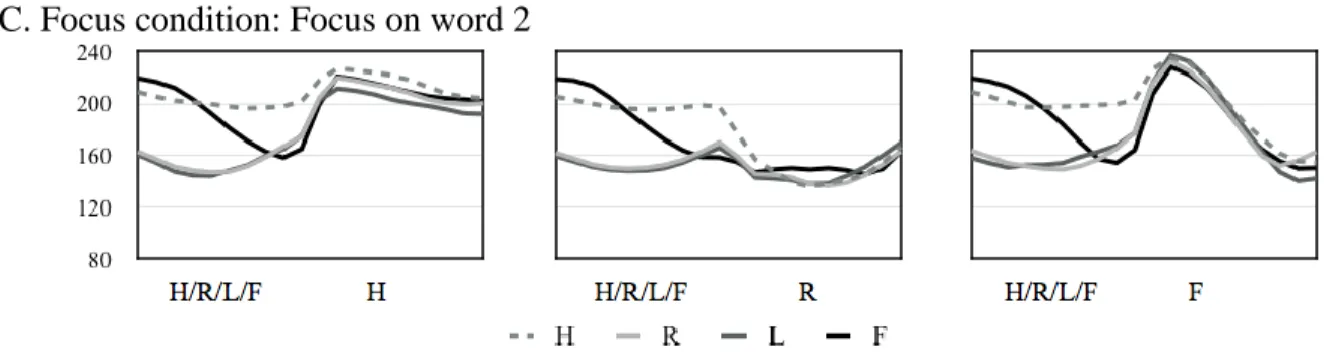
Figure 4. Realization of lexical tones of word 2 (the third syllable). (Lexical tones are labeled as H, R, L or F right below the syllable. “H/R/L/F” represents varying lexical tones in the position. Focus conditions are listed above each row. Lines in different shades and styles represent f0 curves when word 2 carries varying tones. Unit of the y-axis is Hz.)
A. Focus condition: Neutral
B. Focus condition: Focus on word 1
Based on visual observation of Figure 3 and Figure 4, it is clearly shown that the subjects successfully realized lexical tones in all the focus conditions. In each panel, regardless of the focus condition, within the syllable with varying lexical tones, distinct f0 curves corresponding to each lexical tone can be observed consistently. The dotted grey lines, representing the H tone, remain in the high pitch range compared to the other lines, which shows that the H tone was successfully produced with the interference of focus. Another easily observed lexical tone under all focus conditions is the F tone. The black solid line representing the f0 curves of the F tone, always start from a high pitch level and fall rather drastically into a low pitch level, resulting in a typical ‘falling’ f0 contour of the F tone. F0 curves of the R and L tones are similar to the ones in Figure 2, where no obvious differentiation could be seen between the two. As shown in Figure 3, the second darkest solid line, representing the L tone, and the light grey line, representing the R tone, almost always overlapped in the panels. Both lines start from a mid-low pitch level, then more or less lowers in pitch height, and gradually raises to a mid pitch range. This particular observation indicates two facts: First, as mentioned in the previous section, the L2 subjects had difficulty differentiating the R and L tones in the production. Secondly, they managed to produce a rather consistent f0 contour shape for the tones (starting from a low pitch level, moving
downward and then upward, forming a dipping “U” shape) which is obviously different from the others when produced under focus.
3.2.1.2 F0: statistic analysis
By utilizing statistic tools, Table 3-4 below proves that in the production of the L2 subjects, lexical tones indeed significantly affect the formation of f0 curves. In other words, the distinct f0 curves observed above are caused by different lexical tones. The tone identities and the f0 contours are significantly associated with each other.
Table 3-4 has two main sections, A and B, separated by a horizontal thick black line. The upper section A shows mean maximum pitch values of syllable 2 (the second syllable of word 1) and syllable 3 (word 2) with varying lexical tones, under different focus conditions, as indicated by the headings, across all subjects. For example, number 227, in the leftmost cell on the first row in section A means the averaged maximum pitch value of the second syllable with H tone in the neutral condition is 227 Hz. Similarly, the lower B section shows mean minimum pitch values of these syllables with certain lexical tone in conditions suggested by the column and row headings.
In order to show the effect of lexical tones, or in other words, to show whether lexical tones significantly determined the maximum and minimum pitch values (which largely determines the shape of the f0 contours), a two-factors repeated ANOVA analysis was conducted in SPSS version 22. The lexical tones of syllable 2 and syllable 3 were considered independent variables. Significant probability values are shown at the bottoms of the corresponding columns. If the probability value is under 0.05, then it suggests that the lexical tone of the particular syllable significantly affects the maximum or minimum value of the f0 curve.
same syllable. Likewise, for the third syllable, lexical tones significantly affect the maximum and minimum f0 means of the syllable in almost all situations, except when focus is placed on word 2 or the third syllable, the probability value is marginal.
Table 3-4 also suggests that lexical tones have greater impact on the change in maximum and minimum f0 values than the focus conditions.
When syllable 2 is under focus (in the column “W1”), the difference in maximum f0 between the F and R tones is the biggest, as much as 55 Hz, which means changing the tone identity of the syllable causes the largest variation in maximum f0 value of 55 Hz. For the third syllable (in the column “W2”), the difference is as much as 61 Hz between the F and R tones when the syllable was produced under focus. Similarly, the largest difference in minimum f0 value, 79 Hz, can be observed between the H and L tones in the second syllable, and for the third syllable, the number is 76 Hz, between the H and R tones.
The change in maximum and minimum f0 values brought by the effect of focus can be calculated in the same fashion: For the second syllable, the largest difference in maximum f0 can be seen in the F tone between focus on the second syllable and the neutral condition, as much as 30 Hz. (On the “F” row of the “Tone of Syllable 2” section, between “W1” and “Neutral”.) As for the third syllable, the biggest variation is 41 Hz between focus on “W2” and “W1” in the F tone (the “F” row of the “Tone of Syllable 3” section). In terms of the minimum f0 value, for the second syllable, the biggest difference, 15 Hz, is seen in the H tone between focus on the second and third syllable. The number is as much as 25 Hz for the third syllable.
3.2.2 Slope
One effective method to determine whether the L2 subjects realized and preserved lexical tones under focus is to look at the values of slope. For the purpose of the current study, the slope is calculated by dividing the difference between the final and initial f0 values for each relevant syllable with the duration of the syllable. Since the measurements used in the calculation come from time-normalized f0 values averaged across all sentences and subjects, the duration can be seen as the same, or “1”. Therefore the value for the slope is essentially the difference between the initial and final f0 values.
Table 3-5 below shows slope of four lexical tones in four different focus conditions: neutral, under focus, pre-focus and post-focus. With a two-tailed paired t-test in SPSS and a significant probability value of 0.05, it is shown that the slope of the F tone is significantly negative, as expected. Marginally positive slopes of the R and L tones under focus indicate that the L2
Table 3-5. Slope of lexical tones in four focus conditions. (The focus conditions and lexical tones are indicated in the headings. “H” “R” “L” and “F” represent “High tone” “Rising tone” “Low tone” and “Falling tone” respectively. The unit of the slope is Hz.)
3.2.3 Summary
The subjects consistently produced lexical tones regardless of the focus conditions, though the H and F tones were comparatively more accurate than the R and L tones and little
differentiation was made between the R and L tones. The crucial implication of these results is that tone identities were largely preserved in the ‘under focus’ condition without predicted substitution. In fact, lexical tones affected the subjects’ final production more substantially than the focus intonation.
3.3 Comparison between L2 subjects and native speakers
3.3.1 L2 vs Native: Realization of focus
It has been shown in section 3.1 that focus significantly affected the duration, pitch range, maximum and minimum f0 values in L2 production. By comparing these measurements in the current study to those reported in Xu’s study (Xu, 1999), one could see how focus was realized differently in the L2 subjects’ production. Since the absolute values of these measurements are not comparable given different subjects and experiment designs, it is better to look at the percentage of the extent of adjustment each focus condition brought to the measurements. In order to compare the effect of focus, values of each measurement, including duration, pitch range, maximum and minimum f0 values, in neutral conditions are divided by the
difference between varying focus conditions (including under focus, pre-focus, post-focus) and the neutral condition, which shows to what extent different focus conditions adjusted the neutral values of the measurements. Therefore, in Figure 5-8 and the following graphs, “Focus - Neutral (%)” “Pre-focus – Neutral (%)” and “Post-focus – Neutral (%)” mean the percentage of variation each focus condition brings to the particular measurements, with their values in neutral condition as reference. The explicit calculation process, take “Focus – Neutral (%)”as an example, is as follows:
“Focus – Neutral (%)” = (Value in focus condition – Value in neutral condition)/Value in neutral condition
The results shown in Figure 5, 6, 7 and 8 were averaged across all subjects, sentences and lexical tones. Data of native speakers were from Table III, IV and V of Xu(1999).
adjustment was made over duration in the pre-focus condition. In the post-focus condition, the duration of the syllable slightly shortened in both groups. Interestingly, it seems that slightly more variation over duration was made in the production of the L2 subjects, indicating that the L2 subjects had no difficulty realizing focus in terms of duration.
Figure 5. L2 versus native speakers: Extent of variation in duration under various focus conditions. The number of percentage each bar corresponds to shows the extent of increase (when the number is positive) or decrease (when the number is negative) of the duration under a specific focus condition compared to the duration in the neutral condition. The contrast between each focus condition with the neutral condition is indicated below each pair of comparison between L2 and native speakers. For example, “Focus – Neutral (%)” means to the extent of variation in duration under focus condition compared to neutral. Numbers of the y-axis represent percentage.)
subjects managed to adjust pitch range according to varying focus conditions in the same fashion as the native speakers, but the extent of variation was not as large as that of the native speakers.
Figure 6. L2 versus native speakers: Extent of variation in pitch range under various focus conditions. The number of percentage each bar corresponds to shows the extent of increase (when the number is positive) or decrease (when the number is negative) of pitch range under a specific focus condition compared with pitch range in the neutral condition. The contrast between each focus condition with the neutral condition is indicated below each pair of comparison between L2 and native speakers. For example, “Focus – Neutral (%)” means the extent of variation in pitch range under focus condition compared to neutral. Numbers of the y-axis represent percentage.)
Figure 7. L2 versus native speakers: Extent of variation in maximum f0 value under various focus conditions. The number of percentage each bar corresponds to shows the extent of increase (when the number is positive) or decrease (when the number is negative) of maximum f0 value under a specific focus condition based on the value in the neutral condition. The contrast between each focus condition with the neutral condition is indicated below each pair of comparison between L2 and native speakers. For example, “Focus – Neutral (%)” means the extent of variation in maximum f0 value under focus condition compared to neutral. Numbers of the y-axis represent percentage.)
Figure 8 below compares the effect of focus over the minimum f0 values between two groups. The most striking result is that the L2 subjects barely lowered any minimum f0 values under any focus condition. In contrast, the native speakers drastically lowered the minimum f0 values of the syllables under focus and post-focus conditions. This comparative result explains one reason why less variation was made over the overall pitch range in the production of the L2 subjects: they had less difficulty raising the maximum f0 values according to focus conditions, but had much more difficulty lowering the minimum f0 values.
In sum, Figure 5, 6, 7 and 8 confirm the fact that the L2 subjects managed to realize focus by adjusting the duration, overall pitch range, maximum and minimum f0 in the same direction or tendency as the native speakers did, but the extent of variation was less, especially over the minimum f0 values.
3.3.2 L2 vs Native: Realization of focus over four lexical tones
In order to compare how different focus conditions caused different extent of variation to the maximum and minimum f0 values of each lexical tone, Figure 9, 10 and 11 were made and each of them presents a comparison under a particular focus condition as indicated in the titles. The process of calculation is the same as the previous section: only the extent of variation in percentage is concerned instead of the absolute values. The data of the native speakers were from Table VI of Xu (1999).
subjects. Noticeably, the F tone produced by the L2 subjects showed more variation than the natives. In terms of the minimum f0 values, the overall extent of variation was not as big as that of the maximum values, however, it is clear that the H, R and L tones produced by the L2 subjects had much less variation over the minimum f0 values. The largest difference in variation between two groups could be found over the L tone. The native speakers modified the maximum and minimum values of the L tones most substantially across four tones when the syllable is under focus, however, the L2 subjects made the least adjustment. It might suggest that the L2 subjects experienced more difficulty producing the L tone with focus – they couldn’t modify the f0 curve of the L tone as freely as the natives do when focus interferes, and as easy as that of the other lexical tones in the same focus condition produced by the L2 subjects.
Figure 9. L2 versus native speakers: Extent of variation in maximum and minimum f0 values under focus condition compared to neutral condition. The left and right figures show result of maximum and minimum f0 values respectively. In each figure, each pair of bars shows comparison between L2 and native speakers in terms of the extent of variation of each lexical tone, as indicated under the pair. “H”, “R”, “L” and “F” means “High tone”, “Rising tone”, “Low tone”, and “Falling tone” correspondingly. Numbers of the y-axis represent percentage.)
absolute percentage is less than 3%. Therefore, a comparison between two groups over four lexical tones might not be meaningful. This figure again confirms the fact that for the syllable right before the focus, the difference in f0 values is marginal. However, a general tendency to lower both the maximum and minimum f0 values seems to exist for most of the tones.
Figure 10. L2 versus native speakers: Extent of variation in maximum and minimum f0 values under pre-focus condition compared to neutral condition. The left and right figures show result of maximum and minimum f0 values respectively. In each figure, each pair of bars shows comparison between L2 and native speakers in terms of the extent of variation of each lexical tone, as indicated under the pair. “H”, “R”, “L” and “F” means “High tone”, “Rising tone”, “Low tone”, and “Falling tone” correspondingly. Numbers of the y-axis represent percentage.)
Figure 11 above compares in the post-focus condition, how each lexical tone varied in maximum and minimum f0 values. The L2 subjects lowered the maximum f0 value of the H and R tones a little bit more, but failed to lower that of the L and F tones as drastic as the native speakers did. The biggest difference is over the F tone, where the L2 subjects only lowered about 3% of the maximum f0, the native speakers decreased the value about 12%. Looking at the minimum f0 values, the difference between the L2 subjects and the native speakers is even more obvious: For each lexical tone, the native speakers dropped the minimum f0 values over 8%, even as much as 15% for the H tone. However, the L2 subjects barely adjusted the minimum f0 values of the lexical tones. They managed to lower the minimum f0 of the H tone, but much less than 15% of the native speakers. For the R and L tones, they even raised the minimum value slightly.
This figure shows that compared to the native speakers, the L2 subjects had difficulty lowering both the maximum and the minimum f0 values in post-focus conditions. When
the maximum f0 values of the H and R tones, they substantially lowered those of the other tones, resulting in an overall lowering in four lexical tones in terms of pitch.
To summarize, Figure 9, 10 and 11 indicate that, compared to the native speakers, the L2 subjects realized focus differently in terms of the extent of variation over the relevant
measurements of the tones. Figure 12 below directly shows the difference in the extent of variation between the two groups. The differences are calculated by deducting the percentage of the L2 subjects from that of the native speakers, and are averaged across all focus conditions except the pre-focus condition, where neither group exhibited substantial variation. The bigger the difference is, the larger the extent of variation was made by the native speakers.
Figure 12. Difference in the extent of variation between native speakers and L2. (“Native – L2 (%)” indicates that the difference is calculated by subtracting the percentage of L2 from that of native speakers across focus conditions. A positive percentage shows a larger extent of variation in native speakers’ production. The results are grouped according to lexical tones. “H”, “R”, “L” and “F” means “High tone”, “Rising tone”, “Low tone”, and “Falling tone” correspondingly. Both maximum and minimum f0 values are considered, indicated by different shades of the bars. Numbers of the y-axis represent percentage.)
speakers raise or lower the relevant f0 values to a much larger extent over the L tone. Similarly, the L2 subjects did not vary the relevant f0 values of the F tone as much as the native speakers did, but better than the L tone. As for the H tone, the L2 subjects adjusted the maximum value to the same extent as the native speakers. Interestingly, they even made slightly more variation in the maximum f0 value of the R tone. However, in terms of the minimum f0 values, like the F and L tones, much less variation was found over the H and R tones.
3.3.3 L2 vs Native: Realization of lexical tones
Section 3.2 implies that the L2 subjects did realize lexical tones with interference of focus intonation. Exactly how their realization of lexical tones deviates from the native speakers will be shown in the following comparisons, each presenting result under a consistent focus condition, which ranges from neutral, under focus, pre-focus to post-focus. These comparative results are essentially different from those in the previous section: section 3.3.2 shows the effect of focus on each lexical tone, therefore it only looks at the degree of variation; this section treats each focus condition as a controlled factor and it only cares about how four lexical tones were realized. Admittedly, the main purpose of this study is to examine phonetic realization of focus, it is still beneficial to check realization of lexical tones. On the one hand, it might provide insight to the interaction between focus and lexical tones produced by the L2 subjects; on the other hand, it will serve as reference for discussion on L2 instruction of MC.
the f0 curves respectively of each lexical tone. The first method is only applied to the neutral condition since tonal identities have been proved to preserve in other focus conditions.
3.3.3.1 L2 vs Native: F0 curves of the lexical tones in the neutral condition
Figure 13 below compares f0 curves of the second syllable with varying lexical tones produced by the L2 subjects and the native speakers in all neutral conditions. The f0 curves of the native speakers are from Figure 4 of Xu (1999). In Xu’s study, he presented overall f0 contour of the whole sentence with five syllables, but for the purpose of comparison, only f0 curves over the second and third syllables are concerned.
Comparing the lines within the duration of the second syllable, one can easily find out that the most noticeable deviation lies in the shape of the L tone produced by the L2 subjects. In the lower panels of Figure 13, the densest dotted lines, representing f0 curves of L tone, start from a relatively low pitch range compared to the other three lexical tones, and then drop rapidly to a pitch range much lower than the minimum f0 of the F tone. Whereas in the production of the L2 subjects, the L tones, represented by the second darkest solid lines, always start from almost the same pitch level as the R tones, dip a little in height, and then end in a slightly higher pitch than the F tones. F0 curves of the L tones produced by L2 subjects keep overlapping the curves of the R tones, which leads to nearly no differentiation between the L and R tones in the L2 production. The shapes of the H, R and F tones are relatively similar between the two groups.
Figure 14 below shows a comparison between f0 curves of the third syllable with varying lexical tones in the neutral condition. The lower four panels are from Figure 5 of Xu (1999).
Comparing the lines within the range of the third syllable, one could observe similarity in the shape of the f0 contours between the two groups: F0 curves of the H tones are relatively flat, placed in a higher pitch range consistently. The F tones all start from a high pitch and later fall into a lower pitch range. F0 curves of the R tones all show a slight “dipping” form close to the onset of the syllable. When the second syllable carries the L tones, the starting points of the f0 curves of the third syllable are much higher in the upper panel (carryover effect), which again proves that the L2 subjects failed to lower the L tones as much as the native speakers did.
3.3.3.2 L2 vs Native: Mean maximum and minimum f0 of the lexical tones