ARE WE STUDYING WHO WE THINK WE’RE STUDYING?
ROLE OF SOCIOECONOMIC STATUS IN THE VALIDITY OF ESTIMATES OF PNEUMOCOCCAL CONJUGATE VACCINE EFFECTIVENESS IN THE UNITED STATES
Ruth Link-Gelles
A dissertation submitted to the faculty at the University of North Carolina at Chapel Hill in partial fulfillment of the requirements for the degree of Doctor of Philosophy in the Department of
Epidemiology in the Gillings School of Global Public Health.
Chapel Hill 2016
iii ABSTRACT
Ruth Link-Gelles: Are we studying who we think we’re studying? Role of socioeconomic status in the validity of estimates of pneumococcal conjugate vaccine effectiveness in the United States
(Under the direction of Daniel Westreich)
Thirteen-valent pneumococcal conjugate vaccine (PCV13) was licensed for use in children in the United States in February 2010. Shortly thereafter the Centers for Disease Control and Prevention began a post-licensure vaccine effectiveness (VE) study in 13 surveillance sites around the US. Cases were identified through active surveillance and controls were matched to cases by age (+/- 14 days) and zip code, which was used as a proxy for socioeconomic status (SES).
Due to issues locating and enrolled cases and controls in an era of increased cell phone usage, investigators were concerned that zip code may not provide adequate control for SES and that enrolled children may not be representative of eligible children, threatening both the internal and external validity of study results.
We obtained data on SES for cases and controls from a parent interview, birth certificates, and via geocoding and linkage to the US Census Bureau’s American Community Survey. We used conditional logistic regression models to estimate the adjusted and unadjusted VE and to assess effect measure modification by SES of the estimated VE.
iv
unenrolled cases, but we did not find effect measure modification, indicating that external validity of our estimates was high.
v
vi
ACKNOWLEDGEMENTS
Many people made it possible for me to complete this dissertation. I am sincerely grateful for the help, support, and understanding I received along the way.
I would first like to thank Matt Moore, my supervisor at the CDC for the last six years. Matt gave me my first job out of my MPH program and fully supported my decision to go back to school two years later. He made it possible for me to continue working at CDC part-time from North Carolina, and, eventually, to use data from CDC for my dissertation. In short, without Matt, this dissertation would not exist. He humored me, celebrated my accomplishments, and was a sounding board when issues arose along the way. Beyond my dissertation work, Matt has been a fantastic mentor, leading by example, teaching me how to better communicate, and giving generously of his time. As I look forward to the next steps in my career, Matt will be a hard act to follow for future supervisors, and an example of the kind of supervisor and mentor I hope to be.
My dissertation committee chair, Daniel Westreich, has provided excellent mentorship over the last year and half that we’ve worked together. Daniel could have easily made my last year, commuting between Atlanta and Chapel Hill, miserable, but instead he was flexible, understanding, and always available when I needed guidance. His insights into my dissertation work were invaluable, as was his encyclopedic knowledge of the causal inference literature. His appreciation of superhero movies was welcome comic relief.
vii
with questions about biostatistics and David provided great insight into the practical implications of this work. All three vastly improved my dissertation.
I would also like to thank Annelies Van Rie, my first advisor at UNC. Annelies gave me the opportunity to learn a new area of epidemiology (TB and HIV in South Africa) and helped me craft my initial dissertation aims and first draft of my proposal. Thank you.
Nancy Colvin, Carmen Woody, Valarie Hudock, and Jennifer Moore kept and keep the Epidemiology Department running like a well-oiled machine, providing endless advice and support. I would especially like to thank Valarie for her support during a particularly difficult time in the program for me. Her understanding and encouragement were pivotal at keeping me on track.
Of course, this work would not have been possible without the children and parents who participated in the study and without the site surveillance staff who put in endless hours collecting and cleaning the data so I could analyze it.
Finally, I would like to thank my friends and family, who put up with me, encouraged me, and (when needed) reminded me why I was getting a PhD in the first place. My husband, Dan, was a
viii
TABLE OF CONTENTS
LIST OF TABLES ... xii
LIST OF FIGURES ...xiii
LIST OF ABREVIATIONS ... xiv
SPECIFIC AIMS ... 1
BACKGROUND AND SIGNIFICANCE ... 4
Role of vaccines and vaccine effectiveness evaluations on public health ... 4
Impact of vaccines on public health ... 4
Path to vaccine licensure in the US ... 4
Importance of post-licensure evaluations for estimating the impact of vaccines ... 5
Pneumococcal disease and vaccine in the US ... 6
The burden of pneumococcal disease in the pre-conjugate vaccine era ... 6
Licensure, introduction and effectiveness of PCV7 in the US ... 7
Serotype replacement and the need for PCV13 ... 8
Licensure, and recommendations for use and uptake of PCV13 ... 8
Socioeconomic disparities, pneumococcal disease and vaccination in the US ... 10
Socioeconomic health disparities ... 10
Disparities and risk of invasive pneumococcal disease ... 10
Socioeconomic disparities, vaccination, and the vaccines for children program ... 11
Remaining disparities in vaccination coverage ... 11
Individual and neighborhood level measures of socioeconomic status ... 12
ix
PARENT STUDY: PCV13 VACCINE EFFECTIVENESS STUDY ... 15
Active Bacterial Core surveillance system and PCV13 VE extended area surveillance ... 15
IPD case definition ... 16
Case enrollment procedures ... 16
Control matching ... 16
Exposure assessment – provider follow-up and IIS ... 17
Calculation of vaccine effectiveness and primary objective ... 17
RESEARCH METHODS ... 20
Population included in SES analysis ... 20
Covariate assessment/definitions ... 20
ABCs case report form ... 20
Birth certificate data ... 22
Parent interview/provider follow-up ... 23
American Community Survey ... 26
Ethics approval ... 27
ANALYTIC METHODS ... 32
Aim 1 ... 32
Identification of confounders ... 32
Comparison groups... 32
Control for residual confounding ... 33
Aim 2 ... 34
Socioeconomic Position Index ... 35
Choosing variables for modification assessment ... 35
x
Assessment of effect measure modification ... 37
BIAS WITH RESPECT TO SOCIOECONOMIC STATUS: A CLOSER LOOK AT ZIP CODE MATCHING IN A PNEUMOCOCCAL VACCINE EFFECTIVENESS STUDY ... 40
Overview ... 40
Introduction ... 40
Methods ... 42
Results ... 46
Discussion ... 49
GENERALIZABILITY OF VACCINE EFFECTIVENESS ESTIMATES: AN ANALYSIS OF CASES INCLUDED IN A POST-LICENSURE EVALUATION OF 13-VALENT PNEUMOCOCCAL CONJUGATE VACCINE ... 58
Overview ... 58
Introduction ... 58
Methods ... 60
Results ... 66
Discussion ... 68
DISCUSSION ... 79
Overview ... 79
Summary of findings ... 80
Aim 1 ... 81
Aim 2 ... 82
Strengths ... 82
Limitations ... 83
Future directions... 83
Conclusions ... 84
xi
xii LIST OF TABLES
Table 4.1. Variables, sources of information, and availability by case and enrollment status ... 29 Table 4.2. American Community Survey variables included in prediction models for enrollment. ... 30 Table 5.1. Operational definitions of ACS variables included in final prediction model. ... 39 Table 6.1. Number of unique zip codes and census tracts for eligible and enrolled children, by
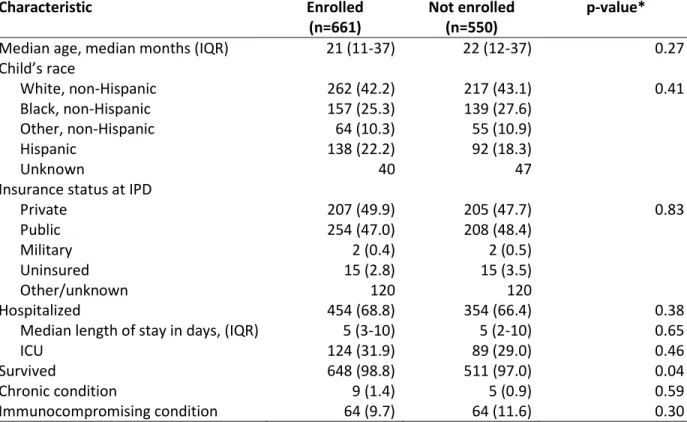
case status and serotype of disease ... 53 Table 6.2. Characteristics of eligible cases and matched controls. Data come from (a) the parent
interview/medical provider, (b) birth certificates, or (c) American Community Survey. ... 56 Table 6.3. Comparison of results of original model vs. models adjusted for minimally sufficient
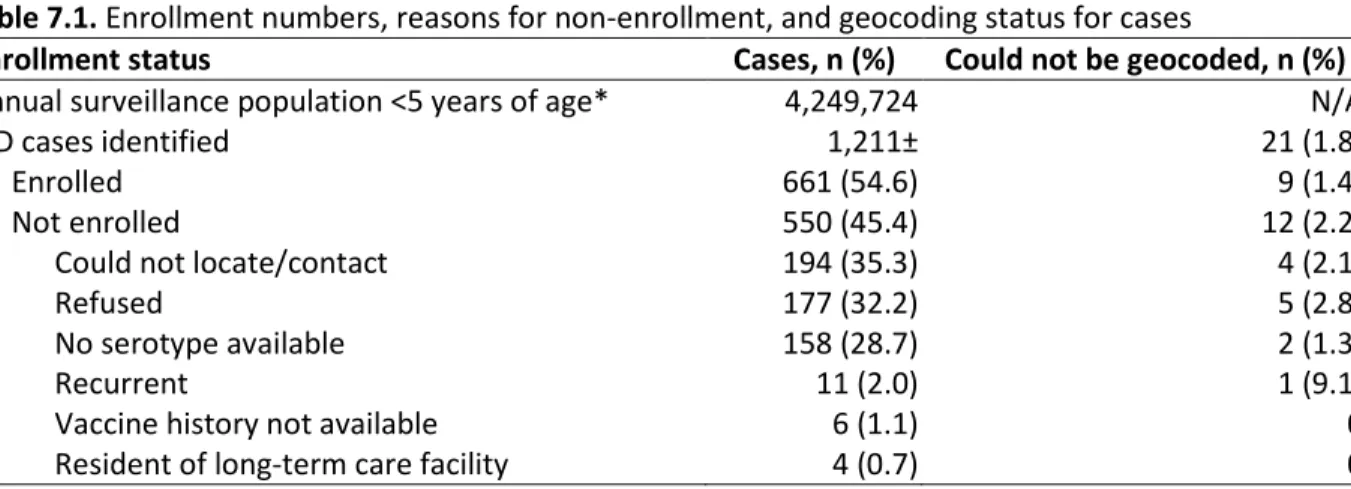
subsets (MSS) for effectiveness against PCV13-type and non-PCV13-type disease. ... 57 Table 7.1. Enrollment numbers, reasons for non-enrollment, and geocoding status for cases ... 71 Table 7.2. Characteristics of eligible cases by enrollment status. (a) ABCs case report form (cases
xiii LIST OF FIGURES
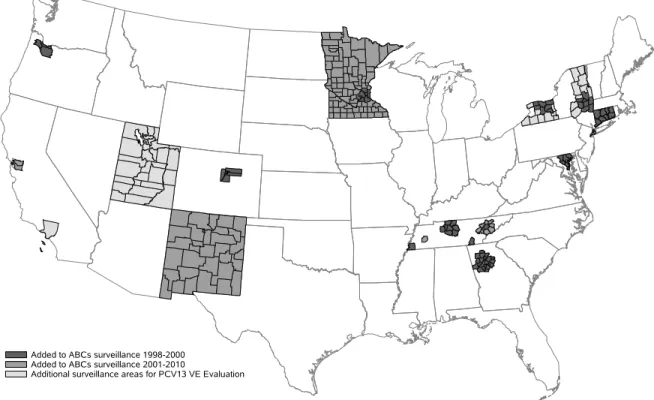
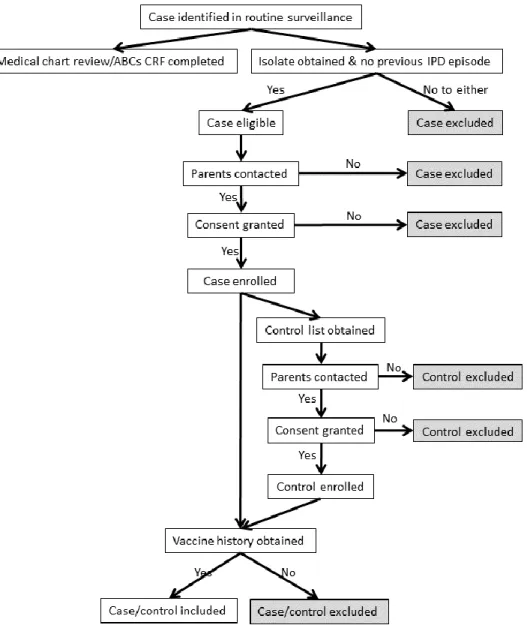
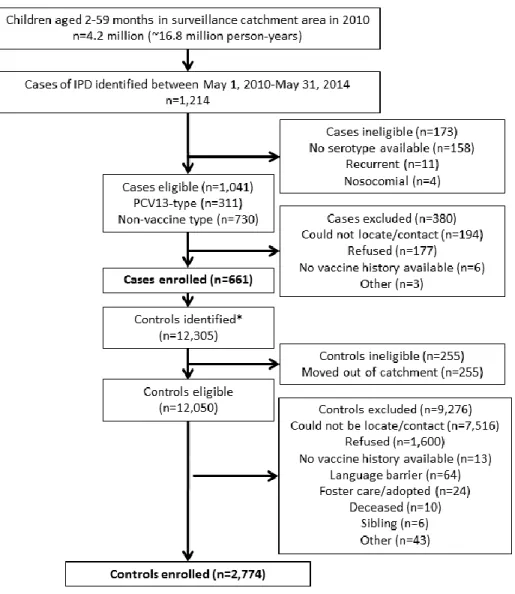
Figure 3.1. Map of surveillance area for PCV13 VE Study, by year added to ABCs ... 18 Figure 3.2. Enrollment procedures for cases and controls in the PCV13 VE Study ... 19 Figure 4.1. Enrollment numbers for SES analysis ... 28 Figure 5.1. Causal diagram showing the relationship between vaccination status, IPD, and
confounders. ... 38 Figure 7.1. Vaccine effectiveness (and 80% CIs) for characteristics retained in the final predictive
model, stratified as indicated. (a) Individual variables; (b) ACS variables, divided at
xiv
LIST OF ABREVIATIONS ABCs Active Bacterial Core surveillance system ACIP Advisory Committee on Immunization Practices ACS American Community Survey
AIC Akaike information criteria
APNCU Adequate Prenatal Care Utilization Index BLA Biologic License Application
CDC Centers for Disease Control and Prevention CI Confidence Interval
CRF Case report form
CT Census Tract
DAG Directed acyclic graph
DTaP Diphtheria, tetanus, and acellular pertussis vaccine DTP Diphtheria, tetanus, and whole cell pertussis vaccine EMM Effect measure modification
FDA Food and Drug Administration ICU Intensive Care Unit
IIS Immunization information system IPD Invasive pneumococcal disease IPV Inactivated Polio Vaccine IQR Interquartile range IRB Institutional Review Board
xv MSS Minimally sufficient set
NIS National Immunization Survey
PCV7 7-valent pneumococcal conjugate vaccine PCV13 13-valent pneumococcal conjugate vaccine PPSV23 23-valent pneumococcal polysaccharide vaccine SEP Socioeconomic Position Index
SES Socioeconomic status RCT Randomized controlled trial RDD Random digit dialing
VAERS Vaccine Adverse Events Reporting System VFC Vaccines for Children
1
SPECIFIC AIMS
In the past decade, many vaccines approved for children in the United States1-4 have been licensed on
the basis of observational immunogenicity and safety data, rather than on the basis of randomized controlled trials (RCT) of vaccine efficacy. In such cases, post-licensure observational studies of vaccine effectiveness (VE) are often the only opportunity to evaluate whether a vaccine is working as expected. While RCTs estimate vaccine efficacy under carefully controlled use and administration and typically have high internal validity, they are often subject to problems with generalizability to the broader population (external validity).5 Post-licensure observational studies, however, provide the opportunity
to assess VE under typical use in the general population (increased external validity), while issues of confounding are of greater concern than in RCTs (decreased internal validity).
2
Socioeconomic status (SES), generally measured as a combination of income, education, and occupation, is likely to be related to whether or not an individual is located and enrolled in an
observational study.7,8 Because less affluent individuals may move or change telephone numbers more
frequently, they may be harder to find than more affluent individuals. Less affluent individuals may have less access to or trust in the medical system, and may not be fluent in English, all factors which decrease their likelihood of consenting to participate in a study.9-11 At the same time, SES is also an increasingly
recognized risk factor for many vaccine preventable diseases since it changes exposure patterns, increases stress, and decreases access to care;12-17 as such, it may be an effect measure modifier of the
impact of vaccine on the disease. Therefore, generalizability with respect to SES may be reduced. In addition to being a risk factor for both selection into a study and disease outcome status, SES is also associated with vaccination status,18-22 meaning that SES may confound the vaccine/disease
relationship. To deal with such potential confounding, studies often match cases to controls on
neighborhood (using zip code in the US), a common proxy for SES.23,24 Little research to date has focused
on understanding how SES may reduce generalizability and/or confound the relationship between vaccination and disease, and whether matching on zip code (or other neighborhood indicators) eliminates this confounding.
We propose to use data from a VE study of 13-valent pneumococcal conjugate vaccine (PCV13) in the US25 to assess how SES may affect both the internal and external validity of case-control studies of
VE. Using these data, we will evaluate the internal and external validity of the estimate of VE from this study in two separate aims. Specifically, we will:
3
Hypothesis: Although matching by zip code likely controls for some confounding by SES, we expect individual (as measured on the birth certificate) and neighborhood (as measured by census tract) level SES indicators to differ between enrolled cases and controls, indicating the potential for residual confounding. We hypothesize this residual confounding to meaningfully change the VE estimate, which for purposes of this analysis will be a 5% absolute change in the estimated VE.
Aim 2. Assess generalizability in a population-based case-control study by: (a) assessing whether enrollment rates differ with respect to SES, and
(b) determining whether SES is an effect measure modifier of the estimated vaccine effectiveness.
Hypothesis: Enrolled cases will differ substantially from the target population by important
characteristics, including maternal race/ethnicity, crowding in the household, and prenatal care quality, all markers of SES. Additionally, because SES is related to immune system status (through nutrition, stress, comorbidities, etc.) and increased risk factors for IPD (e.g., crowding, smoking exposure),26 effect
measure modification by SES, and therefore reduced generalizability, is likely.
4
BACKGROUND AND SIGNIFICANCE
Role of vaccines and vaccine effectiveness evaluations on public health Impact of vaccines on public health
In 1999, the Centers for Disease Control and Prevention listed universally recommended
vaccines for children as one of the top ten achievements in public health of the past century.27 Of the 10
diseases for which universal vaccination was recommended at some point in the 20th century, cases in
the United States have declined by 96-100% since introduction.28 Smallpox has been eradicated and
polio is near eradication.29
Vaccines were again highlighted as a top achievement in 2011, when CDC estimated that vaccination of each US birth cohort under the current schedule prevents approximately 42,000 deaths and 20 million cases of disease, with corresponding cost savings in the tens of billions.29 Worldwide,
vaccines were estimated to have prevented 2.5 million deaths in children under age five in between 2001-2010.30
Path to vaccine licensure in the US
Development and licensure of new vaccines in the US is a lengthy process, often lasting a decade or more.31 The first step toward licensure is a Phase I trial of the vaccine to evaluate safety.
5
the Food and Drug Administration (FDA).31 The BLA is then reviewed by the FDA and may be presented
to the Vaccines and Related Biological Products Advisory Committee if data on safety, efficacy, and appropriate use need review. During this process the manufacturer works with the FDA to refine the indications for use and other statements that will be included in the package insert at the time of licensure. Post-licensure changes in the package insert can result from additional human trials or safety concerns.31
After licensure, CDC’s Advisory Committee on Immunization Practices (ACIP) reviews the available data and makes recommendations for the actual use of the vaccine in the US. Usually, these recommendations mirror those in the package insert approved by FDA, however, ACIP can make “off label” recommendations.32 Recommendations are formally issued through CDC’s Morbidity and
Mortality Weekly Report.
Importance of post-licensure evaluations for estimating the impact of vaccines
Once a vaccine is introduced, post-licensure monitoring of safety, impact and effectiveness begin. FDA and CDC maintain the Vaccine Adverse Events Reporting System (VAERS) for tracking safety. CDC also generally tracks impact and effectiveness through active and passive surveillance and observational vaccine effectiveness (VE) studies. Post-licensure VE studies have become increasingly important as new vaccines are licensed to replace existing vaccines and it becomes unethical to conduct long-term pre-licensure studies when a recommended vaccine is already in use.
Such observational studies have a number of strengths over pre-licensure studies. First, they assess real-world effectiveness (i.e., few exclusion criteria, administration of doses on altered or delayed schedules, herd protection), rather than the controlled environment of an RCT.33 Second, they
sometimes help identify groups where the ACIP recommendations are not being fully implemented, and can also identify vaccine failures.34,35 Third, post-licensure studies allow estimate of direct and indirect
6
benefits.37 Limitations of post-licensure observational studies compared to pre-licensure RCTs include a
potential for uncontrolled confounding, issues with selection bias, and misclassification of exposure (vaccination status).
Most post-licensure VE studies conducted in the US are population-based, nested case-control studies, often with matching to efficiently control for confounding by age and other factors.38-40 Since
2000, CDC has repeatedly conducted post-licensure VE studies for vaccines against influenza,41
pneumococcal disease,42 and meningococcal disease43 within defined geographic active-surveillance
areas. Other groups have used individuals in health maintenance organizations as the target population, especially for influenza studies.44 In both cases matching on zip code is a common way to attempt to
control for confounding by socioeconomic status.42-44 This study design, in turn, has been replicated
around the world with neighborhood, rather than zip code, matching.45-49 Studying the validity of these
methods is the focus of the present work.
Pneumococcal disease and vaccine in the US
The burden of pneumococcal disease in the pre-conjugate vaccine era
Streptococcus pneumoniae (pneumococcus) is a major cause of morbidity and mortality worldwide. Prior to the development and introduction of 7-valent pneumococcal conjugate vaccine (PCV7) in the early 2000s, pneumococcus was the leading cause of pneumonia, bacteremia, sinusitis, and acute otitis media worldwide, and also a major cause of bacterial meningitis.2 The World Health
Organization (WHO) estimates that in 2000, pneumococcus caused 14.5 million cases and 735,000 deaths in HIV-negative children under the age of five, 7% of all-cause mortality in this age group.50 In
7 Licensure, introduction and effectiveness of PCV7 in the US
PCV7 (Prevnar™, Wyeth Lederle) was licensed by the US Food and Drug Administration in February 2000 and covers the seven serotypes that accounted for approximately 80% of invasive pneumococcal infections in the United States in children under six in the pre-vaccine era: 4, 6B, 9V, 18C, 14, 19F, and 23F. Licensure of PCV7 was based primarily on a prospective double-blind randomized controlled trial (RCT) among 37,830 healthy children in a large health maintenance organization in California.52 The trial showed PCV7 efficacy against IPD caused by one of the seven serotypes included in
the vaccine was 93.9% (95% Confidence Interval [CI]: 79.6-98.5%) for one or more doses and 97.4% (95% CI: 82.7-99.9%) for the full, four dose, schedule.2,52 Additionally, the study found that children who
received at least one dose of PCV7 had fewer episodes of less-specific outcomes such as all-cause pneumonia and acute otitis media.2,52
Other factors considered during licensure of PCV7 were double-blind RCTs of a similarly-formulated 9-valent pneumococcal vaccine among toddlers attending day care in Israel and infants in Soweto, South Africa, as well as immunogenicity and safety data from.2,53-61 Both the Israeli and South
African studies found significant declines in nasopharyngeal carriage of vaccine-included serotypes in children who received vaccine compared with children who received placebo (or a non-pneumococcal vaccine).53,55
In the spring of 2000, CDC’s Advisory Committee on Immunization Practices (ACIP)
recommended PCV7 for routine use in the infant immunization series on a “3+1” schedule, that is a three-dose primary series at two, four, and six months of age, with a booster recommended between 12 and 15 months of age. For children aged 24-59 months with specific underlying conditions, ACIP
8
From January 1, 2001 through May 31, 2004 CDC conducted a matched case-control study to estimate the effectiveness of PCV7 in the United States in children under five years of age.42 One or
more doses of PCV7 was found to be 72% effective (95% CI: 65-75%) against all serotypes. Against the seven serotypes included in the vaccine, VE was found to be 96% (95% CI: 93-98%) in otherwise healthy children and 81% (95% CI: 57-92%) in children with comorbid conditions such as cancer and sickle cell anemia.42 The RCT, which only enrolled healthy infants, found an efficacy against IPD of 97.4% (CI:
82.7-99.9%).52 The full, 3+1 schedule, was found to be 100% effective (95% CI: 94-100%) compared with no
doses.42
Serotype replacement and the need for PCV13
Incidence of vaccine-type IPD decreased in the US rapidly after vaccine introduction in both children, due to direct effects, and adults, due to indirect effects.62-65 Unfortunately, however, as rates of
vaccine-type IPD decreased, rates of non-vaccine-type disease began to increase, a phenomenon termed “serotype replacement” that has also been seen to varying degrees in other countries after introduction of PCV7.66-68 While serotype replacement in the US did not reach high enough levels to
cancel out the gains since PCV7, replacement was considered problematic enough to warrant the licensure of a 13-valent vaccine (PCV13).
Licensure, and recommendations for use and uptake of PCV13
PCV13, (Prevnar13™, Pfizer) includes the 7 serotypes in PCV7 and 6 additional serotypes, 1, 3, 5, 6A, 7F, and 19A. PCV13 was licensed by FDA on the same schedule as PCV7, i.e., a three-dose primary series at two, four, and six months of age and a booster dose at 12-15 months of age. Additional doses were recommended for older children with specific underlying conditions.25 Because PCV13 is
9
would, at minimum, be no less effective than PCV7 and it was therefore not considered ethical to undertake a large RCT of the efficacy of PCV13. Instead, the new vaccine was licensed based on safety and immunogenicity data, with the requirement that post-licensure effectiveness studies would follow introduction.69 Safety was assessed through 13 separate clinical trials, including a total of 4,729 infants
and toddlers.70 Immunogenicity was evaluated in a double-blind RCT of 663 infants. The study assessed
whether or not PCV13 elicited pneumococcal IgG antibody concentrations noninferior to those elicited by PCV7. A cutoff of ≥0.35 μg/mL 1 month after a dose was considered noninferior. Functional
responses via opsonophagoocytosis assay (OPA) were measured for a subset of the study population. The primary noninferiority criteria were met for all serotypes, except serotype 3, which failed to elicit a noninferior response after the fourth dose.68
Based on these results, PCV13 was licensed by the FDA on February 24, 2010 for the prevention of IPD caused by one of the 13 serotypes included in the vaccine and for prevention of otitis media caused by one of the 7 serotypes included in PCV7.25 ACIP approved PCV13 the same day and
recommended it replace PCV7 for routine.25
Uptake of PCV13 in young children in the US was rapid owing to the fact that the vaccine replaced an existing vaccine in the routine schedule.71 By 2012, 18 months after PCV13 was introduced,
coverage amongst 19-35-month-olds was 92.3% (+/- 0.8%) for three doses and 81.9% (+/- 1.1%) for four doses, only two percentage points below the corresponding coverage estimates for diphtheria, tetanus, and acellular pertussis (DTaP) vaccine.72
Almost immediately after licensure, CDC began conducting a case-control study of PCV13 to assess vaccine effectiveness against IPD in children in the US46,69,73 CDC’s VE Study began enrolling cases
10
Socioeconomic disparities, pneumococcal disease and vaccination in the US Socioeconomic health disparities
Healthy People 2020 defines health disparities as differences in health that are “closely linked with social, economic, and/or environmental disadvantage.”74 In particular, disparities “adversely affect
groups of people who have systematically experienced greater obstacles to health” based on characteristics including racial/ethnic group, socioeconomic status (SES), geographic location, etc.74
Research has shown wide disparities in health indicators ranging from cancer incidence and survival, to mental health, to diabetes, to infectious diseases.24,60,75,76 Theories for these disparities include in utero
and childhood living conditions, lifetime stress, and differential access to preventive health services and adequate nutrition.12,16,26,76,77
Disparities and risk of invasive pneumococcal disease
Racial disparities in IPD incidence have been a persistent problem in the US78,79 While incidence
rates dropped after introduction of PCV7 across all racial and ethnic groups, disparities remained. Indeed, while rates dropped by 89% (95% CI: 85-92%) in blacks under two years of age by 2002
compared with only 77% (95% CI: 72-81%) in whites of the same age group, IPD rates in blacks remained substantially higher than rates in whites.78 Disparities remained through 2009, with the rate ratio
comparing blacks to whites actually increasing, due primarily to rates of non-PCV7-type IPD increasing faster in blacks than whites.79 While PCV13-types accounted for 71% of cases in white children under
age 5 in 2009, types included in the vaccine accounted for only 58% of cases in black children in this age group, meaning racial disparities are likely to persist after PCV13 introduction.79
These racial disparities may be proxies for socioeconomic disparities, including differences in the prevalence of underlying conditions, higher poverty rates amongst blacks, differences in health
11
and their relationship with IPD is an important component of future disease control efforts, such as targeted immunization campaigns.
Socioeconomic disparities, vaccination, and the vaccines for children program
Historically, immunization rates for children of lower income households in the US for the entire childhood immunization schedule have lagged behind rates in children from wealthier households, especially amongst the youngest children.18 A major resurgence of measles in the US between 1989 and
1991 was primarily concentrated in unvaccinated children less than five years of age, disproportionately from low-income, black, and Hispanic families.19-21 As a result, the Presidential Childhood Immunization
Initiative was developed in 1993 and Congress authorized the Vaccines for Children (VFC) program the following year.19 Since then, the VFC program has provided free vaccines to children who are
Medicaid-eligible, uninsured, American Indian/Alaska Native, or underinsured. Implemented and managed by CDC since its inception, the VFC program is able to buy vaccines at a discount price and distribute them to Federally Qualified Health Centers (registered private physicians’ offices and public health clinics).19 In
2011, a total of 54% of US children aged 19-35 months were VFC eligible, with the largest contingent qualifying due to Medicaid eligibility. Of these VFC eligible children, 52% belonged to a racial/ethnic group other than non-Hispanic white.19
Remaining disparities in vaccination coverage
12
These disparities were seen for pneumococcal vaccine in the early 2000s, when a number of temporary shortages of PCV7 resulted in amended ACIP recommendations and reduced-dose schedules. Children most likely to be affected by the shortages included Hispanics, Hispanic blacks, non-Hispanic American Indians, children who had received prior doses from all public, hospital, military, or mixed-type providers (vs. private providers), children whose mother was never married or
widowed/divorced/separated, children whose mother had not completed college, and children living in a household with an annual income less than 135% of the federal poverty level.82
In addition to truly lower vaccination coverage amongst racial and ethnic minorities, some research has shown that ascertainment of vaccination histories is lower amongst children reporting two or more vaccine providers (e.g., transient children, or those with unstable access to care), adding to perceived disparities.22 However, even after adjusting for these ascertainment issues, the authors
reported that disparities in coverage persisted.22
Individual and neighborhood level measures of socioeconomic status
Socioeconomic status (SES) is a measure of how an individual or family’s economic position relates to others, usually in the same geographic area.83 While no universal definition exists,
individual-level SES is generally measured as a combination of income, education, and occupation.7,8 Race/ethnicity
are sometimes also considered as they correlate with income level, are often associated with health status, and are frequently easier to obtain for research than income.13,16,84-86 Additional characteristics,
such as health insurance status, have also been used.87
In addition to a mix of individual-level characteristics, SES can be measured at the neighborhood or area level, using factors such as unemployment rate, median area income, crime statistics, food scarcity, and crowding in the household, etc.7,12,13,23,24
13
codes are defined by the US Postal Service for convenient mail delivery, are often heterogeneous with respect to SES, and change frequently.23 Researchers have moved toward using census tracts and blocks,
which are defined by the US Census Bureau.88 Census tracts (CTs), the most common area-level SES
measure in the US, generally have between 1,200 and 8,000 individuals and are maintained consistently over long periods of time for ease of statistical comparisons from one census to the next.88
Past research on representativeness by socioeconomic status in VE studies in the US
A commonly listed benefit of observational studies compared to RCTs is increased
representativeness of the source population.89-91 RCTs generally have numerous exclusion criteria,
whereas observational studies usually have more limited exclusion criteria.89-91 However, this benefit
may be limited when observational studies fail to enroll a specific subset of their cases and/or controls, due to either an inability to locate them or to high refusal rates. If the reason a certain subset of the population was not enrolled is a modifier of the main exposure/disease relationship under study, then the results will not be generalizable to the entire target population. For example, if lower SES individuals are not enrolled, due to frequent moves or a lack of telephone, and the intervention under study is less effective in less affluent people, generalizability will be reduced.92
Research into generalizability in VE studies is extremely limited and has focused primarily on adult influenza vaccine. These studies have little application to childhood vaccines as the issues arise from enrollment of individuals living in long-term care facilities, healthy user bias, and vaccine affordability issues, which are mitigated by the VFC program.93-95
14
no longer indicate that an individual lives in a certain region.96-98 Commercial databases often have the
most accurate contact information, but only include a subset of otherwise eligible individuals, making the source population difficult to identify.96 Birth certificate controls are likely to be the most
representative, but the data can be difficult to acquire and contact information may be out of date, especially for older children, making it difficult to actually locate the individual.98 Neighborhood/friend
controls should, in theory, allow easy matching for SES factors, but past research has found this is not always the case.97
While rare for studies in most research areas to report differences between enrolled and unenrolled subjects, researchers of childhood leukemia and magnetic field exposure have taken an interest in generalizability as a way to explain significant effects found in observational studies that cannot be explained by a biological mechanism. A few studies have attempted to assess differences in participation by SES and case status and have found lower participation, particularly by controls, in census tracks or neighborhoods with indicators of lower SES.99-102
All enrollment methods may be susceptible to differential enrollment by SES factors if these factors are associated with researchers’ ability to locate controls and/or obtain their consent.103 One
recent study used a commercial database that classified neighborhoods into “lifestyle” clusters, using demographics augmented by data on consumer purchases. The “lifestyle” controls allowed the authors to compare SES characteristics of enrolled and unenrolled controls, finding higher enrollment rates amongst the wealthier clusters. In the least affluent groups, the proportion of individuals who consented was much higher in cases than controls.97
15
PARENT STUDY: PCV13 VACCINE EFFECTIVENESS STUDY
Active Bacterial Core surveillance system and PCV13 VE extended area surveillance
Since 1998, CDC has conducted active, population- and laboratory-based surveillance for invasive bacterial infections through the Active Bacterial Core surveillance (ABCs) system.104 In addition
to IPD, the ABCs system includes Group A Streptococcus, Group B Streptococcus, Haemophilus influenzae,Methicillin-resistant Staphlococcus aureaus, and Neisseria meningitides. The surveillance populations differ slightly for each pathogen and year, but the total population under surveillance for IPD in 1998 was 17.4 million persons in eight states and had expanded to 30.4 million persons in 10 states by 2012. (Figure 1.1)105
Cases of IPD are defined as persons with Streptococcus pneumoniae isolated from a normally sterile site, such as blood or cerebrospinal fluid, who are residents of the surveillance areas. ABCs collects standard demographic, disease course, and basic risk factor data on all cases (see Appendix 2). Additionally, isolates are sent to CDC for antimicrobial resistance testing and serotyping.
The high burden of invasive disease, particularly an increase in antimicrobial resistant disease, identified through ABCs was one of the factors leading to the development of PCV7 in the late 1990s.2
When PCV7 was introduced in the US in 2000, CDC conducted a matched case-control VE study within ABCs surveillance sites.42 This study formed the basis for the PCV13 VE Evaluation, which began in May
2010, two months after the US release of PCV13.73 Due to relatively lower case counts in 2010 as
compared to 2000, four additional areas were added to the catchment area for the PCV13 VE
16
Throughout ABCs and the PCV13 VE Study extended areas, site personnel routinely contact hospitals and laboratories that serve residents of the surveillance catchment areas. Case and isolate lists are requested and periodic audits ensure that hospitals and laboratories report all cases.
IPD case definition
Eligible cases for the PCV13 VE Study were children aged 2-59 months of age who had S. pneumoniae isolated from a normally sterile site, who resided in one of the surveillance areas on the date their culture was obtained, and had a pneumococcal serotype available.
Case enrollment procedures
Enrollment began on May 1, 2010 and went through May 31, 2014. Once a case was identified by surveillance, cases were reviewed for study eligibility. Cases meeting the study IPD definition were excluded if complete vaccination histories could not be obtained (Figure 3.2). Additionally, if the case had a previous diagnosis of IPD or the parent refused consent, the child was excluded. For eligible cases, site personnel conducted routine medical record reviews to complete the ABCs Case Report Form (CRF, Appendix 2). Site personnel then attempted to contact the parents/guardians of cases to obtain consent and conduct a detailed interview, which included questions about IPD risk factors such as smoking exposure and crowding. Parents were also asked to provide contact information for any providers who had administered vaccines to their child. Sites would then attempt to contact all providers and have them complete the Medical and Vaccine History Form (Appendix 3), which includes a detailed
vaccination history and questions about underlying health conditions and recent antibiotic exposure.
Control matching
17
code as the case’s residence at time of culture. Controls were then contacted, beginning with those controls born closest to the case and moving further out on each side of the case’s birth date. If insufficient numbers of controls were available within the case’s zip code, sites selected controls from the zip codes immediately contiguous to the case. Parents of controls were asked for consent, and then interviewed in the same manner as case parents. Case status could not be blinded due to logistic requirements at the surveillance sites.
Exposure assessment – provider follow-up and IIS
The main exposure for the PCV13 VE Evaluation was dichotomous – whether or not the child received one or more doses of PCV13. Secondary analyses considered two, three, and four doses, as well as mixed schedules (e.g., first two doses of PCV7, followed by two doses of PCV13). For cases (and matched controls) with IPD caused by one of the serotypes included in PCV7, vaccination with either PCV7 or PCV13 was included in the vaccine history.
Vaccination histories came primarily from two sources: medical records and state immunization information systems (IIS). Doses were considered valid if administered more than four weeks after the previous dose. Any doses administered before March 15, 2010 were automatically considered to be PCV7 as PCV13 had not yet shipped in the US. For doses administered on or after March 15, 2010, researchers used lot numbers provided by Pfizer to determine if a dose was PCV7 or PCV13.
Calculation of vaccine effectiveness and primary objective
The primary objective for the parent study was estimation of the VE of one or more doses of PCV13 against IPD caused by one of the serotypes included in the vaccine.106 VE was calculated as
(1-matched odds ratio)*100.42 The matched odds ratio (mOR) was calculated from a conditional logistic
18
19
20
RESEARCH METHODS
Population included in SES analysis
Two surveillance sites, Colorado and Maryland, were not able to obtain individual-level SES variables and cases (and matched controls) from these two sites and were therefore excluded for purposes of the SES analysis (although they were included in the parent study analysis). Complete enrollment numbers for purposes of the SES analysis are outlined in Figure 4.1.
Covariate assessment/definitions
Covariates were collected from a number of sources, although not all sources were available for every child. A list of the variables, sources, and availability is in Table 4.1.
ABCs case report form
Certain SES-related characteristics are routinely collected on the ABCs CRF108 from medical
record reviews and are available for all cases, regardless of enrollment in the PCV13 VE study. Some (e.g., insurance status at IPD culture, underlying condition status) are related to SES or are potentially useful for predicting enrollment.
Outcome
Outcome of the IPD episode was a binary variable, survived or died, and was collected through medical record review or subsequent matching with state death records.
Severity
21
who were admitted to the hospital, but not the ICU, were given a score of 2. Cases who were not hospitalized were given a score of 1.
Underlying condition status
Chronic underlying chronic conditions of interest captured on the ABCs CRF are: diabetes, heart failure, chronic lung disease, cochlear implant, and neuromuscular disorder. Immunocompromising conditions captured on the ABCs CRF are: immunoglobulin deficiency, sickle cell anemia, congenital or acquired asplenia, leukemia, lymphoma, immunosuppressive therapy, complement deficiency, HIV/AIDS, cerebrospinal fluid leak, dialysis, nephrotic syndrome, solid organ malignancy, and bone marrow or organ transplant. Presence of either a chronic or immunocompromising condition resulted in the case being classified as having an underlying condition.25
Insurance status at IPD
The following insurance status choices are available on the ABCs CRF: private, Medicaid/state assistance, Medicare, military, Indian Health Service, incarcerated, uninsured, other (with a specify field). For the purposes of this analysis, Medicare, Medicaid, Indian Health Service, and incarcerated were grouped as “public/state” insurance.
Race/ethnicity
Races captured on the ABCs CRF are: white, black, American Indian/Alaska Native, Asian, Native Hawaiian/Other Pacific Islander, and unknown. Ethnicity is captured as either Hispanic or non-Hispanic. For purposes of this analysis, we created joint race/ethnicity categories: white, Hispanic, black non-Hispanic, other (including American Indian/Alaska Native, Asian, and Native Hawaiian/Other Pacific Islander) non-Hispanic, and Hispanic.
Age
22
We collected demographic and prenatal care data from the birth certificates of enrolled and unenrolled cases and controls. Variables collected were chosen for both their reported association with SES and for their completeness. For example, we collected maternal race, ethnicity, and education level, but not paternal race ethnicity, and education. While these factors have been shown to be related to SES for both parents, the maternal characteristics were close to 100% complete in most study sites, while the paternal characteristics were frequently closer to 90% complete, if collected at all. Although income is not available on the birth certificate, demographic characteristics, such as race/ethnicity and education, correlate with income and can therefore be used to understand an individual’s SES.
Payment status for birth
We collected the principal source of payment/insurance status for the delivery, which is divided into four categories on the standard birth certificate: private insurance, Medicaid, self-pay, and other.109
Adequacy of Prenatal Care Utilization Index
We also collected number and timing of prenatal care visits and gestational age, which will allow us to estimate the Kotelchuck Index, also known as the Adequacy of Prenatal Care Utilization (APNCU) index.110,111 The APNCU is a four-category variable which summarizes both how early in the pregnancy a
woman initiated prenatal care and how many total prenatal care visits the woman received. First, timing of initiation of prenatal care is divided into four categories (1-2 months gestation, 3-4 months gestation, 5-6 months gestation, and 7-9 months gestation). Second, the expected number of prenatal care visits is calculated based on gestational age using an algorithm from the American College of Obstetrics and Gynecology (ACOG): one visit per month through 28 weeks’ gestation, one visit every two weeks through 36 weeks’ gestation, and one visit each week thereafter.111 The ratio of the actual number of
23
during the first two months of gestation and had 100% of the expected prenatal care visits would fall into the “adequate” category. A woman who did not initiate care until the last trimester would fall into the inadequate category, regardless of the number of prenatal care visits she received.
Maternal race/ethnicity
Maternal race/ethnicity was captured on birth certificates with a minimum of the following categories: white, black, American Indian/Alaska Native, Asian, Native Hawaiian/Other Pacific Islander, and unknown. Ethnicity was captured as Hispanic or non-Hispanic. As with the CRF race/ethnicity variable, we created joint race/ethnicity categories: white, non-Hispanic, black non-Hispanic, other (including American Indian/Alaska Native, Asian, and Native Hawaiian/Other Pacific Islander) non-Hispanic, and Hispanic.
Maternal education
Maternal education was divided into four categories: less than high school, high school equivalent, some college, or college graduate and above.
Parent interview/provider follow-up
For enrolled cases and controls, site surveillance personnel conducted a detailed
parent/guardian interview, assessing demographics, IPD behavioral risk factors, and vaccine and medical history information. Parents/guardians were also asked to provide contact information for vaccine providers, who were then contacted to obtain vaccine histories.
Income
24
Parents/guardians were asked what best describes the highest level of education the primary caregiver completed. Categories corresponded closely with categories on the standard US Birth
Certificate: No high school, some high school, high school graduate/GED, technical school, some college, college graduate, postgraduate/professional, and don’t know/refused. These categories were combined to match the categories for the birth certificates as follows: technical school was combined with some college. College graduate and postgraduate/professional were combined.
Race/ethnicity
Race and ethnicity were categorized in an identical way to the CRF.
Smoking exposure
During the interview, parents/guardians were asked a series of questions about the child’s exposure to secondhand smoke during the 30-day reference period (the 30 days before culture for cases or the corresponding month for controls). These questions included whether or not people living or staying in the house smoked, how many cigarettes were smoked per day, and whether the child’s primary or secondary caregiver smoked in a room or car with the child. Given the difficulties associated with accurately assessing amount of smoking and the potential for recall bias, we dichotomized smoking exposure (any vs. none).
Crowding
25 Daycare attendance
Parents/guardians were also asked whether or not their child attended daycare and, if so, what type of daycare (e.g., daycare center or home daycare), for how many hours a week, for how many months before the reference period, and how many children were in the same classroom or home daycare. As with smoking exposure, daycare attendance was dichotomized (any vs. none) to avoid potential recall bias issues.
Breastfeeding
Breastfeeding was also a dichotomous variable, counted if the parent/guardian reported any history of breastfeeding.
Insurance coverage
Parents/guardians were asked to report insurance coverage, which was categorized, as follows: private, Medicaid/state assistance, Medicare, uninsured, other (with a specify field).
Influenza vaccination
Influenza vaccination (including both seasonal and H1N1) status was collected as part of the provider follow-up. We counted any vaccination received in the six months before the case’s culture date.
Influenza infection
Influenza infection within the 30 days before the case’s culture date was also collected via provider report.
Underlying conditions
26
condition. Both the parent interview and the provider forms included questions about these underlying conditions. When a discrepancy between the parent and provider existed, study staff used the
provider’s report as this would be more likely to be complete and accurate.
American Community Survey
Cases and controls were geocoded, regardless of enrollment status. Geocoding was conducted using ArcGIS software, with a standard geocoding protocol. Census tract was merged with data from the American Community Survey (ACS). The ACS is an annual survey conducted by the US Census Bureau. Surveys are distributed to approximately 250,000 randomly selected households each month, totaling three million households a year. The ACS replaced the long form of the decennial census, which was last administered in 2000. The first full ACS was conducted in 2005 and, by 2010, the ACS was able to produce estimates for areas of all population sizes, using information collected from January 2005-December 2009.106 We used the five year estimates from 2009-2013.
27 Ethics approval
28
* Includes controls up to and including the last enrolled controls. Children that were not needed because 4 controls
had already been enrolled for the case, are excluded.
29
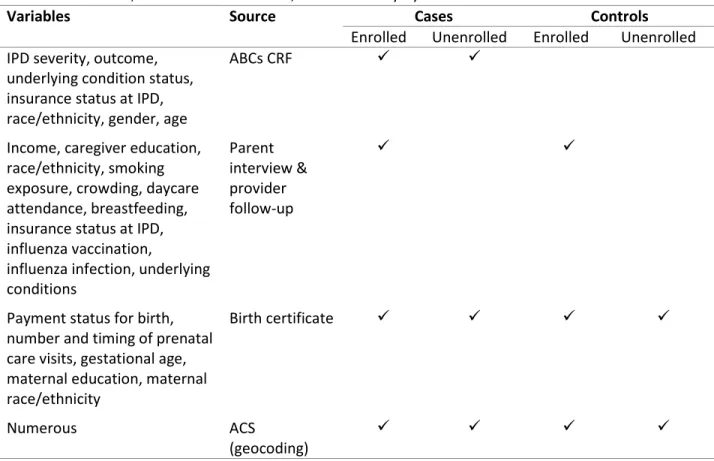
Table 4.1. Variables, sources of information, and availability by case and enrollment status
Variables Source Cases Controls
Enrolled Unenrolled Enrolled Unenrolled IPD severity, outcome,
underlying condition status, insurance status at IPD, race/ethnicity, gender, age
ABCs CRF
Income, caregiver education, race/ethnicity, smoking exposure, crowding, daycare attendance, breastfeeding, insurance status at IPD, influenza vaccination,
influenza infection, underlying conditions
Parent interview & provider follow-up
Payment status for birth, number and timing of prenatal care visits, gestational age, maternal education, maternal race/ethnicity
Birth certificate
Numerous ACS
(geocoding)
30
Category Variable name ACS Table
D em o grap h ics
White, non-Hispanic 0005
Hispanic, any race 0005
Citizen, born in US 0009
Immigrant, entered US in 2010 or later 0010
Born in North America 0010
Born in Europe 0010
Born in Asia 0010
Born in Africa 0010
Born in Latin America 0010
Child living in 2-parent household 0012
Child is native-born 0012
Citizen, naturalized in 2010 or later 0012
Born in same state as current residence 0013
Speaks English well 0014
Never married 0014
Lacks high school diploma (of those ≥25 years) 0043
Veteran (of those ≥25 years) 0073
Private insurance 0116
We
alth
Median income 0015
Living below 100% of poverty line 0015
Lived in same house 1 year ago 0016
Lived abroad 1 year ago 0016
Received public assistance in past 12 months 0034
Lived in poverty in past 12 months 0048
Earns < $30,000 per year 0059
Earns ≥$60,000 per year 0059
Gini Index 0063
Per capita income in past 12 months 0065
Wo
rk
Drives alone to work, workers ≥16 years of age 0023
Workplace in same county as residence 0023
Night shift 0023
Commute time ≥ 60 minutes 0023
No vehicle available for commute 0023
Disabled 0058
Mean hours worked 0078
Unemployed 0079
Working class (includes workers in sales/office, service, production, transportation, moving, construction, and maintenance)
0080 H o u seho ld
Owner occupied housing units 0019
Size of household 0028
Number of workers in household 0028
Female head of household in household with children <18 years, no husband
0034
2-parent household, children <18 years 0034
Unmarried partner living in household 0034
31
Household with no children < 18 years of age 0060
Householder < 25 years of age 0060
Householder ≥ 65 years of age 0060
Occupied housing units 0103
Housing units for rent 0103
Housing units for migrant workers 0103
House with > 1.0 occupant per room 0103
Median rooms in housing units 0104
Median year structure built 0105
Median year householder moved into unit 0105
Housing unit with complete plumbing facilities 0105 Housing unit with complete kitchen facilities 0105
Median rent 0106
Median rent as percent of income 0106
Median monthly housing costs 0108
32
ANALYTIC METHODS
Aim 1
Evaluate whether zip code matching results in a similar distribution of SES in cases and controls; estimate the amount of residual confounding and appropriately adjust the main VE estimate.
Identification of confounders
Confounders for adjustment were identified using a directed acyclic graph (DAG). DAGitty.net (version 2.2) software was used to identify minimally sufficient confounding subsets (Figure 5.1).112-115
Zip code matching ensured enrolled cases and eligible controls had similar aggregate SES at the zip code level, but not at the census tract or at the individual level. Our DAG, however, included these census tract and individual SES measures to determine if zip code was an adequate proxy. Multiple minimally sufficient confounding subsets were identified, with substantial overlap between them. We selected one minimally sufficient subset for our primary analysis based on the completeness of the variables included (i.e., least number of matched pairs dropped due to missing data).
Comparison groups
33
differences between enrolled cases and eligible controls exist, this would indicate zip code matching had failed to control for individual SES.
Second, we restricted our analysis only to enrolled cases and enrolled controls. This allowed us to assess how selection issues, such as failure to locate or enroll controls in the study, affected our final study population. The meaning of the results of this step is dependent on the results of the first step. If enrolled cases were similar to eligible controls and enrolled controls, this would indicate that zip code matching was successful (i.e., enrolled cases were similar to eligible controls) and there was no selection bias. Our study population would therefore be exchangeable with respect to measured SES. If, however, enrolled cases were similar to eligible controls, but not to enrolled controls, this would indicate selection bias. If zip code matching failed (enrolled cases were not similar to eligible controls), any similarity between enrolled cases and enrolled controls would likely be due to chance.
Control for residual confounding
We used the same primary outcome, VE of one or more doses of PCV13 against one of the serotypes included in the vaccine, as the parent study. VE against serotypes not included in PCV13 was also calculated as a negative control. Assuming no cross-reactivity with vaccine serotypes, VE against non-vaccine types should by zero, so an estimate significantly different from zero would indicate a problem with the analysis.
34
(e.g., a change from 95% to 90% effectiveness) to be an indication of meaningful change (i.e.,
meaningful residual confounding). Experience with tracking individual PCV7 serotypes after PCV7 was introduced indicated that a difference of 7% in the VE could result in large differences in post-vaccine cases. For example, serotypes 14 and 19F, both of which were included in PCV7, had pre-vaccine rates of 63.3 and 21.8 cases per 100,000, respectively, in the US. VE for serotype 14 was estimated as 94% (95% CI: 81-98%) and VE for serotype 19F was estimated as 87% (95% CI: 65-95%). By 2004, only 14
breakthrough cases of serotype 14 were identified in ABCs, compared with 45 cases of serotype 19F.34,42,66 This difference, especially given the much higher rates of serotype 14 in the pre-vaccine era,
indicated a difference of 7% would be important, so to be conservative for purposes of the current analysis, we considered a slightly lower difference to be meaningful.
Aim 2
Assess generalizability in a population-based case-control study by: (a) assessing whether enrollment rates differ with respect to SES, and
(b) determining whether SES is an effect measure modifier of the estimated vaccine effectiveness. External validity, or generalizability, is the measure of how well results from a study pertain to individuals in the target population.116-118 Study results may fail to generalize to a target population
under several circumstances.6,116 A key reason that studies fail to be generalizable is when both of the
following criteria are met: (a) selection/enrollment into the study is differential with respect to variable X (i.e., the study population is not representative of the source population with respect to variable X, which is usually a potential confounder), and (b) variable X modifies the exposure/outcome relationship under study.6,116
35
controls should resemble enrolled cases on the matching factor. This analysis, therefore, focuses on representativeness of enrolled cases with respect to eligible cases and leaves questions concerning controls for other analyses.
Socioeconomic Position Index
In addition to the ACS variables used in Aim 1, we calculated a composite index for SES based on work done by the Public Health Disparities Geocoding Project.24 The Socioeconomic Position (SEP) Index
includes ACS variables measuring working class, unemployment, poverty, education, home prices, and median family income. Together these are meant to capture the major SES constructs of wealth, education, and occupation. The SEP Index is created by first calculating the percent of each of the ACS variables included. Then, a standardized z-score is calculated for each variable:
𝑍𝑖𝑗 = (𝑋𝑖𝑗− 𝑚𝑗)/𝑠𝑗
Where Xij is the value of variable j for area i, mj is the mean of variable j across all areas, and sj is the
standard deviation of variable j over all areas.24 The sum of the Z scores for each variable is then the
value of the composite index.
Choosing variables for modification assessment
36
modifiers and related to representativeness, we used predictive modeling to select additional ACS variables to assess for EMM.
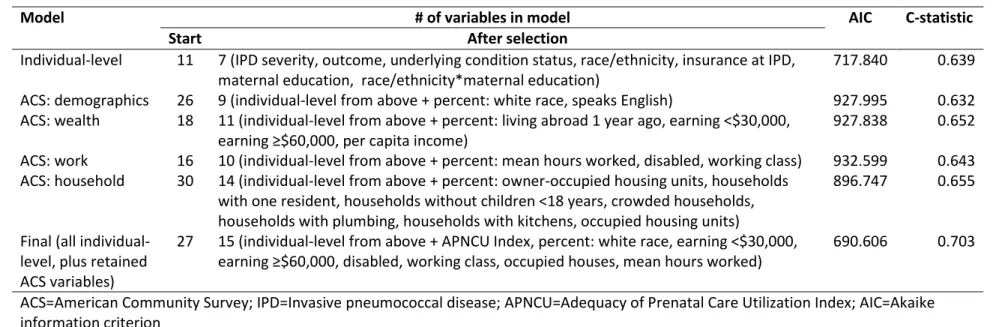
Predictive model
Many of the available ACS variables measured similar metrics (both to other ACS variables and to the individual variables); therefore, we fit a series of models to narrow the selection. All models fit were logistic regression, using backward selection and retaining variables with a p-value of <0.2.
Individual model
We first fit a single predictive model including all individual-level variables: severity, outcome, underlying condition status, child’s race/ethnicity, insurance status at IPD, mother’s education, mother’s race/ethnicity, APNCU Index, source of payment for birth, and interaction terms between child’s race ethnicity and maternal education and between child’s race/ethnicity and APNCU Index. The model was required to retain severity, outcome, underlying condition status, child’s race/ethnicity, and insurance status at IPD.
ACS models
37 Assessment of effect measure modification
Any variables included in the final model predicting enrollment were assessed as potential modifiers, in addition to the SEP Index and individual-level variables chosen a priori. All the individual-level variables were already categorical. We did not include variables (i.e., severity of IPD, outcome status) that are not applicable to controls. Additionally, variables obtained from the case report form for cases (child’s race/ethnicity, underlying condition status, and insurance status at IPD) were not available for controls (since no case report form is completed for controls); however, these variables were
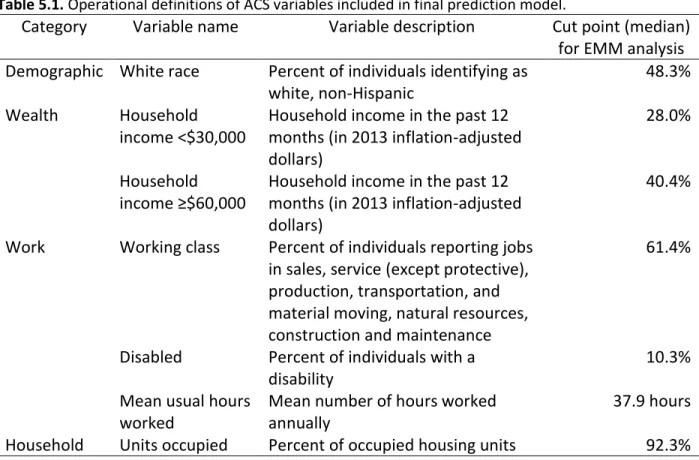
collected as part of the parent interview/provider follow-up for enrolled children and could therefore be assessed for EMM. The ACS variables were continuous, so we dichotomized them at the median for the EMM analysis (Table 5.1). To assess variables as modifiers, we fit conditional logistic regression models for each variable with IPD caused by one of the 13 serotypes included in the vaccine as the outcome, receipt of one or more doses of PCV13 as the exposure, and an interaction term between each variable of interested and PCV13 receipt.119 Because power to assess interaction terms is reduced, we used a
39
Table 5.1. Operational definitions of ACS variables included in final prediction model.
Category
Variable name
Variable description
Cut point (median)
for EMM analysis
Demographic White race
Percent of individuals identifying as
white, non-Hispanic
48.3%
Wealth
Household
income <$30,000
Household income in the past 12
months (in 2013 inflation-adjusted
dollars)
28.0%
Household
income ≥$60,000
Household income in the past 12
months (in 2013 inflation-adjusted
dollars)
40.4%
Work
Working class
Percent of individuals reporting jobs
in sales, service (except protective),
production, transportation, and
material moving, natural resources,
construction and maintenance
61.4%
Disabled
Percent of individuals with a
disability
10.3%
Mean usual hours
worked
Mean number of hours worked
annually
37.9 hours
40
BIAS WITH RESPECT TO SOCIOECONOMIC STATUS: A CLOSER LOOK AT ZIP CODE MATCHING IN A PNEUMOCOCCAL VACCINE EFFECTIVENESS STUDY
Overview
In 2010, 13-valent pneumococcal conjugate vaccine (PCV13) was introduced in the US for prevention of invasive pneumococcal disease in children. Individual-level socioeconomic status (SES) is a potential confounder of the estimated effectiveness of PCV13 and is often controlled for in
observational studies using zip code as a proxy. We assessed the utility of zip code matching for control of SES in a post-licensure evaluation of the effectiveness of PCV13 (calculated as [1-matched odds ratio]*100). We used a directed acyclic graph to identify subsets of confounders and collected SES variables from birth certificates, geocoding, a parent interview, and follow-up with medical providers. Cases tended to be more affluent than eligible controls (for example, 48.3% of cases had private insurance vs. 44.6% of eligible controls), but less affluent than enrolled controls (52.9% of whom had private insurance). Control of confounding subsets, however, did not result in a meaningful change in estimated vaccine effectiveness (original estimate: 85.1%, 95% CI 74.8-91.9%; adjusted estimate: 82.5%, 95% CI 65.6-91.1%). In the context of a post-licensure vaccine effectiveness study, zip code appears to be an adequate, though not perfect, proxy for individual SES.
Introduction
Socioeconomic status (SES) is increasingly understood to be a fundamental cause of disease due to the persistent association between low SES and poor health outcomes, despite substantial advances in prevention and treatment of disease.7,86,120 This association is concerning, especially in the US, where
41
universally accepted, individual-level SES is generally measured as a combination of income, education, and occupation, which in turn provide surrogate measures of resources, prestige, knowledge, and power.7,8,12,115,120-122 Race, ethnicity, and health insurance status may also be considered markers of SES,
because these factors provide insights into access to resources, knowledge and power, and are frequently easier to obtain for research than income or education levels.13,16,84-87
When SES is not the exposure of interest and instead measured to control for potential
confounding of an exposure-disease relationship, most researchers will simply match on SES or control for SES during analysis, depending on the study design. Whether SES is examined as an exposure or confounder, it is paramount that the variable serve as an accurate surrogate of the construct that one intends to measure. For example, if neighborhood-level income is being used as a surrogate for individual level income level, one must be confident that this cross-level inference is valid.123,124
Because SES is often clustered geographically and individual-level data can be difficult to obtain, researchers often assess SES ecologically, for example by using neighborhood-level measures, such as prevalence of poverty by zip code.125-127 For example, research conducted using cases identified through
disease surveillance systems frequently uses zip code as a proxy for individual SES. Surveillance systems generally incorporate addresses, but rarely include characteristics such as personal or household
income, educational attainment, or occupation, which require follow-up with individual cases.12,126 Using
zip code is a relatively easy way to measure SES, but requires the assumption that zip code is an adequate proxy for individual or household level SES.124,128
42
area levels (i.e., census tract) or at the individual level. Thus, even after matching on zip code,
confounding by individual SES may remain. To date, little research has explored whether matching on zip code provides adequate control for individual SES in vaccine effectiveness studies in the US.23,42,44,129
We were concerned about confounding by individual SES in a zip code-matched case-control study of 13-valent pneumococcal conjugate vaccine (PCV13) effectiveness.119 PCV13 was licensed for use
in children in the US in February 2010 and replaced the effective, but more limited, 7-valent vaccine (PCV7).68,73 SES, including income, educational attainment, and related factors (e.g., asthma, smoking
exposure), has been frequently shown to be associated with both vaccination status and risk of IPD and is therefore of concern as a potential confounder.18,19,21,22,78,79,82 Zip code matching was used to control
for SES. The purpose of the present study was to determine whether this approach provided adequate control for confounding at the census tract and individual levels or if additional control of confounding was necessary.
Methods
Enrollment methods
Details of the vaccine effectiveness study and results of the primary analysis have been
previously published.119 Briefly, cases of IPD were identified through the Centers for Disease and Control
and Prevention’s (CDC) Active Bacterial Core surveillance, an active population- and laboratory-based surveillance system for invasive bacterial diseases in ten sites around the US.105 Three other sites with
similar case identification methods were added to increase numbers of cases: New York City, Los Angeles County, and the State of Utah. Eligible case-children were identified through routine surveillance between May 1, 2010 and May 31, 2014 who were 2-59 months of age with a
pneumococcal serotype available.73 Informed consent was obtained for all enrolled cases and controls.