ISSN Online: 2169-2645 ISSN Print: 2169-2637
Case Study Evidence and Behavioural Analysis
of Residential Energy Consumption in the UK
Sven Hallin1, Elizabeth Hooper2, Thomas Weyman-Jones2
1London-Loughborough Centre for Doctoral Research in Energy Demand, School of Civil and Building Engineering, Loughborough University, Loughborough, UK
2School of Business and Economics, Loughborough University, Leicestershire, UK
Abstract
This paper investigates residential energy consumption in the UK by using a novel and topical approach based on behavioural analysis. A key lesson from recent advances in behavioural economics is that the responses of individuals to both policy incentives and uncertainty may differ from the predictions of classical rational optimising behaviour. By employing a focused case study approach using both quantitative and qualitative response analysis, it consid-ers the motivations of residential householdconsid-ers in the UK to reduce fossil fuel use, with additional perspectives from UK landlords, a global environmental NGO, a senior politician, and two senior stakeholder strategy managers from a large energy company. Our interpretative behavioural analysis shows that a variety of incentives are necessary to encourage behaviour change. However, case study participants largely agree on the beneficial role of government reg-ulation and efforts to “nudge” them in the right direction with regard to their energy use. As a means of more effectively reducing carbon dioxide emissions, we conclude that policy should focus on sustainable energy use. The findings allow us to understand why important recent policy initiatives such as the UK Green Deal failed to achieve their objectives and they suggest lessons for more effective incentive based policy making in the field of residential energy con-sumption.
Keywords
Energy Policy, Behavioural Economics, Incentives for Energy Efficiency, Sustainable Energy
1. Introduction
This research aims to understand the motivations individuals have to save
ener-How to cite this paper: Hallin, S., Hooper, E. and Weyman-Jones, T. (2017) Case Study Evidence and Behavioural Analysis of Resi-dential Energy Consumption in the UK.
Open Journal of Energy Efficiency, 6, 14- 40.
https://doi.org/10.4236/ojee.2017.61002 Received: February 2, 2017
Accepted: March 28, 2017 Published: March 31, 2017 Copyright © 2017 by authors and Scientific Research Publishing Inc. This work is licensed under the Creative Commons Attribution International License (CC BY 4.0).
gy and/or use more renewable energy, so that policies such as the Green Deal can offer effective incentives. The central approach in this paper is to report on the actually observed behaviour and responses of a selected group of energy consumers extended to take account of the intentions and responses of residen-tial landlords, policy makers and energy companies. The core of the results is a set of case studies and follow-up interview analysis. These reveal how typical policy incentives such as the UK Green Deal, which is explored in Section 2.3, are imperfectly designed and why they are likely to fail (as the Green Deal did after 3 years of operation). The approach is a new way of evaluating energy poli-cy, and the analysis centres on two important innovations in research procedure. First, the methodology takes engineering based quantitative data obtained in the form of temperature and energy use by case study participants. We then analyse qualitative data on participants’ energy use by using social science research me-thods, and interpret our findings through the lens of behavioural economics li-terature. This mixed methodology allows triangulation of quantitative and qua-litative data to confirm our findings, which are considered appropriately to con-trast with the incentives offered in efficiency incentivising policies such as the Green Deal that was used in the UK between 2013 and 2015.
The research aims to clarify several aspects concerning the motivations behind domestic energy use, specifically:
1) From the observed behaviour of case study participants we can infer the outlines of an effective energy efficiency policy for domestic energy users such as:
• If the true cost of carbon emissions is not incorporated in the policy, how does this diminish the attractiveness of the programme for domestic con-sumers of energy? The UK Green Deal, for example, failed to adopt this ap-proach.
• How best can energy efficiency incentives be simply constructed while send-ing clear signals about the costs of energy consumption. The UK Green Deal, for example, was unnecessarily convoluted and high transaction costs led to an uncompetitive interest rate.
• Should energy savings be calculated on a net present value basis and how can certainty for most efficiency measures be introduced to avoid leading con-sumers to be wary of engaging with the domestic energy policy?
• How can energy efficiency incentives avoid taking no account of the Re-bound Effect? Most domestic participants taking part in this research agreed that they would be likely to spend energy efficiency savings made in their homes on other energy-using capital elsewhere in the economy.
2) How important is it to take account of behavioural responses to uncertainty in energy efficiency incentives? For example could “Nudging” approaches be seen by most domestic participants as an effective means of changing behaviour? Although this might not be used as a fast acting remedy, could it be more effec-tive if used in tandem with government regulation?
domestic energy use, an impact on which would lessen the spur provided by energy efficiency incentives? The research is designed to reveal examples where domestic participants in the UK do not always align their intended energy using behaviour with their actual energy use behaviour. For example, some partici-pants may allow thermal comfort to take precedence over their avowed intention to use energy more efficiently. In other words the motivation is lacking to achieve both aims.
The paper is organized in the following way: in the remainder of section one we discuss energy use; section two presents a literature review; in section three we present our methodology, and in section four present case study results and interpretation; section five concludes and discusses the implications of the re-search for policy development.
1.1. Factors Determining Energy Use
Energy use in buildings depends on the interaction between the occupants [1], the building fabric [2], the way energy is delivered [3] and the local climate [4].
1) Occupants:
The energy requirements of the occupants need to be considered. Questions such as property tenure, number, income and age of occupants, the time the oc-cupants spend in the property, their behaviour patterns/preferences and level of satisfaction while there, need to be addressed along with the implications for energy use.
2) The building fabric needs to be assessed in terms of type of construction, size, layout, design and energy efficiency.
3) Does the way energy is used in the building make economic sense? How ef-ficiently spread is heating, lighting and ventilation throughout the building?
4) The location of the building is a key factor as the local climate could have a major impact on the energy requirements of the structure.
1.2. UK Domestic Energy Requirements
It is of significance to see how energy is consumed between sectors in the UK so that the relevance of the residential sector can be determined. Final energy con-sumption in 2010 for example was (Table 1).
[image:3.595.208.539.618.722.2]Table 1 shows that household energy use is of critical importance if fossil fuels
Table 1. Final energy consumption in 2010 [5].
Sector Percentage transport 35%
domestic 30.5%
industrial 17.3% commercial 6.2% other-energy use
non-energy use*
are to be displaced by renewable energy, and the UK government is to meet its target of reducing carbon emissions to 80% of 1990 levels by 2050. Renewable power sources are needed to supply the residential sector, and they must be de-veloped in a way that balances the costs of reducing carbon dioxide emissions and thus the price paid by consumers, with the benefits of moving towards a ze-ro carbon economy.
In the UK economy, for example, the most recent experience of a direct ener-gy efficiency incentive scheme was the Green Deal which was started in January 2013, with the objective of encouraging residential property owners to install energy efficiency measures in their property and with a commensurate implied aim of a reduction in carbon emissions. Along with a new Energy Company Ob-ligation (ECO) provided for in the Energy Act (2011) [6], the Green Deal re-placed the previous Carbon Emissions Reduction Target (CERT) and the Com-munity Energy Saving Programme (CESP) which expired in 2012.
The core of such energy efficiency schemes is often designed as the provision of finance for the installation of domestic energy efficiency measures. The sav-ings accrued from the more efficient use of energy provides the means of loan repayment, since energy efficiency investments are recouped through energy bill repayments. The financial charge can be to the property’s energy/electricity bill, and while remaining a charge connected to the house regardless of who occupies or owns it. This is why in the UK’s 2013-2015 example, the “Golden Rule”, which was a legal requirement, specified that any charge attached to an energy saving measure must be less than the expected savings from it. In this way the householder would, in theory, always benefit from having the energy efficiency measure installed in their property.
While direct incentivisation of energy efficiency in the home has now been largely discontinued in the UK; the emissions targets are challenging, so policy to encourage energy efficiency remains critical. An effective policy regime must be informed by an understanding of the financial and non-financial incentives which motivate householders to make improvements in the energy efficiency and sustainability of their property. This is especially important with regard to space and water heating which accounts for around 80% of residential energy
use [7]. What kind of framework will motivate people to choose heat pumps
over gas boilers, for example? UK Green Deal projects alone, i.e., without subsi-dy, were effectively limited to basic cavity and loft insulation, and draught proofing, thus restricting the possible energy savings that could be achieved by the implementation of a wider range of energy efficiency measures [8].
2. Literature Review
2.1. Residential Energy Demand Behaviour
cognitive psychology and decision making, have led to considerable re-thinking about the design of incentive based policies to change behaviour. The early work on behavioural analysis of personal decision making was done by Kahneman and Tversky, and it is well described by Kahneman [9] and Thaler [10]. A basic idea that emerges is that it is critical to understand how actual small focus groups of participants respond in practice to investigations of how they treat in-centives and uncertainty. The findings demonstrated many times over that ab-stract theorising about the optimal responses of rational economic man to policy incentives and uncertainty is an imperfect guide to actual behaviour.
In this section we analyse the behavioural economics literature, including how a person’s social identity determines their choices [11] [12]. For example, we know that individuals in defined social groups tend to identify with particular behaviours in that group but from a policy perspective this is problematic be-cause influencing social identity takes time and pathways from policy to effect are unclear.
Mainstream Expected Utility Theory (EUT) purports that decisions between alternatives are made on the basis of the utility value of outcomes [13]. This val-ue is based on the probability of a given outcome for each choice. While it can be argued that it is easier to conceptualise utility with respect to, for example, in-vestment decisions (increased monetary gain equals increased utility) it can be a difficult concept to define when making choices which involve such nebulous factors as emotion, culture or the effects of climate change.
A recurrent theme in Thaler [14] is that market-based approaches are incom-plete, as they assume people are highly rational and unemotional. Thaler & Sunstein [15] suggest that people often make poor choices because they are sus-ceptible to many routine biases. They argue that the scope to make poor choices is wide, and includes education, personal finance, healthcare, what makes them happy, and interaction with the planet itself.
Nudge theory, whose foundations stem from Kahneman’s work on heuristics [9], implies public and private organisations can help people make ‘better’ choices in their daily lives. The theory is an attempt to improve our understand-ing of heuristic influences on human behaviour. These heuristic influences are central to decision-making given the sheer scale of the available choices a person is faced with. Nudge theory accepts the reality of people’s behaviour, and seeks to provide choices which encourage positive, helpful decision-making. These choices ideally benefit the wider interests of society. Table 2 outlines some of the heuristics in nudge theory.
In addition the Rebound Effect [16], [17] is an important research area ig-nored by the Green Deal. The direct rebound effect makes energy cheaper and on an aggregate scale increased energy efficiency can lead to increased economic growth. The net effect can be an overall increase in energy use.
2.2. Residential Emissions
Table 2. Nudge Theory: Authors’ summary.
Heuristics in “nudge” theory-overview (Thaler & Sunstein, 2009) 1. Anchoring and
adjustment
Using known facts and adjusting them to estimate or decide something which is unknown.
2. Familiarity and Status quo bias
The more familiar something is, the more frequently, it is used/communicated. A misplaced sense of trust may be developed. These heuristics are influenced by advertising and mass media, and fear of the unknown.
3. Over-optimism
People tend to under-estimate costs, timescales, and challenges, and to over-estimate rewards and the ease of dealing with unknown things.
4. Loss aversion
The tendency for people to value actual possessions (or gains) more than potential possessions (or gains)-this creates inertia and impedes making changes. People do not like to lose possession of things, irrespective of their actual value/importance.
5. Framing Framing is an individual’s method of heuristically understanding reality. It can therefore include many ways of distorting the attractiveness/unattractiveness of something.
6. Conforming with the population
People have the need for affirmation, and wish to avoid risk or embarrassment. Cultural factors enhance these effects.
that reductions of under 2% per annum are likely to be delivered by 2020 (under the assumption of business as usual), when in fact overall reductions of approx-imately 6% per annum are needed to meet legally binding government targets. In-terestingly, this research concludes the key barrier to achieving satisfactory resi-dential carbon emission reduction is psychological.
In 2009, 15% of direct UK CO2 emissions were from the residential sector and
this increased to 27% if indirect emissions are included. Clearly there is significant potential for the reduction of emissions via energy efficiency.
Figure 1 shows the trend in CO2 emissions (in Million metric tons of carbon
dioxide) in the UK residential sector from 1990 to 2010 by final user and by source [18] [19]. “By source” does not include shipping and aviation.
The figure shows that the absolute value of CO2 emissions has remained largely
unchanged, and James [7] contends that this is because improvements in energy efficiency over the last 20 years have largely been absorbed by increases in de-mand. This increased demand can be explained with reference to two factors. First, it may be partly attributed to the rebound effect, where energy savings from the improved energy efficiency measures result in a less than proportionate reduction in energy use, because the expenditure saved is re-spent on energy consuming goods and services, including higher residential comfort levels.
Figure 1. CO2 emissions from the residential sector in the period 1990-2010 [7] p. 7.
homes resulting in a fairly flat profile for direct residential emissions observed in Figure 1.
Figure 2 [21] outlines the trend in UK CO2 emissions from the residential
sec-tor in the period 1985-2013, and shows that the contribution of the residential sector to a reduction in carbon emissions has so far been modest at approximately 12%. Particularly given the large proportion of final energy consumption ac-counted for by the residential sector, this suggests that there may be scope for re-ducing overall CO2 emissions through carefully crafted policies aimed at the
resi-dential sector. The figure also shows that the resiresi-dential emissions: GDP ratio (right hand scale) has fallen more steeply over the period, which may be explained by increased economic growth outside of the domestic sector, as well as domestic energy efficiency being counterbalanced by rising demand for power related to a proliferation in the number of domestic appliances and gadgets requiring charg-ing. The sharp decline in CO2 emissions towards the end of the period could be
explained by a fall in domestic energy demand due to the deep economic recession which began in 2008.
The CCC’s 3rd Carbon Budget 2018-2022 [20] sets out the steps required to re-duce carbon emissions in the period to 2022, and states that policy measures are required to ensure the insulation of 90% of all lofts and cavity walls, as well as 2 million solid wall dwellings (around 20% of the stock of solid wall dwellings). In addition, the budget requires a replacement of 13 million boilers with newer more efficient condensing boilers, along with a significant increase in appliance effi-ciency. It is predicted that these measures could result in a 17 MtCO2 reduction in
annual CO2 emissions from the approximately 26 million households that make
up the UK residential sector. This equates to a reduction of about 15% compared with 2008 levels.
Figure 2. Trend in residential energy use in the period 1985-2013 [21].
the cumulative effect of energy-saving measures. There is no implied recognition of any rebound effect in these budgets.
2.3. An Example of Energy Efficiency Policy: The UK’s Green Deal
In this section we review the design of the most ambitious UK government policy to enhance residential energy saving; this was the incentive scheme called the “Green Deal”. The main components of the Green Deal scheme were on-site as-sessment, the installation of the efficiency measures, the provision of finance and the facility to attach a charge to a property’s energy bill, and the delivery of contin-uing advice and support to consumers [23].
The Green Deal Plan was a new type of interest bearing loan secured by a charge on the property and householders would be liable for the loan so long as they were the electricity bill payers at the property. To qualify for the Green Deal Plan, pro-posed energy efficiency measures installed were required to demonstrate predicted energy cost savings, which according to the Department of Energy and Climate Change website, would be mainly on space heating. A Green Deal Quality Mark, which could be used only by approved Green Deal assessors, providers and instal-lers, was intended to reassure the public regarding the quality of energy improve-ments. The Green Deal provider set out the key terms of the contract with the consumer under the Green Deal Plan including interest rate (which was fixed) and repayment amounts. Repayments relating to Green Deal installations were col-lected by the electricity supplier via the electricity bill and passed on to the Green Deal Provider. Prospective purchasers or tenants of properties were alerted to the existence of a Green Deal Loan through mandatory Energy Performance Certifi-cates (EPC). Green Deal loans were regulated under the Consumer Credit Act 1974. Separately to money owed to the Green Deal Provider, there may have been a charge to the householder for the Green Deal assessment, made by the initial Green Deal Assessor.
0 0.02 0.04 0.06 0.08 0.1 0.12
0 10 20 30 40 50 60 70 80 90 100
1985 1990 1995 2000 2005 2010 2015
Residential Emissions (Mt CO2)
A basic structure of the Green Deal is represented in Figure 3.
Essentially then, the Green Deal attempted to incentivise householders to install energy efficiency measures by offering advice from trusted sources combined with a long term financing package that, it was hoped, consumers would find attractive. However, as we have described, the operation of the policy was highly complex and transaction costs were necessarily high.
[image:9.595.83.537.255.709.2]From this review of energy saving incentives in theory and an important exam-ple in practice, it may be possible to learn lessons about policy design from a de-tailed analysis of the behaviour of a closely monitored group of participants in an energy consumption experiment. We now turn to describing the case study ap-proach that we used to investigate these issues further.
3. Methodology
The research involved modelling predicted energy use in seven case study proper-ties based on both quantitative and qualitative data. Actual energy use was also measured at case study properties, and temperatures were recorded in the main living area and the main bedroom at each property. Qualitative data was gathered though interviews with one case study participant at each property. Further evi-dence of consumer attitudes was gained through semi structured interviews with stakeholder groups including landlords, an environmental group, an energy com-pany, and a member of parliament. Case study participants also took part in a fo-cus group session after most of the empirical research had been completed.
3.1. The Sampling Process
Following the literature [24], we considered the characteristics of the sample care-fully. For example, it was important that participants were aware of the relation-ship between energy use and climate change, energy security, pollution and re-source availability. A truly random sample of participants drawn from the wider population might have held viewpoints based on a lack of (or incorrect) factual information regarding the use of fossil fuels. This may have yielded less construc-tive opinions and possibly introduced more bias than opinions garnered from the purposive sample of participants who took part in the research [25].
Ideally we would have obtained a representative and unbiased subgroup drawn from the UK population. However, it was not feasible to obtain a random sample due to resource constraints and insufficient information about the potential sam-ple population.
Given this information deficit, we chose to employ the technique of “snowbal-ling”, which involves starting with one or two representative participants known to us, and then asking these participants to introduce the researcher to other mem-bers of the relevant population [26] [27].
Once the participants had been selected by given ethical participation, we con-sidered potential innate bias, but found that it was not a problem among this sam-ple. Firstly because we had no prior knowledge of the opinions of any of the par-ticipants with regard to energy use and climate change. Secondly the specification of the precise interview questions had not been decided.
sufficient in order to assess their motivations with regard to this research [26] [27] [28]. As such, the results and conclusions drawn from both the qualitative and quantitative data produced by the research are considered valid. Further details on the methodology and sampling methods used are available by reference to Hallin [29].
3.2. Winter Temperature Measurement
Hobo Pendant Temperature Data Loggers (UA-001-08) were calibrated and then placed in the main living room and the main bedroom in each case study property, and recorded temperature every 30 minutes. Monitoring took place from midnight 16 October 2013 until midnight 11 February 2014, covering most of the autumn and winter months, when energy demand would be highest. In addition to re-cording temperature in the case study properties, external temperature was meas-ured with a Hobo Pendant Temperature Data Logger. All temperature data was collected from a single urban area of the East Midlands, so the external tempera-ture data is relevant to all the case study properties. The data from the Hobo Pen-dants was downloaded at the end of the monitoring period using Hoboware soft-ware.
3.3. Winter Energy Use
Actual energy use over the winter monitoring period of four months was meas-ured from gas and electric meter readings at the properties. Gas meter readings were taken in cubic feet or cubic metres, (depending on the meter configurations) which were then converted to kilowatt hours.
Electricity meter readings are in kilowatt hours. When meters are dual rate, each reading is in kilowatt hours. So combined together, the total units represent the amount of energy used from the electricity supply. Receiving electricity on a dual rate basis may or may not be cost-effective, depending on the time of day when most energy is used. The cost will depend on the particular supplier tariff, and this can change over time. So for the purpose of this study, the comparative figure of interest was the actual energy use, rather than its cost.
Total energy use in kilowatt hours from each case study was calculated by com-bining gas consumption (where appropriate) and electricity consumption over the measured period.
3.4. Predictive Energy Modelling
Predictive energy modelling is a tool for estimating energy use in particular build-ings, and was used in the UK residential sector to calculate whether a property was suitable for support under the Green Deal scheme.
indica-tors; a SAP rating, an Environmental Impact rating and a Dwelling CO2 emission
rate. Because they are adjusted for floor area, SAP ratings are independent of size of building for a given built form. Further details of the methodology are given in Appendix A.
3.5. Qualitative Research
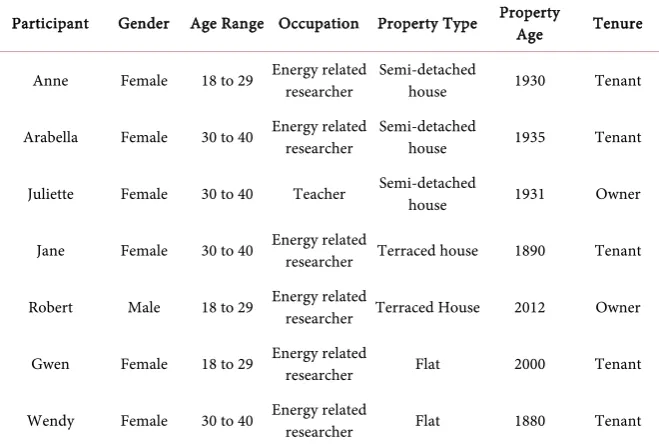
[image:12.595.207.537.272.496.2]The qualitative research consisted of semi-structured interviews to explore atti-tudes to energy with the seven case study participants (Table 3), three landlords of residential property (Table 4), two energy company executives, one environmental group executive, and a senior politician who represented the local area as a mem-ber of Parliament (Table 5).
Table 3. Case study participants: occupants (pseudonyms used).
Participant Gender Age Range Occupation Property Type Property Age Tenure
Anne Female 18 to 29 Energy related researcher Semi-detached house 1930 Tenant
Arabella Female 30 to 40 Energy related researcher Semi-detached house 1935 Tenant
Juliette Female 30 to 40 Teacher Semi-detached house 1931 Owner
Jane Female 30 to 40 Energy related researcher Terraced house 1890 Tenant
Robert Male 18 to 29 Energy related researcher Terraced House 2012 Owner
Gwen Female 18 to 29 Energy related researcher Flat 2000 Tenant
Wendy Female 30 to 40 Energy related
[image:12.595.208.539.532.606.2]researcher Flat 1880 Tenant
Table 4. Research participants: landlords (pseudonyms used).
Participant Gender Age Range Occupation Number of buy to let properties Ava Female 40 to 50 Print estimator 4 Mike Male 40 to 50 Business owner 3 Patrick Male 30 to 40 IT manager 3
Table 5. Environmental, energy and political representatives (pseudonyms used).
[image:12.595.204.540.640.733.2]26
The results of our qualitative research were combined with the quantitative research results in order to triangulate the findings by comparing predicted energy use with actual energy use. Also participants’ interview responses were compared with their actual behaviour. Measured temperatures in each case study property gave some appreciation of the participants’ thermal comfort range and its influence on their actual energy use.
Interview questions were devised on the basis of a number of key questions arising from previous research (e.g. [9] [11] [12] [14] [16] [17] [31] [32] [33]) These are listed below.
Key Issues Used to Devise Interview Questions
1) How do domestic residents think about their energy use?
2) How does the form of energy residential consumers use appeal to their ideological, health or materialistic/economic consumer needs?
3) What impact has culture on energy use and can this be changed with edu-cation policy or through commercial/political marketing?
4) How does more information on domestic energy consumption, such as smart meters which provide real-time information on energy use, automatically encourage greater energy efficiency or is it more complicated than this?
5) How important/possible is it for domestic consumers to measure their energy use in all energy related activity (so they can be aware of technology effi-ciency rebound effects)?
6) How responsible do domestic consumers feel for their efficient use of energy?
7) How could tax incentives (which replace up-front subsidy or future gov-ernment cost) be devised on a sectoral basis to make a difference?
3.6. Data Analysis
The analysis of qualitative data may be approached in numerous ways [24]. While the concepts revealed by our data analysis were linked to the literature re-view, the inferential data derived from the analysis was not constrained in any way by predetermined theory.
Coding is one of the most common methods used to analyse and uncover concepts from qualitative data. Codes can be attached to words, phrases and sentences or whole paragraphs. This research used inferential coding to assign meaning to the descriptive or inferential information revealed during the study [24] [25], i.e. answers to interview questions and focus group responses.
Our source data was divided into the subcategories of UK case studies, UK focus group and other UK stakeholders and also into nodes, which contain data about specific ideas/themes of analysis. Nodes were also included for positive, negative and mixed views. Inferential answers could then easily be assigned a particular viewpoint by including it in the relevant node. Matrix coding queries were done to combine results from different nodes. For example, attitudes
wards climate change might be inferred from participants’ attitudes towards other factors, such as finance, how responsible people feel for their energy effi-ciency, etc.
4. Results and Discussion
4.1. Case Study Predicted and Actual Energy Use
Summary of UK case study participant’s household temperature and energy data (predicted and extrapolated actual)
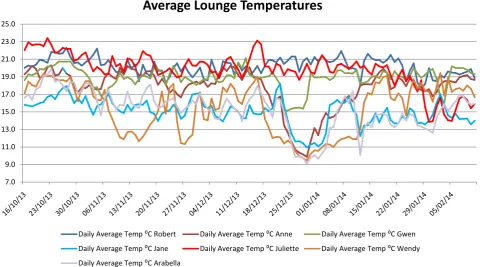
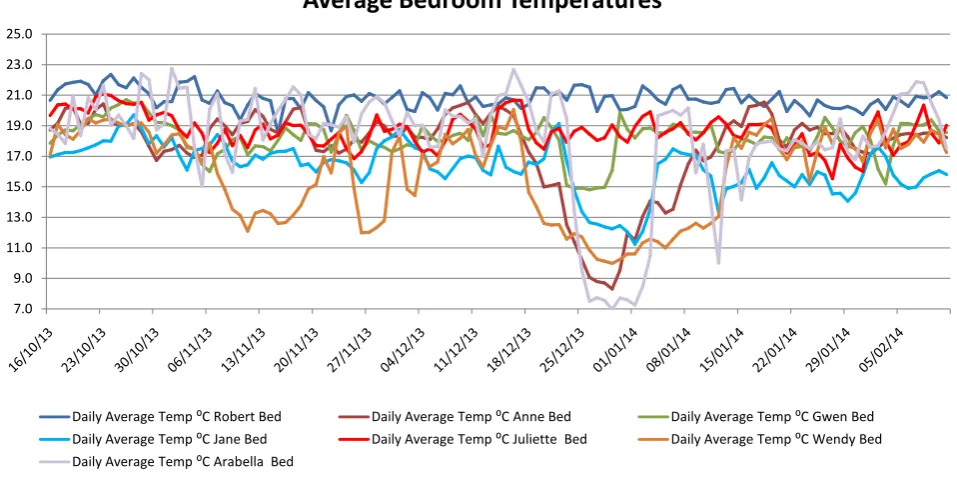
The following composite Figure 4 and Figure 5 show average lounge and bedroom temperatures for each UK case study participant over the winter pe-riod. Table 6 shows a composite of total predicted and actual energy use by par-ticipant.
4.1.1. Energy Use
Table 6 shows that for most participants (not Juliette and Anne), predicted an-nual energy use is higher than actual energy use, in some cases significantly. One reason for the lack of correlation between predicted and actual energy use is that SAP predictive analysis uses “standard occupancy” assumptions that do not al-ways reflect actual occupancy patterns or behaviour.
[image:14.595.59.540.447.714.2]The concept of standard occupancy is important in rating energy use in prop-erties, because it renders Energy Performance Certificates (EPC) a useful tool by which consumers may compare one property with another. So although the Green Deal allows some consideration of occupancy, (properties are classified as light, medium or heavy in terms of energy use), the SAP assessment concentrates
Figure 4. Average lounge temperatures.
7.0 9.0 11.0 13.0 15.0 17.0 19.0 21.0 23.0 25.0
Average Lounge Temperatures
Figure 5. Average bedroom temperatures.
Table 6. Case study energy use.
Total Energy by Type
Predicted (SAP) kWh/m2/year
Actual kWh/m2/year
Predicted energy use difference from actual
(%)
UK Case Study Participant
Gas & Electricity 317 352 −10% Anne Gas & Electricity 288 220 +31% Arabella Gas & Electricity 167 107 +56% Gwen Gas & Electricity 262 205 +28% Jane Gas & Electricity 199 220 −10% Juliette Gas & Electricity 177 139 +27% Robert Electricity 222 98 +26% Wendy
on the fabric of the building and the means of energy delivery.
Therefore the SAP predicative analysis of energy use is likely to over-estimate energy use in a four-bedroom property which has only one occupant rather than a family of four. Conversely, it is likely to under-estimate the energy use of a small flat occupied by a large family using considerable amounts of heat and hot water.
Thus the standard predictive analysis can have a wide variation when com-pared with actual energy use in a property. Nevertheless, recommended energy efficiency measures do make sense if they have an impact on cost and individu-al thermindividu-al comfort.
However, even allowing for this latitude in the SAP projection as compared with actual energy use, in many of our UK case studies the discrepancy is very
7.0 9.0 11.0 13.0 15.0 17.0 19.0 21.0 23.0 25.0
Average Bedroom Temperatures
[image:15.595.207.538.368.535.2]large. For example Robert actually uses less than half the electricity predicted, even though SAP ignores any energy requirements for cooking or the use of other electrical items, such as computers and televisions, etc. The energy pre-diction would have been even higher if SAP took these other items into ac-count.
Gwen lives alone in a two-bedroom flat, yet her actual space heating energy use is almost 40% less than predicted, even though whatever heat she used would permeate most areas of her flat.
Jane lives alone in a two-bedroom mid-terraced house, and uses around half the electricity predicted by SAP.
Juliette lives alone in a three-bedroom semi-detached house. Her energy use is actually slightly more than that predicted by SAP.
Wendy lives alone in a one-bedroom mid floor flat. All her energy needs are supplied by electricity. She uses around 44% of the energy predicted.
Anne shares a three-bedroom semi-detached house with two other people. Her space heating usage is slightly more than predicted, and her electricity use is considerably more, no doubt reflecting on energy use by electrical items such as computers amongst members of the household.
Arabella shares a two-bedroom semi-detached house with one other person. Her space heating use (gas) is only about 70% of that predicted, yet electricity use is marginally higher. However, she has a bedroom electric heater, which she uses to ensure thermal comfort.
Our research therefore highlights the limitations of SAP in terms of predict-ing energy use and consequential potential savpredict-ings under the Green Deal.
4.1.2. Temperature
Overall, Robert and Juliette (both homeowners) live in properties with the highest average temperatures and Jane’s property records the lowest tempera-tures. Yet, because Robert lives in a newly built house, his energy bills are much lower than Jane’s. Wendy’s energy use is very low, but this is at least in part be-cause she is absent from her flat on a number of occasions during the monitoring period. Gwen’s relatively modern flat also means that energy bills are low-around half that of Jane’s-even though the data indicates that she lives in relative thermal comfort. Arabella’s bedroom temperature is consistently higher than the tempera-ture in her lounge, indicating that she uses her electric bedroom heater frequently. At this point we turn to Tables 7-9 which collates responses to the qualitative questions reflecting the key issues of energy awareness that were discussed above.
A summary of Other UK Stakeholders responses (landlords, environmental group, energy Company, politician) is shown in Table 8 and Focus Group res-ponses in Table 9.
4.2. UK Case Studies
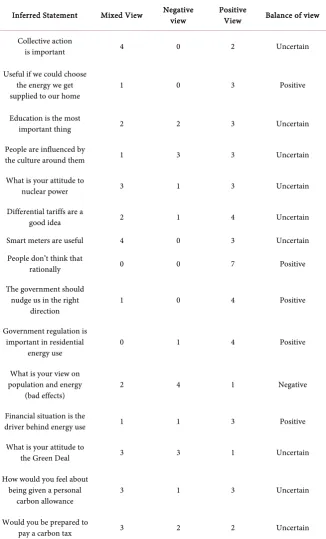
Table 7. UK case studies*.
Inferred Statement Mixed View Negative view Positive View Balance of view Collective action
is important 4 0 2 Uncertain Useful if we could choose
the energy we get
supplied to our home 1 0 3 Positive Education is the most
important thing 2 2 3 Uncertain People are influenced by
the culture around them 1 3 3 Uncertain What is your attitude to
nuclear power 3 1 3 Uncertain Differential tariffs are a
good idea 2 1 4 Uncertain Smart meters are useful 4 0 3 Uncertain People don’t think that
rationally 0 0 7 Positive The government should
nudge us in the right
direction 1 0 4 Positive Government regulation is
important in residential
energy use 0 1 4 Positive What is your view on
population and energy
(bad effects) 2 4 1 Negative Financial situation is the
driver behind energy use 1 1 3 Positive What is your attitude to
the Green Deal 3 3 1 Uncertain How would you feel about
being given a personal carbon allowance
3 1 3 Uncertain
Would you be prepared to
pay a carbon tax 3 2 2 Uncertain *Positive views agreed with the inferred statement, Negative views disagreed with the inferred statement, Uncertain views were mixed. This applies to all other groups in the study.
strands in the literature covering occupant behaviour and energy use, and par-ticipants views were considered in relation to these strands.
Table 8. Other UK stakeholders.
Inferred Statement Mixed View
Negative view
Positive
View Balance of view Collective action is important 1 0 6 Positive Useful if we could choose the
energy we get supplied
to our home 0 0 3 Positive Education is the most
important thing 5 0 2 Uncertain People are influenced by
the culture around them 2 1 4 Uncertain Attitude to nuclear power 3 1 2 Uncertain Differential tariffs are a good idea 1 1 3 Positive
Smart meters are useful 1 0 6 Positive The rebound effect is important 4 0 0 Uncertain People don’t think that rationally 0 0 6 Positive The government should nudge us
in the right direction 1 0 6 Positive
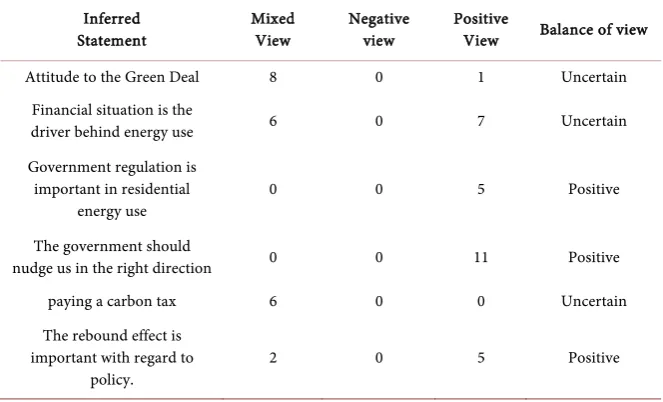
Table 9. Focus group responses.
Inferred Statement
Mixed View
Negative view
Positive
View Balance of view Attitude to the Green Deal 8 0 1 Uncertain
Financial situation is the
driver behind energy use 6 0 7 Uncertain Government regulation is
important in residential
energy use 0 0 5 Positive The government should
nudge us in the right direction 0 0 11 Positive paying a carbon tax 6 0 0 Uncertain The rebound effect is
important with regard to policy.
2 0 5 Positive
“The Green Deal will deliver energy saving packages to millions of home across the country” [34].
[image:18.595.207.539.385.586.2]Figure 6. UK cavity wall & loft insulation 2008-2014, [35] QSR P. 36.
Figure 7. Solid wall insulation 2008-2014, [35] QSR P. 36.
The number of households in Britain is approximately 26 million, and of these around 8 million have solid walls. Of the remaining 18 million, nearly 14 million have cavity wall insulation. The total number of properties with satisfactory loft insulation is just over 16 million. Details of cavity wall and loft insulation are shown in Figure 6. So the potential number of households who could benefit from better insulation is very high.
insu-lations were installed in the year from September 2013, during which the Green Deal was the flagship policy for residential property emissions reductions.
Figure 6 and Figure 7 clearly show that progress in installation of insulation measures in domestic properties was comparatively more successful prior to the onset of the Green Deal in January 2013.
The behavioural economics insights associated with Kahneman and Thaler, suggest at least three behavioural characteristics that distort the mainstream ex-pected utility theory approach:
• reference dependence, i.e. households will focus only on changes to wealth, rather than allowing for the absolute level of wealth following the decision; • loss aversion, households will be more sensitive to (even small) losses than to
gains of the same absolute value;
• use of decision weights that are non-linearly dependent on but not equal to objective probabilities, resulting in the overweighting of low tail probabilities (large losses or gains with low objective probability) and underweighting of high tail probabilities (small losses and gains with high probabilities). These three factors are amongst those which contribute to the empirical ob-servation that many household investment decisions which would be adopted in an EUT model are rejected in practice.
The Green Deal appears to have been designed to address a capital market problem instead of an energy efficiency or emissions reduction target. House owners have always been free to fund energy efficiency improvements through bank loans secured on the property, but the Green Deal offered an alternative, arguably unnecessary, source of finance through a loan from the house owner’s energy supplier secured on the continued existence of an electricity or gas supply contract.
There was a fundamental contradiction in the Green Deal. While the avowed purpose of the policy was to improve energy efficiency in order to drive down greenhouse gas emissions which impose a positive social cost of carbon on the economy, this social cost was not used to evaluate the energy savings. If the cost of externalities was included as advocated by Tol [32] and Stern [33], there would be a substantial incentive to use more sustainable energy. This may, for example, have resulted in increased demand for domestic ground and air source heat pumps which currently require subsidy to be competitive with fossil fuel generated energy. Put more simply, the policy was predicated on the assumption that the market price of energy understated the social cost of energy consump-tion, but it was the market price rather than the social cost that was used in the evaluations.
Nevertheless the rate of interest offered on Green Deal loans was almost 7 per-cent per year fixed into the future, for the estimated lifespan of the energy im-provement measure. Thaler [10] reflects on experience with the Green Deal during his work with the Behavioural Insights Team of the UK Government. In discussion with DECC, the problem of inadequate insulation of attics was ad-dressed by a behavioural incentive in the form of a “make it easy” formula, whe-reby household inertia to make the effort would be overcome by an arrangement for the attic insulation provider to tidy up and de-clutter the householder’s attic for an additional price equal to approximately the cost of the insulation itself, a total of about £370 or 18 percent of the median monthly UK household pre-tax income. Take-up of this offer was negligible, suggesting that the behavioural ob-stacles to even low-cost high-return investments have been significantly unde-restimated. This research supports this view,
Additional reasons that the Green Deal was not effective include:
• The savings calculated to obtain Green Deal finance were not determined on a net present value basis. Nominal savings over the life of the energy efficient measure were estimated, and only savings made in the first year after installa-tion were guaranteed.
• The structure of the Green Deal was convoluted, with assessors originally in-tended to be independent from installers and providers (as is confirmed by Juliette’s experience, this is not always the case). This meant transaction costs were increased for all the actors involved with energy saving installations. • Very few energy improvement measures were likely to be cost-effective [8].
Case Study participants (although not other UK stakeholders) viewed the re-bound effect as another reason the Green Deal was an ineffective policy.
Saund-ers [16], Sorrell [17] and many others, including Adetutu, Glass and Weyman-
Jones [36], confirm that improved energy efficiency results in a less than propor-tionate reduction in energy consumption. In fact, research shows that in the ag-gregate, increased energy efficiency can lead to increased economic growth [37]. If this growth depends on energy from fossil fuels, then CO2 emissions are likely
to increase, at least partially offsetting residential efficiency savings.
individual consumers have no such care or obligation, thus potentially making policy implementation politically difficult.
5. Conclusions and Policy Implications
The research found definite support for financial incentives as a successful me-chanism to influence behaviour. However incentives must be aligned with indi-vidual consumer needs in order to be effective. This means that policies designed to influence energy demand behaviour in the residential sector need to be nuanced, perhaps targeting different groups of people in specific ways. Variables such as income levels, cultural mores (incorporating educational, ideological ideas, and views on social identity), heuristic bias, and the potential for people to make choices need to be taken into account. Developing policy that can success-fully deal with such a wide variety of influences is clearly difficult. This research shows that the Green Deal, the government’s primary residential energy policy, was never effective. Apart from its convoluted, costly structure, and because of the rebound effect, it did not effectively address the important issue of climate change. From a financial point of view, without subsidy, the rewards to the con-sumer were too meagre and uncertain to constitute a reasonable incentive. The non-financial incentives may have become more important over time, with slow cultural change.
A change in residential energy policy could involve a change in emphasis away from energy efficiency to energy sustainability. One possibility might be to tax fossil fuels (effectively a carbon tax), so that the price of energy from rene-wables and nuclear power became competitive [38]. As consumers consistently resist tax increases, a finding supported by this study, the revenue raised from a new tax could be rebated, so that the net effect was no increase in energy cost to the consumer. However, a tax of this nature would make renewable energy more attractive as a form of energy supply. Such a policy might shift demand away from fossil fuels and towards renewables. As the policy progressed, the tax levy from fossil fuels could be reduced and some subsidy would be required from the government to mitigate the impact of the higher price of renewable energy. However, consumers might accept a gentle increase in energy prices and in any case, this might be compensated by a reduction in renewable energy prices due to an increase in efficiency.
Another possibility could be to levy an environmental tax on existing residen-tial property that did not meet a certain standard of sustainability. This could be linked as a progressive surcharge on the local property tax, and thus property values. It could be made clear that the surcharge would increase by a fixed per-centage each year, thus incentivising residential consumers to act immediately to improve the sustainability of their energy use.
Green Deal, as transactional costs would be lower. This could form part of a framework that encouraged householders to choose heat pumps over gas boilers, where for example, energy companies provided subsidies for research and mar-keting to promote this change.
Acknowledgements
This research was made possible by EPSRC support for the London-Loughbor- ough Centre for Doctoral Research in Energy Demand, grant number EP/ H009612/1.
References
[1] Monahan,S. and Gemmell, A. (2011) How Occupants Behave and Interact with Their Homes. In: Milton K., Ed., The Impact on Energy Use, Comfort, Control and Satisfaction. HIS-BRE Press on behalf of the NHBC Foundation, Milton Keynes. [2] Lomas, K. (2010) Carbon Reduction in Existing Buildings: A Transdisciplinary
Ap-proach. Building Research & Information, 38, 1-11.
https://doi.org/10.1080/09613210903350937
[3] Lowe, R. (2007) Technical Options and Strategies for Decarbonising UK Housing. Building Research & Information, 35, 412-425.
https://doi.org/10.1080/09613210701238268
[4] Reinders, A., Vringer, K. and Blok, K. (2003) The Direct and Indirect Energy Re-quirement of Households in the European Union. Energy Policy, 3, 139-153. [5] DUKES (2011) Digest of United Kingdom energy statistics.
http://www.decc.gov.uk/assets/decc/11/stats/publications/dukes/2303-dukes-2011-c
hapter-1-energy.pdf
[6] Energy Act. (2011) The National Archives, London.
http://www.legislation.gov.uk/ukpga/2011/16/contents/enacted
[7] James, P. (2012) Overcoming Barriers to Low Carbon Dwellings: The Need for In-novative Models of Finance and Service-Provision. Environmental Development, 2, 6-17.
[8] Bowen, A. and Rydge, J. (2011) Climate Change Policy in the United Kingdom. (August Policy Paper). Grantham Research Institute on Climate Change and the Environment, London School of Economics, London, 251-269.
https://doi.org/10.1787/5kg6qdx6b5q6-en
[9] Kahneman, D. (2011) Thinking, Fast and Slow, Macmillan. London.
[10] Thaler, R. (2015) Misbehaving: The Making of Behavioural Economics. Penguin Books, London
[11] Akerlof, G. and Kranton, R. (2000). Economics and identity .The Quarterly Journal of Economics, 115, 715-753.https://doi.org/10.1162/003355300554881
[12] Vale, B. and Vale, R. (2010) Domestic Energy Use, lifestyles and POE: Past Lessons for Current Problems. Building Research & Information, 38, 578-588.
http://www.tandfonline.com/doi/abs/10.1080/09613218.2010.481438
[13] Mongin, P. (1997) Expected Utility Theory. In: Davis, J., Hands, W. and Maki,U. Eds., Handbook of Economic Methodology., London, 342-350.
[14] Thaler, R. (1994) Quasi RationalEconomics. Russell Sage Foundation, New York. [15] Thaler, R. and Sunstein, C. (2009) Nudge: Improving Decisions About Health,
[16] Saunders, H. (1992) The Khazzoom–Brookes Postulate and Neoclassical Growth. The Energy Journal, 14, 131-148.
[17] Sorrell, S. (2007) Energy Group for the Technology and Policy Assessment Function of the UK Energy Research Centre. The Rebound Effect: An Assessment of the Evi-dence for Economy-Wide Energy Savings from Improved Energy Efficiency. UK Energy Research Centre, Sussex.
[18] DECC (2011a) UK Emissions Statistics: 2009 Final UK Figures. Department of Energy and Climate Change.
www.decc.gov.uk/en/content/cms/statistics/climate_stats/gg_emissions/uk_emissio
ns/2009_final/2009_final.aspx
[19] DECC (2011b). UK Emissions Statistics: 2010 Provisional UK Figures. Department of Energy and Climate Change.
www.decc.gov.uk/en/content/cms/statistics/climate_stats/gg_emissions/uk_emissio
ns/2010_prov/2010_prov.aspx
[20] CCC (2008) Building a Low-Carbon Economy—The UK’s Contribution to Tackling Climate Change. http://www.theccc.org.uk/reports.
[21] DECC & AMECO (2013) Eurostat AMECO database.
http://ec.europa.eu/economy_finance/ameco/user/serie/SelectSerie.cfm
[22] CCC (2008) Carbon Budgets. The Committee on Climate Change.
www.theccc.org.uk/carbon-budgets.
[23] DECC (2011) The Green Deal and Energy Company Obligation Consultation Document. DECC. Department of Energy and Climate Change © Crown, London. [24] Myers, M.D. (2013) Qualitative Research in Business & Management. 2nd Edition,
Sage Publications, London.
[25] Miles, M. and Huberman, A. (1994) Qualitative Data Analysis: An Expanded Source-book. 2nd Edition, CA: Sage Publications, Newbury Park.
[26] Yin, R. (1994) Case Study Research, Design and Methods. 2nd Edition, Sage Publi-cations, Newbury Park.
[27] Noy, C. (2008) Sampling Knowledge: The Hermeneutics of Snowball Sampling in Qualitative Research. International Journal of Social Research Methodology, 11, 327-344.https://doi.org/10.1080/13645570701401305
[28] Bryman, A. (2008) Social research methods. 3rd Edition, Oxford University Press., New York.
[29] Hallin, S. (2016) Reducing residential Sector Dependence on Fossil Fuels : A Study of Motivating Factors. http://ethos.bl.uk/OrderDetails.do?uin=uk.bl.ethos.689532 [30] BRE, (2011) Standard Assessment Procedure (SAP 2009).
http://www.bre.co.uk/sap2009/page.jsp?id=1642
[31] Hassett, K. and Metcalf, G. (1993) Energy Conservation Investment: Do Consumers Discount the Future Correctly? Energy Policy, June, 710-716
[32] Tol, R. (2007) The Social Cost of Carbon: Trends, Outliers and Catastrophes. Eco-nomics Discussion Papers, Kiel Institute for the World Economy, 2007-2044.
http://www.economics-ejournal.org/economics/discussionpapers/
[33] Stern, N.H. (2009)A Blueprint for a Safer Planet: How to Manage Climate Change and Create a New Era of Progress and Prosperity, Bodley Head, London.
[34] DECC (2010) The Green Deal. A Summary of the Government’s Proposals. De-partment of Energy and Climate Change.
[35] DECC (2014) Domestic Green Deal and Energy Company Obligation in Great Brit-ain. Monthly report December 2014. Department of Energy and Climate Change.
https://www.gov.uk/government/uploads/system/uploads/attachment_data/file/388
325/Monthly_Statistical_Release_Green_Deal_and_ECO_in_GB_18_Dec.pdf
[36] Adetutu, M., Glass, A. and Weyman-Jones, T. (2016) Economy-Wide Estimates of Rebound Effects: Evidence from Panel Data, The Energy Journal, 37(3).
[37] Thomas, B. and Azevedo, I. (2013) Estimating Direct and Indirect Rebound Effects for US Households with Input-Output Analysis. Ecological Economics, 86, 188-198. [38] Chen, L., Lu, L., Tai, M., Hu, S. and Wang, V. (2014) Energy Structure, Energy Pol-icy, and Economic Sustainable Development. International Review of Economics & Finance, 34, 203-210.
[39] Stroma Certification (2014)
Appendix A
The SAP procedure was applied to the case study properties in this research. Calculations were entered via computer software [39] into a SAP 2009.90 work-sheet. Overall dimensions of the properties were entered by number of floors (area × height). SAP ignores internal walls in the area calculation. Ventilation rate data such as number of fans, flues, etc. were also important inputs. The ven-tilation rate is the rate at which air enters or leaves a building and it is important to estimate this as it impacts on the overall heating requirement. In this section of the SAP, either the pressure test (air leakiness from the house) results are noted or the predefined values in the SAP appendices are applied. Pressure tests had not been undertaken on the case study properties so default values were used. Had these tests being conducted, it could have meant small differences in total predicted energy use in each property. SAP uses a property’s age as a key metric in determining predicted energy efficiency. This is because methods of construction, building fabric, and insulation levels tend to closely relate to the year of construction. None of the properties surveyed as part of this study were particularly untypical of the period in which they were built, so where there was an absence of property specific data, the use of default values in the modelling was unlikely to result in large errors in predicted energy use.
U-values, which indicate the insulation properties of materials or composite materials such as windows, doors, floors and walls, were included in the software worksheet. As there were no known actual values, reference was made to per-formance data tables in the SAP manual.
SAP estimates a thermal mass parameter based on the noted construction elements, such as walls, floors, doors, etc. and the total floor area. The heat loss associated with thermal bridges is the linear thermal transmittance. If this data is unknown (which was the case for the properties under study) the transmission heat transfer coefficient is calculated by reference to Appendix K in the SAP manual.
The number of occupants (which is assumed in SAP, depending on the floor area) is used to calculate water heating energy use. SAP takes account of heat loss from water storage, but this is not applicable to properties which have a combi boiler.
Boiler efficiency and standing heat loss is also included in the SAP calculation, with figures provided from the Product Characteristics Database or the manu-facturer’s specification.
Internal gains from occupancy (typically 60 watts × number of occupants) and lighting (from SAP Appendix L) are included in the calculation of heating re-quirements. However electricity for other electrical items and energy required for cooking are ignored in the SAP calculation.
Solar gains are calculated by inputting the latitude of the property and win-dow orientations.
To work out the energy use SAP adds up energy use from space heating, water heating, ventilation and lighting minus any energy savings from renewable energy saving technologies, such as solar PV panels. It converts the calculated total energy use which is in kWh into a power consumption figure of kWh/annum. The total energy cost for the dwelling is then worked out using standardised fuel prices (which are averages by region of prices over the previous three years).
The final SAP rating and the Environmental Impact (EI) rating is derived from a scale between 1 and 100. Higher values on the scale are associated with lower energy costs for the SAP rating or lower CO2 emissions per annum for the
EI rating.
Submit or recommend next manuscript to SCIRP and we will provide best service for you:
Accepting pre-submission inquiries through Email, Facebook, LinkedIn, Twitter, etc. A wide selection of journals (inclusive of 9 subjects, more than 200 journals)
Providing 24-hour high-quality service User-friendly online submission system Fair and swift peer-review system
Efficient typesetting and proofreading procedure
Display of the result of downloads and visits, as well as the number of cited articles Maximum dissemination of your research work
Submit your manuscript at: http://papersubmission.scirp.org/
![Table 1. Final energy consumption in 2010 [5].](https://thumb-us.123doks.com/thumbv2/123dok_us/7771054.717204/3.595.208.539.618.722/table-final-energy-consumption-in.webp)

![Figure 1. CO2 emissions from the residential sector in the period 1990-2010 [7] p. 7.](https://thumb-us.123doks.com/thumbv2/123dok_us/7771054.717204/7.595.210.537.72.208/figure-co-emissions-residential-sector-period-p.webp)
![Figure 2. Trend in residential energy use in the period 1985-2013 [21].](https://thumb-us.123doks.com/thumbv2/123dok_us/7771054.717204/8.595.180.440.74.285/figure-trend-residential-energy-use-period.webp)
![Figure 3. Basic structure of the green deal (adapted from [23]).](https://thumb-us.123doks.com/thumbv2/123dok_us/7771054.717204/9.595.83.537.255.709/figure-basic-structure-green-deal-adapted.webp)