ISSN Print: 2152-7180
DOI: 10.4236/psych.2018.910141 Sep. 20, 2018 2457 Psychology
Causes and Effect of Occupational Stress and
Coping on Performance with Special Reference
to Length of Service: An Empirical Study Using
Multinomial Logistic Regression Approach
Kanaka Durga Veer Prasad
1*, Rajesh Vaidya
21Rashtrasant Tukadoji Maharaj Nagpur University, Nagpur, India
2Department of Management and Technology, Shri Ramdeobaba College of Engineering and Management,
Nagpur, India
Abstract
The manuscript presents the outcome of our research study on effect of oc-cupational stress, coping strategies adopted, length of service and their rela-tion with performance of employees. A survey using an undisguised quesrela-tion- question-naire was carried on the employees working in the International Agricultural Research Institute and Information Technology sector in Indian Metro, Hyde-rabad. The data from the 756 respondents, including 381 women and 375 men responses was used for analysis. The occupational stress was measured using 14 stress causing components—workload, co-workers, peer, peer-support, role ambiguity, role conflict, career, harassment, psychological factors, physiolog-ical factors, behavioural factors, social support, job control, approach coping and voidance coping, length of service on dependent factor Performance of the respondents from the International Agricultural Research Institute and IT sector. The effect on dependent variable performance with the independent factors length of service was divided into 4 groups in 1 - 5 years, 6 - 10 years, 11 - 15 years and >15 years of service, occupational stress factors, coping strategies were measured. The overall C-Alpha value is 0.92 for overall com-ponents, 0.91 for occupational stress comcom-ponents, 0.92 for overall coping, 0.69 for performance; whereas 0.69 for avoidance coping 0.69 for approach coping. The likely hood odds rations (ORs) were estimated to predict degree of association of occupational stress, coping strategies, length of service with performance of the employees, gender and age differences.
Keywords
Occupational Stress, IT Sector, IARI, Length of Service, Coping, Gender How to cite this paper: Prasad, K. D. V., &
Vaidya, R. (2018). Causes and Effect of Oc-cupational Stress and Coping on Perfor-mance with Special Reference to Length of Service: An Empirical Study Using Multi-nomial Logistic Regression Approach. Psy-chology, 9, 2457-2470.
https://doi.org/10.4236/psych.2018.910141
Received: August 31, 2018 Accepted: September 17, 2018 Published: September 20, 2018
Copyright © 2018 by authors and Scientific Research Publishing Inc. This work is licensed under the Creative Commons Attribution International License (CC BY 4.0).
http://creativecommons.org/licenses/by/4.0/
DOI: 10.4236/psych.2018.910141 2458 Psychology
1. Introduction
Definition of Occupational Stress
In general, the stress is the body’s nonspecific response to a demand placed on it (Selye, 1974). The stress is a condition or feeling experienced when a person perceives that demands exceed the personal and social resources, an individual is able to mobilize (Lazarus, 1966). According to Schuler (1980), stress is a dynam-ic condition in whdynam-ich an individual is confronted with an opportunity, demand, or resource related to what the individual desired and for which the outcome is perceived to be both uncertain and improvement. Occupational stress or job stress is experienced when an employee is poor-fit or misfit with characteristics of his/her work and its environment causing psychological and health strains. Occupational stress can be experienced when the requirements of the assigned job or task are more than the abilities of an employee, and the constraints on available resources to perform the task while interacting with the working con-ditions (Rose & Vega, 1984). Occupational stress is a situation wherein job re-lated components that communicate with an employee to change his/her con-scious mind conditions resulting in an employee moving away from normal functioning (Beehr & Newman, 1978). Work stress is an unpleasant physical and emotional stress response that occurs when there is misfit between demands of the work and capacity and resource requirements of an employee (Sumaneet, 2005).
The occupational stress is predominant in working sector and in particular IT sector and Banking. However recently several studies reported that agricultural research sector of Hyderabad Metro is no exception from the side effects of oc-cupational stress related problems. The low productivity, absenteeism, fatigue, low motivation on instinct to work, dislike in doing and learning new things and in turn effect on employee performance and loss of interest in work are occupa-tional stress (Cooper, 1978; Matteson & Ivancevich, 1987).
Selye (1956), an Austrian Endocrinologist introduced the concept of stress in-to life sciences. The stress is defined as external force or pressure in mechanical sciences (Pestonjee, 1999). The emotional stressors induce the well-being through emotional, cognitive, behavioural and conscious factors (Levi, 1998). The role ambiguity, role overload, role conflict and unfriendly working atmosphere are general causes of the stress (Chand & Sethi, 1997). The nature of work given to an employee is also one of the stress components. The employees who are allo-cated the work interested to him/her will mitigate stress well in comparison with who are assigned uninterested work (Tread Gold, 1999).
2. Review of Literature
compo-DOI: 10.4236/psych.2018.910141 2459 Psychology nents used, in consultation with safety experts for the evaluation of work stress. The instrument developed by using these components had validity, unidimensio-nality and reliability. The results indicated the studied stress components are re-sponsible for work stress among all the categories of employees in these indus-tries. The multinomial logistic regression model used found good fit in predict-ing the work stress in manufacturpredict-ing industries.
Prasad et al. (2016) observed occupational stress factors significantly influen-cing the performance of CBSE affiliated school teachers causing some physio-logical disorders and affecting the performance. The further reported in their multinomial logistic regressions study that demographic variables like gender, age, marital status, children and general health factors like diabetes, hyperten-sion significantly influence the performance.
Prasad et al. (2018) in another study reported statistically significant associa-tion among occupaassocia-tional stress and stress factors like hours/week, job insecurity and social support and their effect on performance.
Suryawanshi et al. (2015), Sateesh Kumar & Madhu (2012), Stephen (2014), Lotfizadeh et al. (2014) studied occupation stress and its factors using multi-nomial logistic regression. Irawanto et al. (2015) applied hierarchical regression analysis to conclude that stressors and occupational stress significantly de-crease the performance of women. This study further reported that demo-graphic variables will have moderating association of stressors and occupa-tional stress with the performance. Awadh et al. (2015) in their case study on effects of workplace stress on employee performance in Kenyan government employees reported a positive correlation between time pressure, long working hours and job demand with performance. The study observed that time pres-sure was major factor contributing to occupational stress and effecting the employee performance.
Therefore, the researchers used multinomial logistic regression to study the components of occupational stress, coping with relation to performance and with a special reference length of service of the employees from IARI and IT sector.
Need for This New Innovation
DOI: 10.4236/psych.2018.910141 2460 Psychology studies carried out even ordinal variables as continuous not knowing whether it right or wrong. In the study research study, the effect on performance caused by occupational stress factors, coping and length of service experienced by the res-pondents in IARI and IT sector were categorized into three levels, low effect, moderate effect and high effect. Therefore, the outcome variable is categorical and has more than two categories. We have used the Statistical Package for So-cial Sciences (SPSS ver 25.0) and the dependent variables stored as nominal va-riables. The multinomial logistic regression is used to predict the nominal de-pendent variable in the study i.e. the effect on performance with occupational stress, approach coping, avoidance coping and the length of service. The multi-nomial logistic regression allows interactions between independent variable to predict the dependent variable.
3. Objectives and Hypotheses
3.1. Research Question
Is the occupational stress, coping is related and length of service related to per-formance of International Agricultural Research Institute (IARI and IT sector employees)?
3.2. Objective and Hypotheses
To study if there is any relation of occupational stress, coping and length of ser-vice on performance in IARI and IT sector employees.
Based on the identified problem, research question and the objectives the fol-lowing hypotheses were formed:
H01: Occupational stress, coping are not related to the Performance of IARI and IT sector employees.
H11: Occupational stress and coping are related to the Performance of IARI and IT sector employees.
H02: Length of service is not related to IARI and IT sector employees. H12: Length of service is related to IARI and IT sector employees.
4. Research Methodology
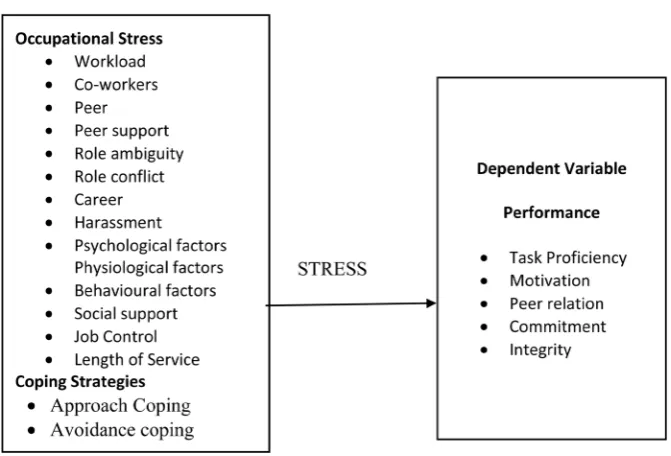
Conceptual Framework: The proposed framework was adopted based on out-comes of the research studies by Selye (1980), and Prasad et al. (2015, 2016, 2018). The 14 independent stress causing factors, workload, co-workers, peer support, role ambiguity, role conflict, career, harassment, psychological factors, physiological factors, behavioural factors, social support and Job control, coping strategies approach and avoidance coping strategies on depending factors Per-formance of IARI and IT sector employees. The conceptual framework for oc-cupational stress, coping and performance is provided in Figure 1.
4.1. Determination of Sample Size
DOI: 10.4236/psych.2018.910141 2461 Psychology Figure 1. Conceptual frame work: occupational stress vs performance.
2
0 2
z pq n
e
=
where no is the sample size, z is the selected critical value of desired confidence level, p is the estimated proportion of an attribute that is present in the popula-tion, q 1 p and e is the desired level of precision was used to determine the sam-ple size as the total population size is not known for IARI and IT sector where population is infinite, assuming the maximum variability which is equal to 50% (p = 0.5) and taking 95% confidence level with ±5% precision, the required sam-ple size is
p = 0.5 and hence q = 1 − 0.5 = 0.5; e = 0.05 and z = 1.96
(
) ( )( )
(
)
2
0 2
1.96 0.5 0.5
384.16 384 0.05
n = = =
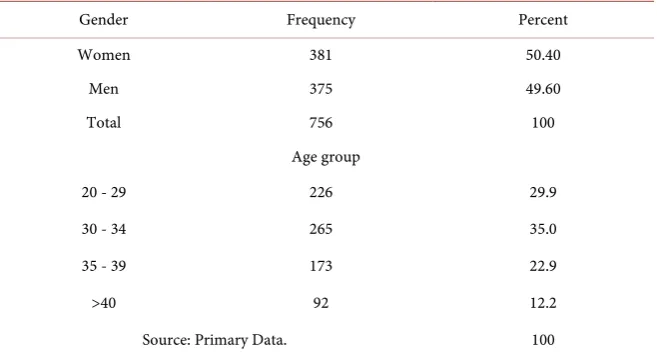
A sample size of 756 was selected using simple random sample sampling where each member of the subset has an equal probability of being chosen and data from 850 respondents was used for the analysis. The demography of sample presented in Table 1.
DOI: 10.4236/psych.2018.910141 2462 Psychology Table 1. Demography of sample: frequencies of gender and age groups in the sample.
Gender Frequency Percent
Women 381 50.40
Men 375 49.60
Total 756 100
Age group
20 - 29 226 29.9
30 - 34 265 35.0
35 - 39 173 22.9
>40 92 12.2
Source: Primary Data. 100
3) The coping strategies scale based on by Srivastava (2001) has 34 statements describing the factors Approach and Avoidance copings using a Likert-type scale with 5 (Almost Always) and 1 (Never) are main source for the primary data col-lection. The questionnaire was divided into 2 sections—in the Section I, Demo-graphic variables like age, sex, number of years of experience, qualifications and other background information/personal details of the respondent were collected. The Section II of questionnaire was used to find out the stress levels of the em-ployees, coping strategies, and impact of the stress, length of service on perfor-mance and IARI and IT sector employees. To measure each factor, a range of 4 - 6 statements were given but all these questions were mixed systematically.
4.2. Brief Description of the Questionnaire
The questionnaire was prepared to collect the data of the research variables were both demographic and psychographic in nature. Personal statistics that include information on gender, age group, education details, and marital status are the demographic variables used in this study. The associated occupational stress and psychographic variables studied are: occupational stress, coping (studied as avoidance coping and approach coping) and performance. The data was col-lected in the form the questions (Experience in years) and the groups are 1 - 5, years, 6 - 10 years 11 - 15 years, and >15 years. The dichotomous variables (YES/NO) using the statements like “Have you experienced occupational stress” (YES/NO); “Did stress effect your performance?” YES/NO and so on.
Data Analysis:The descriptive statistical analysis, reliability statistics, multi-nomial logistic regression analysis was carried out to analyze the data for draw-ing inferences from our research data. To assess the data normality Shapi-ro-Wilk test was carried out and for this approximately normally distributed da-ta p = 0.3262 indicating normally distribution of data.
reliabil-DOI: 10.4236/psych.2018.910141 2463 Psychology ity statistic split-half co-efficient Spearman-Brown formula (Cronbach, 1951; William Trochim, 2006) and subsequently elaborated by others (Novick & Lew-is, 1967; Kaiser & Michael, 1975). The estimated values of the Cronbach’s alpha are indicated in Table 2. The Statistical Package for Social Sciences (SPSS ver. 25) was used to analyze descriptive statistic and dispersions. To predict the de-pendent factor based on indede-pendent factors the multinomial logistic regression analysis carried out (IBM Corp., 2017).
Reliability test of the Questionnaire:The outcome of the survey was meas-ured using a Likert-type scale with items 1 - 5 for all the questionnaires. In case of performance a 9 point Likert type scale was used (+4 to −4) was converted to a 5 point scale for ease of calculation and analysis. The reliability statistic Cron-bach’s alpha coefficient value (C-alpha) was calculated to measures the internal consistency of the instrument in totality (Gay, Mills, & Airasian, 2009). A brief pilot study was used to test the instrument using the data of 100 employees and using SPSS ver 25.
The reliability statistics values are: The overall C-alpha for the study is 0.92; for occupational stress over all is 0.91; coping over all is 0.92 and approach cop-ing is 0.69 and avoidance copcop-ing is 0.69. The second reliability statistics were split-half (odd even) correlation is 0.81; spearman brown prophecy is 0.89 indi-cating a strong internal consistency and reliability of the survey instrument. The reliability statistics are presented in Table 2.
The Mean, Standard Deviation in mean responders on factor scale for all the 14 stress causing independent factors and dependent factor Performance and es-timated and presented in Table 4. The overall mean and standard deviation was estimated from the responses. The overall mean was 3.08 and standard deviation was 0.37. Based on this Occupational stress score for Low, Medium and High stress determined (Table 3 & Table 4).
[image:7.595.209.539.609.709.2]For a symmetric distribution, the expected range will be 6 times of standard deviation (σ) and better approximation makes it a normal distribution. For this study range is in near normal distribution and is nearly equal to the 6 times of standard deviation (Francis, 2008; Annamalai & Nandagopal, 2014). The occu-pational study questionnaire consists has 59 questions, with 14 questions are re-verse keyed and values ranging 1 and 5, therefore, the minimum range 59
Table 2. Cronbach’s alpha values for factors used in this study.
Sl. No Factor Cronbach’s alpha
1 Overall C-alpha 0.92
2 Occupational Stress overall 0.91
3 Coping overall 0.92
4 Approach coping 0.69
5 Avoidance coping 0.69
DOI: 10.4236/psych.2018.910141 2464 Psychology Table 3. Mean and standard deviation of occupational stress factors, psychological well-being and performance.
Factor Mean X (Overall) Standard Deviation
Occupational stress 3.08 σ = 0.37
Approach coping 3.17 0.30
Avoidance coping 2.80 0.32
Performance 3.30 0.31
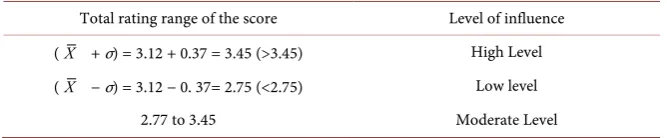
Table 4.Rating of the score for occupational stress.
Total rating range of the score Level of influence (X + σ) = 3.12 + 0.37 = 3.45 (>3.45) High Level (X − σ) = 3.12 − 0. 37= 2.75 (<2.75) Low level
2.77 to 3.45 Moderate Level
(1 × 59) and the maximum range value is 295 (5 × 59) the range is the difference between minimum and maximum values—236 for 59 questions. The overall range 236 is near to the 6 time standard deviation (0.39).
From the above Mean, the standard deviation is added and the maximum ceiling for the higher stress is set. The difference between mean and standard deviations calculated to find out the minimum ceiling for low level of occupa-tional stress. The level between minimum and maximum is set as medium oc-cupational stress level (Prasad et al., 2016, 2018).
5. Results
To assess the occupational stress, approach coping, avoidance coping, and length of service effect on the dependent factors Performance, multinomial regression analysis was carried out. The model also will predict the probabilities of the in-fluence of occupational stress, approach and avoidance coping, and length of service on dependent factors performance.
In the proposed study, the effect on performance and caused by the occupa-tional stress factors, coping and length of service for IARI and IT sector em-ployees were categorized into three levels Low effect, Moderate Effect and High effect. Thus the outcome variable is in categorical more than 2 categories. In SPSS system these dependent variables need to be stored as nominal variables. The multinomial logistic regression is used to predict a nominal dependent va-riable in the study i.e. the effect on performance with occupational stress, ap-proach and avoidance coping and length of service. The multinomial logistic re-gression allows interactions between independent variables to predict the de-pendent variable.
[image:8.595.208.542.219.288.2]inde-DOI: 10.4236/psych.2018.910141 2465 Psychology pendent variables was explained in the relative log odd ratios (OR or Exp(ß)). The results indicated that independent variable occupational stress is the pre-dictor of performance and IARI and IT sector employees experiencing more stress from occupational stress, when compared with Low effect on performance keeping High effect of performance as reference variable. The results are pre-sented in the following section.
From the model fitting table indicates that final model is significantly pre-dicting the outcome variable than intercept only model (Table 5).
The parameter of the chi-square distribution used to test the null hypothesis is defined by the degrees of freedom in the prior column. Pearson chi-square (p-548) and Deviance (p = 0.520) assess the goodness of fit of the model and the model with four predictor variables indicates a good fit to the data (Table 6).
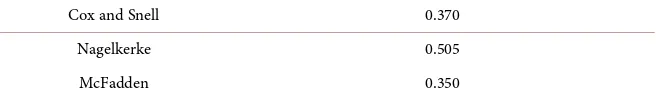
The Nagelkerke R-square indicates that 50.5% of the total variations in stress level occurred due to the variations among the three predictor variables (Table 7). However, these are not equivalent to R squares in Ordinary Linear Regression.
The −2 Log likelihood or reduced are indicated in Table 8 and the results it can be observed that all the three predictor values, occupational stress, approach coping, avoidance coping and length of service are significantly contributing meaningful to the to the model.
[image:9.595.208.540.484.552.2]A Multinomial Logistic Regression was used to analyse the predictors on un-ordered group classification like low effect, moderate effect and high effect in terms of performance. The reference category for the outcome variable was High Effect and other two categories Low Effect and Moderate Effect were compared to this group. The first column of the Table 9 is Low effect (referring to Perfor-mance Effect) was compared to reference category High Effect. From the results
Table 5. Model fitting information to predict the performance levels.
Model Model Fitting Criteria Likelihood Ratio Tests
−2 Log Likelihood Chi-Square df Sig.
Intercept Only 996.525
[image:9.595.208.538.584.634.2]Final 647.695 348.829 12 0.000
Table 6. Goodness-of-fit statistics.
Chi-Square df Sig.
Pearson 6230.712 194 0.548
Deviance 647.695 194 0.520
Table 7. Effect of size to test the strength of the model pseudo R-Square.
Cox and Snell 0.370
Nagelkerke 0.505
[image:9.595.211.539.668.718.2]DOI: 10.4236/psych.2018.910141 2466 Psychology Table 8. Likelihood ratio test: performance with stress, coping levels and length of ser-vice.
Effect
Model Fitting Criteria Likelihood Ratio Tests −2 Log Likelihood of
Reduced Model Chi-Square df Sig.
Intercept 647.695a 0.000 0 .
Occupational Stress 889.571 241.875 2 0.000
Approach Coping 744.276 96.580 2 0.000
Avoidance Coping 668.059 20.364 2 0.000
Length of Service 778.347 130.651 6 0.000
The chi-square statistic is the difference in −2 log-likelihoods between the final model and a reduced model. The reduced model is formed by omitting an effect from the final model. The null hypothesis is that all pa-rameters of that effect are 0. a. This reduced model is equivalent to the final model because omitting the ef-fect does not increase the degrees of freedom.
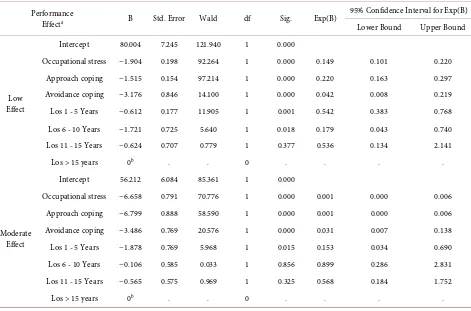
Table 9. Parameter estimates to predict performance with occupational stress, approach coping, avoidance coping and length of service.
Performance
Effecta B Std. Error Wald df Sig. Exp(B)
95% Confidence Interval for Exp(B) Lower Bound Upper Bound
Low Effect
Intercept 80.004 7.245 121.940 1 0.000
Occupational stress −1.904 0.198 92.264 1 0.000 0.149 0.101 0.220
Approach coping −1.515 0.154 97.214 1 0.000 0.220 0.163 0.297
Avoidance coping −3.176 0.846 14.100 1 0.000 0.042 0.008 0.219
Los 1 - 5 Years −0.612 0.177 11.905 1 0.001 0.542 0.383 0.768
Los 6 - 10 Years −1.721 0.725 5.640 1 0.018 0.179 0.043 0.740
Los 11 - 15 Years −0.624 0.707 0.779 1 0.377 0.536 0.134 2.141
Los > 15 years 0b . . 0 . . . .
Moderate Effect
Intercept 56.212 6.084 85.361 1 0.000
Occupational stress −6.658 0.791 70.776 1 0.000 0.001 0.000 0.006
Approach coping −6.799 0.888 58.590 1 0.000 0.001 0.000 0.006
Avoidance coping −3.486 0.769 20.576 1 0.000 0.031 0.007 0.138
Los 1 - 5 Years −1.878 0.769 5.968 1 0.015 0.153 0.034 0.690
Los 6 - 10 Years −0.106 0.585 0.033 1 0.856 0.899 0.286 2.831
Los 11 - 15 Years −0.565 0.575 0.969 1 0.325 0.568 0.184 1.752
Los > 15 years 0b . . 0 . . . .
a. The reference category is: High Effect; b. This parameter is set to zero because it is redundant.
[image:10.595.66.537.315.626.2]DOI: 10.4236/psych.2018.910141 2467 Psychology comparing low effect with High effect the odds of length of service 1 - 5 years for each year increase in service effecting the performance is 0.174 times (95%, CI 0.043 - 0.740, p < 0.05), When comparing Moderate effect group with High ef-fect group the odd ratio or logistic coefficient (ß) 0.031 indicates that one unit decrease avoidance coping the odds of decreasing the performance is 0.031 times (95%, CI 0.007 - 0.138). The length of service 11 - 15 service not a good predictor of the performance and occupational stress, approach coping and avoidance coping are good predictors of the performance. Most of the Odds ratios are (OR < 1) for predictors indicating a moderate level of influence in the model effecting the performance at moderate level. When comparing length of service with low effect with High effect group the length of service is a good predictor of the per-formance.
Therefore, we reject the null hypothesis and accept the alternate hypothesis: H11: Occupational stress and coping are related to the IARI and IT sector em-ployees. However the length of service is the predictor for performance and par-tially accept.
H12: Length of service is related to IARI and IT sector employees.
6. Discussion
The primary data gathered to structured questionnaire with 113 questions which were sub-divided into 16 factors based on their characteristic grouped as stress causing factors, coping factors, length of service and performance. These find-ings include the two boundaries of the Likert scale given in the analysis i.e. strongly disagree and strongly agree. The results supported the outcome of a similar study conducted by Prasad et al. (2016, 2018), Yahaya et al. (2010), An-namalai & Nandagopal (2014). Survey research will have some deficits related to its use as these are self-reported instruments and sometimes may not be com-plete and reliable. The assumed shortcomings may be, once the researcher sub-mits questionnaire to the respondent, the researcher has no idea whether res-pondent himself/herself provided the responses are not. The another shortcom-ing is, even though utmost care was taken and brief introduction as provided about the study, there is a chance the respondent may misunderstand the ques-tion/statement. This researcher has mitigated this problem with inserting reverse keyed questions, where appropriate. Further, a strong internal consistency of the instrument was confirmed by both Cronbach’s alpha and Spearman-Brown split-half reliable static at overall and at independent level using ordinal data.
7. Conclusion
DOI: 10.4236/psych.2018.910141 2468 Psychology women use approach coping strategies for long-term benefits. Some of the sug-gestions will improve employee performance in IARI and IT sector employees, which is job redesign, Flexible hour employment, interpersonal relations, social support and crèche services. Management should concentrate to have sessions on physical exercises and medication to improve the well-being of employees.
Conflicts of Interest
The authors declare no conflicts of interest regarding the publication of this pa-per.
References
Annamali, S., & Nandagopal, R. (2014). Occupational Stress: A Study of Employee Stress in Indian ITES Industry (p. 165). New Delhi: Allied Publishers.
Awadh, I. M., Gichinga, L., & Ahmed, A. H. (2015). Effects of Workplace Stress on Em-ployee Performance in the County Governments in Kenya: A Case Study of Kilifi County Government. International Journal of Scientific and Research Publications, 5, 1-8.
Beehr, T. A., & Newman, J. E. (1978). Job Stress, Employee Health and Organizational Effectiveness: A Facet Analysis, Model and Literature Review. Personnel Psychology, 31, 665-699. https://doi.org/10.1111/j.1744-6570.1978.tb02118.x
Campbell, C. H., Ford, P., Rumsey, M. G., & Pulakos, E. D. (1990). Development of Mul-tiple Job Performance Measures in a Representative Sample of Jobs. Personnel Psy-chology, 43, 277-300. https://doi.org/10.1111/j.1744-6570.1990.tb01559.x
Chand, P., & Sethi, P. S. (1997). Organizational Factors in the Development of Work Stress. Indian Journal of Industrial Relations, 32, 457-460.
Cochran, W. G. (1977). Sampling Techniques (3rd ed.). New York: Wiley.
Cooper, C. L. (1978). Sources of Managerial and White Collar Stress. Stress at Work, 56-81.
Cronbach, L. (1951). Coefficient Alpha and Internal Structure of Tests. Psychometrika, 16, 297-334. https://doi.org/10.1007/BF02310555
Francis, A. (2008). Business Mathematics and Statistics (6th ed.). Bedford Row, London: South Western Cengage Learning EMEA, High Holborn House.
Gay, L. R., Mills, G. E., & Airasian, P. W. (2009). Educational Research: Competencies for Analysis and Research. Student Value Edition. Upper Saddle River, NJ: Merrill.. IBM Corp (2017). IBM SPSS Statistics for Windows, Version 25.0. Armonk, NY: IBM
Corp.
Irawanto, D. W., Noermiyati, & Primasari, D. (2015). The Effect of Occupational Stress on Work Performance of Female Employees: Study in Indonesia. Asia-Pacific Journal of Management Research and Innovation, 11, 336-345.
Kaiser, H. F., & Michael, W. B. (1975). Domain Validity and Generalizability. Educational and Psychological Measurement, 35, 31-35.
https://doi.org/10.1177/001316447503500103
Lazarus, R. S. (1966). Psychological Stress and Coping Process. New York: McGraw Hill. Levi, L. (1998). Preface: Stress in Organizations Theoretical and Empirical Approaches.
DOI: 10.4236/psych.2018.910141 2469 Psychology
Collar Employees in Esfahan Steel Company, Iran. Malaysian Journal of Public Health Medicine 14, 79-81.
Matteson, M. T., & Ivancevich, J. M. (1987). Controlling Work Stress: Effective Human Resource and Management Strategies. San Francisco: Jossey Bass.
Novick, M. R., & Lewis, C. (1967). Coefficient Alpha and the Re3liability of Composite Measurements. Psychometrika, 32, 1-13. https://doi.org/10.1007/BF02289400
Pestonjee, D. M. (1999). Stress and Coping: The Indian Experience (2nd ed., pp. 216-229). New Delhi: Sage Publications.
Prasad, K. D. V., Vaidya, R., & Anil Kumar, V. (2015). A Study on Causes of Stress among the Employees and Its Effect on the Employee Performance at the Workplace in an International Agricultural Research Institute, Hyderabad, Telangana, India. Inter-national Journal of Management Research and Business Strategy, 4, 68-82.
Prasad, K. D. V., Vaidya, R., & Anil Kumar, V. (2016). Teacher’s Performance as a Func-tion of OccupaFunc-tional Stress and Coping with Reference to CBSE Affiliated School Teachers in and around Hyderabad: A Multinomial Regression Approach. Psychology, 7, 1700-1718. https://doi.org/10.4236/psych.2016.713160
Prasad, K. D. V., Vaidya, R., & Anil Kumar, V. (2018). Association among Occupational Stress Factors and Performance at Workplace among Agricultural Research Sector Employees at Hyderabad, India. Pacific Business Review International, 10, 27-36. Rose, J. L., & Vega, J. F. (1984). Assessing the Sustained Effects of a Stress Management
on Anxiety and Locus of Control. Academy of Management Journal, 27, 190-198. Sateesh Kumar, K., & Madhu, G. (2012). Analysis and Multinomial Logistic Regression
Modelling Work Stress in Manufacturing Industries in Kerala, India. International Journal of Advances in Engineering & Technology, 2, 410-418.
Schuler, R. S. (1980). Definition and Conceptualization of Stress in Organizations. Orga-nizational Behavior and Human Performance, 25, 184-215.
https://doi.org/10.1016/0030-5073(80)90063-X
Selye, H. (1956). The General Adaptation Syndrome and the Diseases of Adaptation.
Journal of Clinical Endocrinology, 2, 117-230. Selye, H. (1974). Stress without Distress. New York, 26-39.
Selye, H. (1980). Stress, Aging and Retirement. Journal of Mind and Behaviour, 1, 93-110. Srivastava, A. K. (2001). Coping Strategy Scale. Varanasi: Rupa Psychological Centre. Srivastava, A. K., & Singh, A. P. (1984). The Occupational Stress Index. Varanasi:
Mana-vaigyanic Parikshan Sansthan.
Stephen, E. B. (2014). Occupational Stress and Coping Strategies among Female Em-ployee of Commercial Banks in Nigeria. International Journal of Scientific Research and Management, 2, 1417-1430.
Sumaneet (2005). Job Stress in Business Organisations: Causes, Consequences, and Cop-ing Strategies. Indian Journal of Training and Development, 35, 84-92.
Suryawanshi, A., Savasani, M., & Shah, J. A. (2015). A Study of Stress Level of Married Men and Women Using Multinomial Logistic Regression. International Journal of Scientific Research Publications, 5, 1-8.
Tread Gold, R. (1999). Transcendent Occasions: Their Relationship to Stress, Depression and Clarify of Self Concept. Journal of Humanistic Psychology, 39, 81-105.
https://doi.org/10.1177/0022167899391010
DOI: 10.4236/psych.2018.910141 2470 Psychology http://www.socialresearchmethods.net/kb/reltypes.php