warwick.ac.uk/lib-publications
A Thesis Submitted for the Degree of PhD at the University of Warwick
Permanent WRAP URL:
http://wrap.warwick.ac.uk/98790/
Copyright and reuse:
This thesis is made available online and is protected by original copyright. Please scroll down to view the document itself.
Please refer to the repository record for this item for information to help you to cite it. Our policy information is available from the repository home page.
Simulation of High Strain Rate
Deformation in Structural Polymeric
Foam: Innovation Report
by
Craig Robert Carnegie
A thesis submitted in partial fulfilment of the requirements for
the degree of Doctor of Engineering
University of Warwick, WMG
i
Declaration
This Innovation Report is submitted to the University of Warwick in support of my application for the degree of Doctor of Engineering. It has been composed by myself and has not been submitted in any previous application for any degree.
ii
Acknowledgements
Academic Mentors: Professor Richard Dashwood, Dr Richard Beaumont and Professor Darren Hughes
Industrial Mentor: Dr Mark Blagdon
Funding Body: EPSRC and Jaguar Land Rover
Firstly I would like to thank the University of Warwick, EPSRC and Jaguar Land Rover for supporting this project, in particular Professor Richard Dashwood for giving me the opportunity and Professor Darren Hughes for taking up the reins toward the end. Both of which helped guide the project into the portfolio it has become. A thanks also goes to Dr Mark Blagdon for providing an insight into Jaguar Land Rover and helping to identify areas of improvement.
A very special thanks goes to my supervisor Richard Beaumont (“The confusion is there to guide you”) who took on the role exceptionally well and has been approachable and considerate throughout. To the people that made the experience a fun one; Sanjeev Sharma, Scott Taylor, Elspeth Keating and Neill Wrath. To Dave Williams for taking an interest and having my back.
iii
Abstract
Passenger safety within vehicles is a priority for automotive companies in order to meet both the regulations and customer expectations. The safety critical materials, those used for absorbing energy during a crash, are simulated with FEA in order to design and improve components and to reduce the requirement for physical testing, which in turn saves on development time and cost.
The simulation capabilities of Jaguar Land Rover were identified as lacking in accuracy for energy absorbing materials. Quasi-static and dynamic testing of expanded polypropylene as coupon samples and vehicle components was carried out to assess their stress-strain responses, energy absorption capabilities and strain rate effects. Using the properties within FEA the mechanical behaviour of the material was predicted and validated against the physical testing. Updated material models were implemented back into Jaguar Land Rover that fully incorporate strain rate effects and contain reliable, traceable input data. The material models require stress-strain curves, density, material modulus and un-loading characteristics.
A test methodology has been implemented into Jaguar Land Rover for characterising energy absorbing materials, something that was previously unavailable. This includes the use of three machines, a low strain rate Instron 5800R, a high strain rate Drop Tower and a Very High Strain rate (VHS) testing rig; each used to understand the effect of compression testing at a range of strain rates and under decelerating/constant velocity impact conditions.
Energy absorbing materials were sourced from two foam manufacturers. It was shown that different manufacturer’s material performed differently, even when supplied to the same requirement and manufactured from the same precursor. Computed tomography under synchrotron radiation was utilised to inspect material differences, identifying possible causes for stress-strain changes under compression. From the images a 3D mesostructural model was created to predict the material performance during deformation.
As a result Jaguar Land Rover procedures were changed, increasing FEA capabilities and increasing the utilisation of foam within the vehicle. New test procedures were implemented for characterising future energy absorbing materials.
iv
Table of Contents
1 Introduction to Energy Absorbing Materials in the Automotive Industry, Objectives
of the Project and Portfolio Layout ... 1
1.1 Project Specification and Objectives ... 1
1.2 Research Question ... 2
1.3 Innovation Summary ... 3
1.4 Contribution to Knowledge... 4
1.5 Portfolio Layout ... 5
1.6 Structure of the Innovation Report ... 6
2 Literature Review: Characterisation, Testing and Simulation of Energy Absorbing Materials (Submission One) ... 7
2.1 Material Characterisation and Selection ... 7
2.1.1 Sample Orientation... 9
2.1.2 Density Distribution ... 9
2.1.3 Sample Preparation ... 10
2.2 Analytical Solutions for Predicting Material Performance ... 10
2.3 Test Methods and Strain Rate Effects ... 13
2.3.1 Strain Rate Effects ... 13
2.4 Simulation: Selection of Material Models ... 16
2.4.1 Continuum Modelling ... 16
2.4.2 3D Mesostructural Modelling ... 18
2.5 Review of Current Practices within Jaguar Land Rover ... 19
2.5.1 Testing ... 19
2.5.2 Simulation ... 19
v 3 Simulation of Expanded Polypropylene: The Review and Improvement of JLR
Practices (Submission Two) ... 22
3.1 Review of Previous Methodologies ... 22
3.2 Model Creation and Recommended Simulation Methods ... 24
3.2.1 Element Formulation and Mesh Size ... 25
3.2.2 Surface Contacts ... 26
3.3 Selection of Material Models ... 27
3.4 Manufacturers of EPP and Supplier to JLR ... 27
3.4.1 EUEPP ... 27
3.4.2 UKEPP ... 28
3.5 Incorporating a Material Dataset: EUEPP Drop Tower ... 28
3.6 Validation of Material Models ... 30
3.6.1 Quantifying a Vehicles Safety ... 35
3.7 Summary ... 37
4 Geometry Investigation: Stress-Strain Response of Expanded Polypropylene, Strain Rate Effect and Production Variation (Submission Three) ... 39
4.1 Material Selection and Sample Preparation ... 40
4.2 Test Methodologies: Strain Rate Sensitivity Investigation ... 41
4.2.1 Quasi-Static Compression Test Methodology ... 43
4.2.2 Drop Tower Test Methodology ... 45
4.2.3 VHS Test Methodology ... 47
4.3 Procedures for Data Processing ... 49
4.4 Test Specification Comparison... 51
4.5 EUEPP Dataset Validation ... 54
4.6 Material Performance across Manufacturers ... 55
vi
4.7 Final Review of Material Models with Validation ... 60
4.7.1 Strain Distribution using Digital Image Correlation ... 62
4.8 Effect of Production Methods ... 64
4.8.1 Density Distribution ... 65
4.8.2 Exterior Skin Layer ... 68
4.8.3 Multiple Layers of Material ... 68
4.8.4 Sample Size ... 71
4.9 Summary ... 72
5 Micromechanics of Expanded Polypropylene: Computed Tomography and 3D Simulation (Submission Four) ... 75
5.1 Internal Structure of EPP ... 75
5.1.1 Predicting the Effect of Material Distribution ... 76
5.2 Computed Tomography at WMG ... 77
5.3 International Placement: ESRF (Submission Five) ... 79
5.4 X-Ray Technology and its Utilisation ... 80
5.5 Experimental Procedure for the use of Synchrotron Radiation ... 81
5.6 Differences between Manufacturers Foam ... 82
5.7 In-situ Compression of Foam ... 84
5.8 3D Mesostructural Simulation ... 87
5.9 Summary ... 90
6 Review of Research Impact ... 92
6.1 Research within Submissions ... 92
6.2 Informative Documentation ... 92
6.3 Material Testing and Database ... 93
6.3.1 Test Methodology... 93
vii
6.4 Simulation of Foam ... 94
6.4.1 LS-DYNA models ... 94
6.4.2 Material Models for Simulation ... 95
6.5 Spreadsheet for Data Extrapolation ... 95
6.6 Additional Contributions outside of Jaguar Land Rover ... 95
6.6.1 ESRF User Documentation ... 96
6.6.2 EUEPP Data validation ... 96
7 Conclusions and Recommendations ... 97
7.1 Characterisation ... 98
7.2 Simulation ... 99
7.3 Material Testing ... 101
7.4 EPP Microstructure ... 103
7.5 Summary of Key Achievements and Contributions to Innovation ... 105
7.6 Further Work... 107
7.6.1 Material characterisation ... 107
7.6.2 Utilising EPP ... 107
7.6.3 Material Testing ... 108
7.6.4 Production ... 108
7.6.5 Simulation ... 109
7.6.6 Computed Tomography ... 109
7.6.7 Review for Jaguar Land Rover ... 110
viii
Table of Figures
Figure 1: Typical stress-strain curve for polymer foam (Goga 2010) ... 7
Figure 2: a) Open Cell Foam and b) Closed Cell Foam (Goga 2010) ... 8
Figure 3: Cell collapse mechanics. a) Free body diagram with failure mechanics of b) buckling, c) yielding and d) fracture (Ashby 2006) ... 10
Figure 4: Stress–strain curves for two different EPP foam microstructures. (Bouix et al 2009) ... 14
Figure 5: Foam Characterisation Equipment. a) Testing fixture and b) Foam dimensions ... 19
Figure 6: Stress - strain response for a sample of 170 kg.m-3 EPP compared to the two material models that represent it within JLR. Showing the use of a ramped value for stability ... 24
Figure 7: Cube Validation Model within LS-DYNA ... 25
Figure 8: Simulation output with varied FEA Elements ... 26
Figure 9: Original material card data compared to quasi-static and drop tower testing for 60 kg.m-3 EPP. Circles indicate areas of missing curve accuracy for EPPFOAM60 ... 29
Figure 10: a) JLR's drop tower configuration and b) LS-DYNA Simulation ... 31
Figure 11: Component Testing carried out by JLR Compared to their original material inputs for simulation titled “ARPRO” ... 31
Figure 12: Component Testing carried out by JLR Compared to their original material inputs for simulation titled “EPPFOAM” ... 32
Figure 13: Replacement Material input used in the validation simulation ... 33
Figure 14: Simulation of Head Impact block using most recent Material 83 input ... 34
Figure 15: Cross section of a full vehicle model for HIC analysis ... 35
Figure 16: Block location within a Land Rover vehicle ... 35
Figure 17: Comparison between a) original, b) new MAT_57 and c) new MAT_83 material definitions against the HIC test ... 36
Figure 18: Instron 5800R Compression Rig ... 43
Figure 19: Velocity Profile of a 200 mm.min-1 compression test on the Instron 5800R 43 Figure 20: Compression plates for the 5800R testing rig ... 44
xii
Table of Tables
Table 1: Portfolio submissions and subchapters therein ... 5
Table 2: Original Material Input Data for Simulation of Expanded Polypropylene... 23
Table 3: Data Acquired from EUEPP of their EPP analysis ... 30
Table 4: Residual error comparison between iterations of material models ... 34
Table 5: Material Specifications for Testing ... 40
Table 6: 5800R Machine Specification ... 44
Table 7: 5800R Sample Preparation ... 44
Table 8: 5800R Test Setup ... 44
Table 9: Drop Tower Machine Specification ... 45
Table 10: Drop Tower Sample Preparation ... 46
Table 11: Drop Tower Test Setup ... 46
Table 12: VHS Machine Specification (Compression)... 47
Table 13: VHS Sample Preparation ... 48
Table 14: VHS Test Setup ... 48
Table 15: Specifications for an investigation into the effect of stacked material ... 69
Table 16: Comparison between contributing foam features with different fractions of material within cell edges ... 76
xiii
List of Abbreviations
CAE - Computer Aided Engineering
DIC - Digital Image Correlation
EPP - Expanded Polypropylene
ESRF - European Synchrotron Radiation Facility
FEA - Finite Element Analysis
HIC - Head Injury Criterion
JLR - Jaguar Land Rover
MAT_57 - LS-DYNA Material Model: Low Density Foam
MAT_83 - LS-DYNA Material Model: Fu Chang Foam
MAT_63 - LS-DYNA Material Model: Isotropic Crushable Foam
MAT_75 - LS-DYNA Material Model: Bilkhu/Dubois Foam
PU - Polyurethane
PUR - Rigid Polyurethane
VHS - Very High Strain Rate
µCT - Micro Computed Tomography
1
1
Introduction to Energy Absorbing Materials in the Automotive
Industry, Objectives of the Project and Portfolio Layout
This project is centred on the safety of passengers within automotive vehicles. Using energy absorbing materials to decelerate and protect an occupant during a crash is paramount to road safety. Through evaluating and understanding the material it is possible to develop their use within the automotive industry. High strain rate deformation is the dominant load case experienced during said crash; the simulation of which must be accurate and robust in order to both improve predictability and reduce physical testing required to validate their use. Improving the fidelity of simulation is therefore the goal of this investigation.
This document is an executive summary of the work that has progressed the topic. The project was broken down into sections; a review of previous investigations into energy absorbing materials, the physical response of these materials at a range of strain rates, the use of simulation within an automotive company to replicate them and finally the microstructural features that contribute to their mechanical behaviour. Each area of focus is supported by a primary document that evaluates it in detail; the executive summary will highlight the key methodologies and findings from them with references to further discussions where required.
1.1
Project Specification and Objectives
2 The JLR CAE (Computer Aided Engineering) foam database had last been updated in 2006 and required both validation and rework where issues were identified. Issues included the traceability of the data in order to prevent problems arising in the future, inaccurate models that lead to incorrect responses and therefore the unsafe design of components.
The following tasks were identified at the onset in collaboration with JLR and were used to define the EngD project.
Research and deliver improved material characterisation and CAE techniques for simulating the behaviour of energy absorbing foams when subjected to high deflection, dynamic loading, specifically those that occur during vehicle crash events.
Understand JLRs current foam material usage and functionality, CAE methodology and foam material models.
Understand the important characteristics of current foams and identify weaknesses in current CAE methods. Investigate processing and environmental variability.
Using DYNA CAE code, improve current modelling methods and develop a correlation test to validate improvements.
1.2
Research Question
The proposal to investigate the accuracy of polymer foam simulation requires the full characterisation of the material. This includes differences between cell structures, density change caused by manufacturing methods, the stress-strain responses that arise from said differences and the effect a wide range of test conditions has on them.
3 Focus was put on the polymer foam expanded polypropylene (EPP), due it its energy absorption properties, as well as its ability to undergo hysteresis. JLR currently use EPP within their vehicles, so a supply chain is already in place. The material densities that were used within this project range from 20 to 170 kg.m-3.
The following areas were investigated:
Importance of the accuracy of the foam stress-strain behaviour used during simulation
Compression mechanisms of the foams
Internal Structure of polymeric foam and its influence on energy absorption
High strain rate deformation and simulation of coupons and components
Throughout the investigation the following questions were considered in order to achieve the objectives discussed above.
How does a foam absorb energy during compression
Is the material strain rate sensitive and how does the strain rate affect its ability to absorb energy
What is the effect of a decelerating mass and a constant velocity impact on foamed material deformation
Does the manufacturing process change the foam performance
Do suppliers achieve the same performance, based on the density that is specified
Which material model best represents the polymer foam within CAE
What is the distribution of mass within a sample as the density is increased
Can a 3D mesostructural model be used to predict the compressive behaviour of a material
1.3
Innovation Summary
4 information for JLR on the manufacturing methods and consequent structural responses. It also showcases where investigations have taken place into the material, highlighting where their research can be directed.
New test methodologies for characterising energy absorbing materials have been developed; this includes a range of strain rate machines tested using different load cases. The methodologies were used to investigate the effect of compression testing on EPP. JLR can use both the test procedure and datasets to characterise new materials in the future and benchmark against them.
Using the datasets a full consolidation of EPP material models for simulation were provided, incorporating features that were previously missing, such as strain rate effects. The validated simulation methodology that represents them will provide the information for creating new geometric and material models in the future.
The original simulation methodology was poor, the development of an updated methodology significantly improved the accuracy of simulation, with a residual error reduction of 93 %.
The full process has been documented, from test design, experimentation, post-processing, validation and implementation. They represent guidelines for accurate and robust simulations which promotes occupant safety within JLR vehicles.
JLR run their simulations using the material models developed and analysed within this report. A recent system within their database allows them to access the models easily and remotely. This ensures each employee is sourcing their data from the same location and increases the reliability of their results.
1.4
Contribution to Knowledge
5 Polypropylene using synchrotron radiation. Analysis of the compression mechanisms under quasi-static compression has been presented.
An in depth analysis of two LS-DYNA material models
(MAT_LOW_DENSITY_FOAM_57/MAT_57 and MAT_FU_CHANG_FOAM_83/MAT_83) for simulating Expanded Polypropylene has been conducted. Original validation tests were used to correlate the material data to its simulated counterpart.
A comparison between the deceleration of the typical drop tower testing and the constant velocity compression on the VHS machine for a number of material variations has been conducted. Experimental work includes density change, sample size and strain rate effects.
Two suppliers of EPP to the automotive industry have had their foams compared under a range of test conditions; including dynamic testing and µCT analysis. The change in material performance has been related to analytical solutions used to predict their performance.
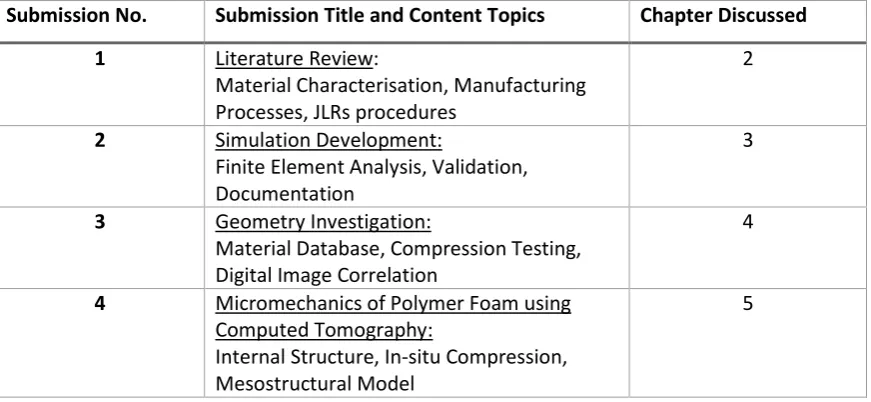
[image:20.595.82.518.553.754.2]1.5
Portfolio Layout
Table 1 is a list of submissions from which this report is developed and the chapters in which they are referred to is highlighted.
Table 1: Portfolio submissions and subchapters therein
Submission No. Submission Title and Content Topics Chapter Discussed
1 Literature Review:
Material Characterisation, Manufacturing Processes, JLRs procedures
2
2 Simulation Development:
Finite Element Analysis, Validation, Documentation
3
3 Geometry Investigation:
Material Database, Compression Testing, Digital Image Correlation
4
4 Micromechanics of Polymer Foam using Computed Tomography:
Internal Structure, In-situ Compression, Mesostructural Model
6
5 International Placement: The ESRF: Introduction to the ESRF, Synchrotron Radiation, ID19 Beamline
5
1.6
Structure of the Innovation Report
From this point forward a review into previous research is carried out on cellular solids (Chapter 2, supported by Submission One). Using this information an initial characterisation was developed for the material. As well as focussing the research into areas that were missing in both physical testing and simulation.
Having identified how the material can be simulated correctly, an investigation into JLR methods was carried out (Chapter 3, supported by Submission Two). The following section will demonstrate how this was done, and the resulting changes required to their methods in order to improve their database and resources.
Once the simulations were created, they required further validation (Chapter 4, supported by Submission Three). This involved testing on a drop tower and a Very High Strain rate machine. Manufacturers foam were compared, showing the importance for JLR in their selection of material and suppliers.
Having tested the material, it became apparent that internal mechanisms for energy absorption must vary across manufacturer’s material. Therefore the internal structure was analysed using non-destructive methods, i.e. computed tomography. This section looks at the use of both WMG facilities and those available at the ESRF (Chapter 5, supported by Submission Four and Five).
The deliverables from the project and alternative innovations that have been implemented into JLR are discussed in Chapter 6. This includes networking that has been established for them.
7
2
Literature Review: Characterisation, Testing and Simulation of
Energy Absorbing Materials (Submission One)
Jaguar Land Rover (JLR) identified the need for foam material characterisation and simulation techniques for high deflection crash events. This requires a review of current practices and methodologies in both testing and simulation. Any issues identified will require suggestions for improvement. Particular areas of interest were sample orientation, density distribution, analytical methods for predicting performance and the effect of variations in test conditions, including strain rate. Finally the methods for simulating cellular solids in an FEA package as a continuum and mesostructure. Therefore the literature review was tailored to investigate these key areas.
2.1
Material Characterisation and Selection
Cellular Solids have been reviewed by Semerdjiev (1982), Gibson and Ashby (1999) and Mills (2007). Manufacturing processes, material responses across a range of test conditions and theoretical analysis are included. Foamed materials tend to exhibit three phases of compression as shown in Figure 1. Each phase is attributed to a different energy absorption mechanism, including cell wall bending (linear elasticity), cell collapse (plateau) and eventual expulsion of internal air (densification).
Figure 1: Typical stress-strain curve for polymer foam (Goga 2010)
8 cell encases the air within. This plays an important role in compression, especially at higher strain rates. Gibson and Ashby (1999) formulated theoretical equations for predicting the performance of polymeric foams; see Section 2.2. Closed cell foams incorporate a pressure component that applies to the gas present within the cell, it has a larger effect on foams that have a smaller Poisson’s Ratio due to the reduced displacement of each cell and therefore restriction to air movement.
Figure 2: a) Open Cell Foam and b) Closed Cell Foam (Goga 2010)
During the manufacturing process of foams, cells expand and come into contact with adjacent cells; a pressure difference of zero between the two causes polyhedral cell shapes. Cells are made up of vertexes, edges and faces. An open cell foam experiences a collapse in the cell wall (face) during production, causing a thicker strut (edge) as the material retracts.
Polyurethane (PU) is an open cell foam, often used as a low density seat foam for comfort due to its elastic properties and hysteretic rate. An alternative, high density Polyurethane can be manufactured as a rigid foam (PUR) for energy absorption, replacing a buckling mechanism with fracture for energy absorption. Consequently, permanent damage occurs to the material during compression; which is a concern when designed for repeat loading conditions.
In order to evaluate the manufacturing process for EPP, Guo et al (2013) constructed a lab-scale autoclave system. Through increasing the saturation pressure during the annealing phase, a reduction in the melting peak for crystilinity was achieved. This resulted in a higher expansion ratio for the beads; demonstrating that the manufacturing process can affect the microstructure and therefore performance of a material.
a b
Edge Cell Wall
9
2.1.1
Sample Orientation
PUR is formed through the mixture and chemical reaction of its two liquids counterparts; the rise direction in foam cells of polyurethane was investigated using a drop tower test by Kabir, et al (2006). Higher stresses occur when compressed in the direction of material flow, tangential to the elongation of cells. Simulation of PUR does not take into account the elongation of cells or the direction in which it happens, but it has been shown to affect its compressive properties.
Expanded polypropylene is a collection of extruded beads that are expanded in a pressure chamber and orientated within a mould randomly. The sample orientation does not affect its mechanical response.
2.1.2
Density Distribution
Mills (2007) took a deeper look into the manufacturing process of expanded polypropylene and discovered that a density distribution occurs in a single block due to the forming techniques used. Jin, et al (2007) used Digital Image Correlation (DIC) to study the density distribution effect on closed-cell polyurethane; samples from the same block can consequently have a large difference in performance. Sample preparation is discussed further in Section 4.1.
A density distribution was investigated by Bouix, et al (2009). A large block, 200 mm tall, with an optimum density of 76 kg.m-3 had a variation between 68 and 80 kg.m-3, for samples 23 mm cube. The exterior skin layer was recorded at 150 kg.m-3.
10
2.1.3
Sample Preparation
Raps et al (2015) conducted a large review into the manufacturing processes for a range of polymer bead foams. It was suggested that EPP has unique advantages over other foams, including energy absorption, impact resistance and flotation. The range in size of EPP bead cells was stated as being from 200 to 500 μm.
Sample preparation for rigid polyurethane was reviewed by Wijnands (2010), who found a non-destructive method of waterjet cutting had good results. However a softer material, such as expanded polypropylene has not been investigated, but could cause exterior damage due to its flexibility under high forces.
2.2
Analytical Solutions for Predicting Material Performance
Based on experimental work, Gibson and Ashby (1999) formulated equations to predict the mechanical properties of polymeric foams. These materials are either an elastomeric, elastic-plastic or brittle foam. All three exhibit a linear elastic stage, followed by a collapse plateau and finally a densification, shown in Figure 1. They attribute the linear elastic phase to cell wall bending, plus the stretching of cell walls in the case of a closed cell. Cells collapse during the plateau phase, either by buckling, yielding or fracturing as shown in Figure 3; each defining the three types of foams discussed respectively.
Figure 3: Cell collapse mechanics. a) Free body diagram with failure mechanics of b) buckling, c) yielding and d) fracture (Ashby 2006)
Gibson and Ashby modelled the foam cells as cubic arrays as shown in Figure 3, with strut length l and a square cross section t. The equation for Young’s Modulus is derived using beam theory; a linear elastic deflection of a beam loaded at the midpoint by load
b
11
F. The deflection of a beam is proportional to Fl3/EsI and the compressive stress comes from F σl2. These equations are combined with the relative density equation (ρ*/ρs) (t/l)2 and the second moment of area I t4. Finally the modulus of the foam (E*) is given by stress over strain with the strain calculated using deflection over length.
A few assumptions have been made when formulating the equations and they should therefore be applied with caution. The constant C1 was determined using experimental data from impact tests of a range of foamed materials. The material tested by Gibson and Ashby was PU for open cell polymer foam and EPE for closed cell polymer foam. Both were found to have a C1 value of 1; EPP is similar in internal structure to EPE and therefore the same constant will be used. In Gibson and Ashby’s calculation for density cell corners were double counted. Also the material was treated as a continuum, whereas in reality cell structures will vary. The principles behind the failure mechanics still apply for all foamed materials.
The following equations are used to predict a specific area of the foams stress-strain response and are adapted to both open and closed cell. An (*) specifies a property of the foam material, whereas an (s) is the property from the solid source polymer. Equation 1 predicts the Young’s modulus (E*) of a closed cell foam, a property that increases with density.
Equation 1
It contains a pressure component , to predict the effect that air pressure has on the compressive response from within each cell. The fraction of solid in the edges (φ) is used to equate the percentage of material within the struts versus the material in the cell walls. This isolates the contributions to modulus within a closed cell foam as the cell struts (A), cell walls (B) and air pressure (C).
Beyond the linear elastic region, an elastic collapse caused by the buckling of cell walls initiates the plateau. There are now two terms for pressure, the pressure of gas within the cell and the external atmospheric pressure . The stress for the initiation of collapse is given by:
12
Equation 2
The stress is not affected by the distribution of mass in the cell walls and cell struts, instead it is the density ratio between foam and solid material that affect the materials collapse. However an elastic-plastic foam does incorporate these components, as shown in the equation for plastic collapse ( ).
Equation 3
If a foam shows brittle characteristics during compression, the crushing strength can be used to predict the stress at yield. Upon a brittle failure, the air within the cell does not contribute to the mechanism.
Equation 4
The equations discussed demonstrate the three main features that contribute to the prediction of a foams properties; the cell struts, the cell walls and the air within each cell.
Sin and Li (2005) sought to clarify the effect of trapped gas within foam using analytical models. They attribute the strain rate sensitivity of foam to the gas and the mechanical response for the monolithic polymer. They added a new term to the Gibson and Ashby equations to incorporate a higher-order strain term. This was to improve to the analytical prediction for higher strains. Their results showed that the gas effect has a larger contribution during the densification stage of compression and is reliant on the cells morphology. They also suggest caution should be taken when applying the numerical models in order to estimate a materials performance under dynamic loads.
A B C
13 Four analytical models were analysed by Avalle et al (2007); Gibson, Rusch, a modified version of Gibson and their own newly developed model. Gibson’s model showed a good correlation to test data.
2.3
Test Methods and Strain Rate Effects
EPP has been evaluated for reducing head injury during contact sport (Zhou et al, 2015). Using the Head Injury Criteria (HIC) calculation they assessed the specifications required to avoid damage. EPP headgear (8 – 12 mm thick) is appropriate for avoiding injury up to an impact velocity of 5 m.s-1; where it becomes no longer suitable for protection.
Pask et al (2007) highlighted the issue with characterising polymeric foams identifying 54 test methods available for doing so. Testing therefore requires a specific testing standard for each load case as a reference for both the investigation and JLRs future work.
The recommended testing standard for the compression of rigid polymer foam are BSENISO_844_2009 (British Standards Institution, 2009); equivalent to ASTM D1621, or EN826. For low density flexible foam, below 250 kg.m-3, BSENISO_3386_1_1997 (British Standards Institution, 1997); equivalent to ASTM D3574-C. The Test methodologies will be discussed in Section 4.2.
2.3.1
Strain Rate Effects
14 Ouellet, et al (2006) did similar research but with a polyurethane foam, noting a reduction in stress during the plateau stage of compression as the strain rate increased. This is associated with the fracture and consequent expulsion of fractured material during compression. This apparent damage and reduction in hysteresis is an issue for automotive purposes. A repeat loading case supported this, demonstrating a single use for peak performance of the material. The selection of EPP is therefore advantageous for this application.
The same research mentioned for density distribution (Bouix et al, 2009) also varied the foaming methods of EPP, resulting in two 90 kg.m-3 foams with different microstructures, foam B having a smaller cell size. They were analysed at high and low strain rates, as shown in Figure 4. An increase in strain rate changed the response of the material within the foam, but has had little effect on the Young’s Modulus. Therefore a performance change has been achieved through enhancing the manufacturing process.
Figure 4: Stress–strain curves for two different EPP foam microstructures. (Bouix et al 2009)
15 effect on the materials stress-strain response, however it is below the BSENISO_844_2009 standard and may therefore not exhibit the mechanical response that an increase in sample size might have. Larger samples were therefore investigated within this project from a much larger block of moulded material, removing the effect of manufacturing additions such as skin layer.
An Instron VHS testing machine has been used by Weiβenborn (2016) to correlate the modelling of strain rate effects on rigid polyurethane. The samples are very dense, ranging from 230 to 610 kg.m-3; not an appropriate density for passenger safety and due to the load cell capabilities were restricted to a samples size of 25 x 25 x 25 mm3, which does not represent vehicle components. The VHS was used for compression testing, however the set up meant the compression plate was decelerating during the final portion of the test, therefore not providing a constant velocity test condition. This is similar to a drop tower testing condition and may result in a softening effect as the strain rate changes mid test.
Koohbor et al (2017) evaluated the dynamic behaviour of foam on a meso-scale. Digital Image Correlation was utilised to view the strain patterns and therefore strain rates across a samples. It was found that strain rates were at least one magnitude greater within localised areas when compared to the overall sample. This emphasised the possibility for various failure mechanisms to occur across a sample during compression, switching between a buckling and brittle failure.
2.3.1.1 Cyclic Loading
16 recover their shape. However it is unclear what period of time was allocated for residual strain to be released.
Fernandes, et al (2015) looked at the effect of consecutive double loading for different polymer foams. It was found that the protection provided by a sample of EPS is minimal due to lack of elastic recovery between impacts. The recommendation was therefore made to use EPP as an alternative due to its hysteretic properties. Repeat loading was also investigated by Yang et al (2011), supporting the previous findings. Each sample was loaded to 0.25, 0.55 and 0.9 strain; with a softening effect on the material after each compression. The capability of a sample to absorb energy was dependant on the deformation history that sample had undergone. Using a full scale car bumper it was determined that the component underperformed after each load case.
Zhang, L., et al (2011) found the effect of cyclic loading on rigid polyurethane caused damage to the material which resulted in a different response after the first impact, with a drop off in stress of 70%. The effect of strain rate only became apparent when increasing the rate by a factor of 10, although strain rate effects may be present at lower intervals, the contribution of variables such as density distribution may hide it. Simulation done on the testing was defined using the LS-DYNA material model
MAT_FU_CHANG_FOAM_83, with a good correlation to the test results.
2.4
Simulation: Selection of Material Models
For simulations within JLR a material model for continuum geometries are required. However a monolithic polymer material model would be required for simulating mesostructural samples that have been scanned using µCT.
2.4.1
Continuum Modelling
17 incorporating many layers and material models for a single sample the run time for the model would be unnecessarily increased when compared to the accuracy of the result.
Sambamoorthy (2001) compared different material models for the characterisation of energy absorbing Polyurethane using four possible material definitions. They include
MAT_ISOTROPIC_CRUSHABLE_FOAM_63, MAT_BILKHU_FOAM_75,
MAT_LOW_DENSITY_FOAM_57 and MAT_FU_CHANG_FOAM_83. MAT_63 and MAT_75 do not incorporate strain rate effects and are designed to represent materials that undergo brittle failure during compression. This removes the hysteresis that is possible with MAT_57 and MAT_83. For modelling Polyurethane, MAT_57 produced the closest match to physical testing, however MAT_83 was close.
The use of MAT_83 for modelling polymeric foam was however supported by Serifi (2003) and Croop (2009), the latter of which used the material model to simulate expanded polypropylene.
For modelling EPS, Ozturk and Anlas (2011) opted for the material model MAT_57. Through analytical modelling they established the required unloading data for accurate modelling of foam. A Hysteretic Unloading (HU) value of 0.0001 and a Shape Factor (SHAPE) value of 200 were recommended. They found that the material model accurately predicted force, deceleration and displacement of the test, but only for the first loading case. For repeat loading the model required improvement. Thiyahuddin et al (2014) used MAT_83 with two input curves (0.02 and 1 m.s-1) to simulate polymer foam; with good correlation to test data. They used a shape factor of 4.
For the application of single velocity crash testing Borazjani and Belingardi (2017) chose to simulate foam using MAT_63 within LS-DYNA. However their research suggests that for a strain rate sensitive simulation the appropriate material model is MAT_83. In order to overcome instability in foam modelling they used an exponential extrapolation of their stress-strain curves up to a strain of 1.
18
2.4.2
3D Mesostructural Modelling
A computed tomography study by Viot, et al (2011), showed areas of localised compression for expanded polypropylene. Di Prima (2010) imported CT images into an FEA package, with a 12 µm resolution, which was found to be too big in order to capture the internal features. A finer resolution would be required in order to visualise and simulate the cell walls, which is possible with µCT capabilities. This would enable a full cell structure to be visualised and then tested within FEA to view the material response and possibly predict its physical performance.
Both Brydon (2005) and Alkhadar, et al (2008) discussed the issues with modelling polymeric foam as a homogenous model and a CT model within an FEA package. This is due to the complexity of internal structures, the difficulty to mesh a complex geometry and the range of deformation tests and strain rates that are conducted on them. The structure of the material can be split into two characteristics; the sample boundary morphology and the internal cellular topology. The structure of the material can be split into two characteristics; the sample boundary morphology and the internal cellular topology. The mechanisms for energy absorption are different for both, therefore increasing the complexity to accurately represent a material within simulation.
A lower density of rigid polyurethane was quantitatively characterised by De Pascalis (2016) using X-ray computed tomography. Software was used to analyse void count and void statistics. The capabilities have been demonstrated; however the volumetric model was not evaluated within FEA.
19
2.5
Review of Current Practices within Jaguar Land Rover
2.5.1
Testing
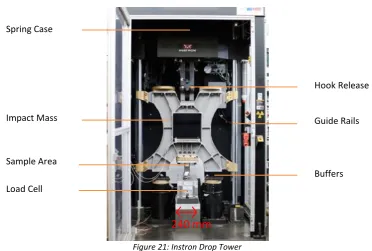
A review of JLR’s polymer foam knowledge was done during the early stages of the project; having collected information to benchmark it against. The materials characterisation department had a TPJLR (Test procedure), shown in Figure 5, for characterising materials for energy absorption. This test methodology dates back to previous owners of the organisation and does not conform to the current British Standards that have been reviewed. It has not seen use within JLR since their formation.
Figure 5: Foam Characterisation Equipment. a) Testing fixture and b) Foam dimensions
This test setup is specific to material validation at high strain rates, a test procedure will be required for coupon testing at a range of rates for characterisation and simulation input data.
2.5.2
Simulation
For finite element analysis JLR use LS-DYNA. Feedback from within JLR suggest there is not a process in place for establishing robust models without the requirement for iterative feedback. This highlighted the need for rigorous modelling methods as well as the material characterisation discussed. The models are made using either a hexahedron or tetrahedron mesh, with a varied element choice based on this. A
20 review of JLR simulation methodology and capabilities can be seen in Section 3.1, followed by recommendations for element choice and mesh size in Section 3.2.
2.6
Identification of Gap in Knowledge and Industrial Need
Testing of polymeric foam for energy absorption has been focussed on the use of expanded polypropylene. The material comes in a range of densities that allow it to be tailored for both passenger deceleration and to protect them from dangerous zones within the vehicle. Alternative foam, such as rigid polyurethane suffers in cases of repeat loading due to the damage caused during compression. JLR require a new test methodology and validated simulation for charactering these materials at a range of strain rates, due to their current lack of knowledge about the most appropriate techniques. This also includes preparation and cutting methods for getting samples ready for testing.
It has been shown that the manufacturing process of polymer foams can cause a density distribution, a thicker skin layer and variations in microstructure. These differences as well as those across manufacturers require investigation. JLR obtain their parts from third tier suppliers, making it difficult for the organisation to trace where it has come from. The implications of material variations and the effect on the simulations that represent them need to be investigated. Digital Image Correlation has been shown to be a good tool for investigating strain patterns on foamed material and can therefore be applied to the expanded polypropylene used within JLR.
22
3
Simulation of Expanded Polypropylene: The Review and
Improvement of JLR Practices (Submission Two)
The project was formulated due to the identification of an issue with the fidelity of simulating cellular solids at Jaguar Land Rover (JLR). Chapter 2 highlighted how to improve the capabilities and robustness of modelling these materials, showing which material models are most appropriate for representing Polyurethane (PU) and Expanded Polypropylene (EPP).
This chapter is a collection of the work that has been discussed in Submission Two -Simulation Development and it begins with a review of JLR’s methods and procedures for simulating polymer foams. A new specification for setting up models within LS-DYNA is discussed, comparing the material models for representing EPP. Through a collaboration established with a manufacturer of said material, a dataset was supplied that created the foundation for material model inputs used to validate physical testing.
The aim was to fully evaluate current methods, create new procedures where appropriate and consequently implement them back into JLR. A robust simulation database will improve model reliability and reduce the requirement for further material model configuration.
3.1
Review of Previous Methodologies
23 Table 2: Original Material Input Data for Simulation of Expanded Polypropylene
JLR Model Title Parameters
used
Density (Kg.m-3)
Young’s Modulus (MPa)
Stress-Strain Data Points
ARPRO exp PP foam 30g/l 3 30 8.202 7 ARPRO exp PP foam 45g/l 3 45 8.202 7 ARPRO exp PP foam 105g/l 3 105 8.202 7 ARPRO exp PP foam 120g/l 3 120 8.202 10 ARPRO exp PP foam 170g/l 3 170 8.202 9 Bayer exp PP foam 40g/l 3 40 8.202 37 Bayer exp PP foam 50g/l 3 50 8.202 6 Bayer exp PP foam 90g/l 3 90 8.202 6
EPP FOAM – 30g/l 8 29.8 3.0 20
EPP FOAM – 60g/l 8 60 3.0 10
EPP FOAM – 90g/l 8 90 3.0 10
EPP FOAM – 120g/l 8 128 3.0 18
EPP FOAM – 170g/l 8 170 3.0 10
The largest number of data points for an input curve was 37, this lack of curve resolution is not suitable for capturing key changes in material response, such as yielding and densification. Investment has been made into improving these material definitions previously, by implementing an abnormally high, or ramped, value to the end of each curve in order to stabilise at large compressions and prevent element inversion. It improved the numerical stability at a cost of model accuracy. However issues remained within the material definitions, such as incorrect density data, repetition of modulus values across the set of similar titled models and the number of data points used to represent the curve.
24 and less than 20 data points. Most of which also used a ramped value for the densification phase.
Figure 6: Stress - strain response for a sample of 170 kg.m-3 EPP compared to the two material models that represent it within JLR. Showing the use of a ramped value for stability
Traceability is an issue flagged by JLR when concerning their data. The test conditions, including strain rates, are unknown. This means a single density curve is applied to all strain rate conditions, when the literature has highlighted the different responses caused by this change for polymer foams with up to a factor of 2 difference in plateau stress.
Different departments have the choice of which material definitions they use, therefore a single sample could be defined under multiple different inputs. The definitions need to be consolidated into a single selection based on density, strain rate and supplier, to limit this variability.
3.2
Model Creation and Recommended Simulation Methods
25 A lack of validated modelling methods and techniques has resulted in a variety of formulations being used across models. For example a collection of hexahedron or tetrahedron elements with a variety of mesh sizes are present from model to model. Having investigated the effect of each, a recommendation for model setup has been presented when constructing simulations of Expanded Polypropylene, which will be transferable to alternative polymeric foams.
Figure 7 shows the model set up for simulating coupon testing. Both the top and bottom plate were limited to only a global z-axis translation. A Damper and Spring prevent the bottom plate from moving, but provide an alternative force output to compare to contact forces (See Section 3.2.2).
Figure 7: Cube Validation Model within LS-DYNA
3.2.1
Element Formulation and Mesh Size
Tetrahedrons showed the greatest correlation to test methods; with a mesh size of 5 mm in 1 point tetrahedron element type (ELFORM 10, or element formulation) within LS-DYNA. Figure 8 shows the comparison between three hexahedron meshes, using ELFORM 1, 2 and 3 as well as one tetrahedron mesh using ELFORM 10. Although the third hexahedron mesh had good results, the model became unstable beyond a strain of 0.8 and returned calculation errors.
50 mm
50 mm
Compression Plate
Foam Block
26
Figure 8: Simulation output with varied FEA Elements
3.2.2
Surface Contacts
The contact name used for the simulations is AUTOMATIC_SURFACE_TO_SURFACE, automatic contacts are the software’s latest additions and are therefore the most up-to-date. They also have no specific orientation assigned to them, whereas the alternatives require it. They are suitable for non-continuous surfaces, specifically useful for JLRs full vehicle models.
As well as creating interactions between parts, the contacts also act as force transducers. The contact records forces produced through the interaction which can in turn be extracted using the output options. If an alternative contact,
27
3.3
Selection of Material Models
For a possible transition from the previously used material model
MAT_LOW_DENSITY_FOAM_57 to the newly evaluated MAT_FU_CHANG_FOAM_83
an in depth evaluation was required. The latter model has the added benefit of incorporating strain rate effects, which in turn reduces the number of material models required for the database and increases model accuracy. Both were reviewed with the required inputs from testing in order to run the model. The initial data required for the MAT_83 card includes the density, Young’s modulus and an input compression stress-strain curve with a corresponding stress-strain rate. Further data includes the unloading effects, multiple curves for different strain rates and a tensile failure point. These will be discussed in more depth in Section 3.6.
3.4
Manufacturers of EPP and Supplier to JLR
Discussions began with material manufacturers in order to help increase the knowledge available on EPP. This included production methods, the consequences of these methods to sample size and surface and the limitations that it brings.
3.4.1
EUEPP
Through connections at WMG, a relationship was established with a European manufacturer of expanded polypropylene, which at the time had few contacts through JLR. The use of an existing manufacturer that houses their own research and development team was not available through JLR. The company will be referred to as EUEPP throughout this document.
28 Through hosting meetings at both WMG and JLR, EUEPP became a source of information for both the project and for JLR. They have now become a key support for projects within the company and are expanding the amount of material they supply to them.
3.4.2
UKEPP
Time was also spent with an expanded polypropylene manufacturer that is based in the UK, a second tier supplier to JLR. They will be referred to as UKEPP throughout the document. UKEPP produce parts including the front bumper for a range of Jaguar models. The raw polypropylene that they use to create each part is purchased from EUEPP and then expanded on site and moulded within their own fixtures. This removes the raw material as a reason for performance differences between the companies foam; meaning any variations are caused by manufacturing processes, which can then be investigated.
3.5
Incorporating a Material Dataset: EUEPP Drop Tower
29
Figure 9: Original material card data compared to quasi-static and drop tower testing for 60 kg.m-3 EPP. Circles indicate areas of missing curve accuracy for EPPFOAM60
EPPFOAM60 does not appear to represent either velocities, and instead crosses both during the compression. The ramped value for densification has dramatically changed the response that the material would have, showing full compaction at approximately 10% lower strain. There are 10 data points used to define the curve, two areas have been highlighted to show how the lack of data points reduces the curvature that would otherwise occur.
30
Table 3: Data Acquired from EUEPP of their EPP analysis
Density kg.m
-3
: 20 30 45 50 60 70 80 90 100 110 120 140 170
Static
3×10⁻⁴ km.h-1
ἑ = 0.00189
Impact
8 km.h-1
ἑ = 22.2222
15 km.h-1
ἑ = 41.6667
24 km.h-1
ἑ = 66.6667
40 km.h-1
ἑ = 111.111
During a meeting hosted by JLR, EUEPP were able to demonstrate their material’s capabilities and limitations. A presentation of these is now available to JLR.
The source of information and traceability was highlighted as an issue early on in the project. A process for assimilating information into the organisation was therefore produced and JLR have access to this via the database that contains the material definitions. Due to EUEPP’s contribution and links that have been created through the project, their contribution to JLR has increased. It was therefore important to validate the material data that EUEPP supplied.
3.6
Validation of Material Models
31
Figure 10: a) JLR's drop tower configuration and b) LS-DYNA Simulation
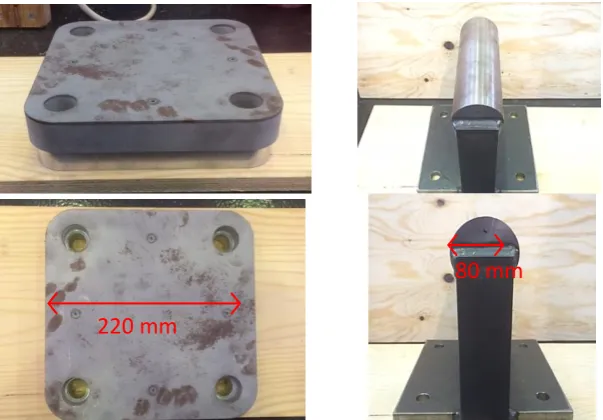
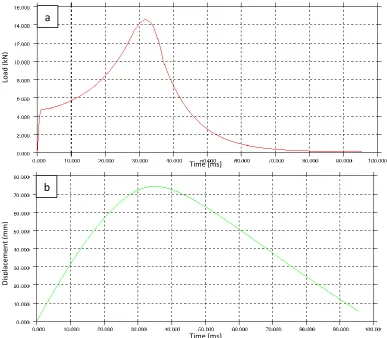
[image:46.595.102.494.421.632.2]The sample had a density of 120 kg.m-3, which was taken from the rear interior trim of a Land Rover. The drop mass was 4.5 kg, and the impact velocity was recorded at 7 m.s-1. Figure 11 and Figure 12 show the results from both testing and simulation using the original material definitons that JLR had within their database; “EPPFOAM” and “ARPRO” respectively.
Figure 11: Component Testing carried out by JLR Compared to their original material inputs for simulation titled “ARPRO”
a b
Impactor
EPP Sample
Support Block
Base Plate
32
Figure 12: Component Testing carried out by JLR Compared to their original material inputs for simulation titled “EPPFOAM”
The simulation data has poor correlation to the test data, with 120 kg.m-3 material models both having a vastly different yield slope. The unloading values did not represent the hysteresis from testing, instead having a fully elastic response. The material models may output a reasonable result on coupon test simulation, which is dominated by the plateau stress, but the incorrect linear elastic region and therefore modulus leads to an inaccurate stress distribution for more complex geometires.
33
Figure 13: Replacement Material input used in the validation simulation
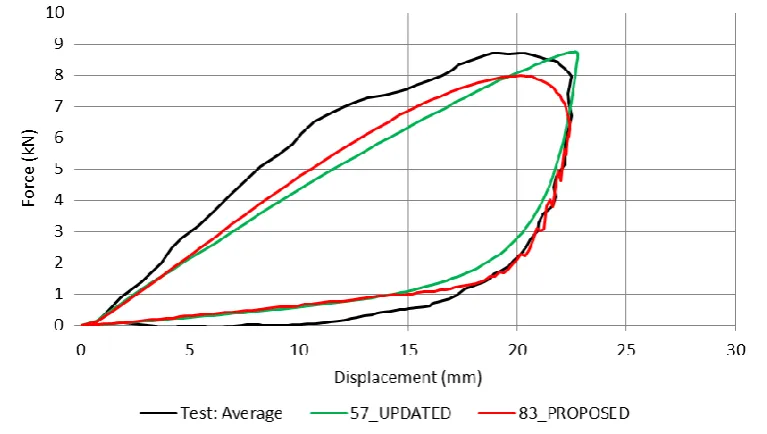
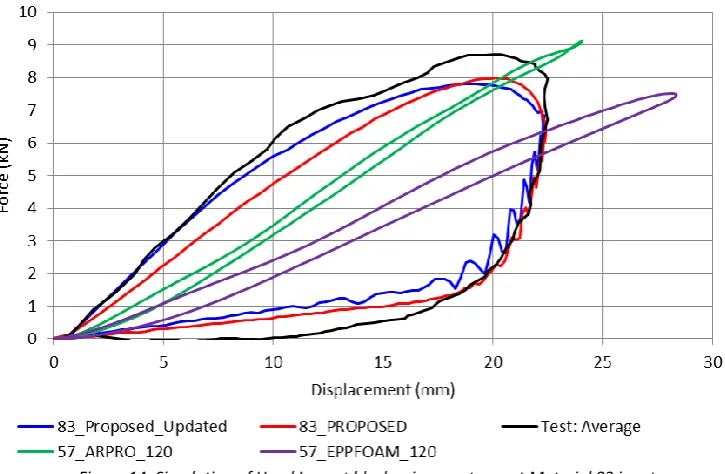
Figure 14 shows improvements to the simulation work with further changes to the input model, including drop weight, material stiffness and strain rate assigned to each strain rate curve. The final material model accurately simulates the initial loading of the block as well as matching the unloading. For MAT_83 the parameters used to model unloading were Hysteretic Unloading (HU) and shape factor (SHAPE). Both of these values were established through simulation testing.
34
[image:49.595.118.481.76.313.2]Figure 14: Simulation of Head Impact block using most recent Material 83 input
Table 4: Residual error comparison between iterations of material models
ARPRO EPPFOAM Updated Final
Loading Curve
Sum of residual error (kN) 319 945 88 34
Percentage Improvement (%) 0 -196 72 89
Unloading Curve
Sum of residual error (kN) 1518 468 18 48
Percentage Improvement (%) 0 69 99 97
35
3.6.1
Quantifying a Vehicles Safety
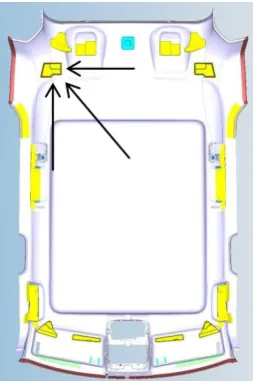
[image:50.595.234.361.383.574.2]The same block simulated in section 3.6 is used to provide a Head Injury Criteria (HIC) analysis for evaluating vehicle safety. Figure 15 shows a section from the full body model, with the specific expanded polypropylene sample positioned within the interior trim. Figure 16 shows the location within a vehicle that the samples originate from.
Figure 15: Cross section of a full vehicle model for HIC analysis
Figure 16: Block location within a Land Rover vehicle
A comparison was therefore carried out using this model on the original inputs, the updated MAT_57 and the proposed MAT_83 material definitions. Figure 17 has the test data from experimental work done by JLR and the simulations that represent it. The axes are acceleration against time, used for the HIC calculation.
Car Body EPP Sample
Dummy Head Liner
36
Figure 17: Comparison between a) original, b) new MAT_57 and c) new MAT_83 material definitions against the HIC test
a
b
37 T/HIS, an Oasys package (ARUP) for XY graphical plotting and post processing, is used to calculate the HIC value using the function provided. It is a measure of the likelihood of an injury on a passenger caused by a high speed impact (calculations are discussed in Submission Two: Section 6.2.2.1). The calculation monitors the rate of deceleration a passenger goes through during a crash. A value of 700 is the maximum permitted by the U.S. advanced airbag regulation; this sample is only present in the US Land Rover vehicles. The testing done by Jaguar has returned a HIC value of 604, which is under the maximum permissible. The values from the simulated test, Figure 17, are also within the requirement. However the updated material definitions increase the gap between test and simulation. None of the simulations meet the peak acceleration that is demonstrated during the physical test.
The original material models (ARPRO and EPPFOAM) exhibit very different mechanical responses in Figure 14, but are similar in the results shown in Figure 17a. This implies that foam model is relatively insignificant in this load case. The 57_Update has demonstrated the largest change to output shape, therefore the modulus and yield stages of compression could be the most important for this test. 83_Proposed has the least accurate result when compared to the test data, with the lowest acceleration and therefore HIC result. However based on component validation tests in section 3.6, the original 57 cards cannot be recommended for JLR’s use.
It is possible that there are errors in the test data or the model used to represent it. The full body model is made up of lots of components, each exhibiting a displacement during the test. It is also possible that a magnitude of errors from other parts within the model could conceal any improvements that the new material models have contributed. This further highlights the importance of accurate and traceable coupon and component testing, as well as the material model and validation methods.
3.7
Summary
The simulation methodologies at JLR were reviewed and updated.
38
JLR’s material models were updated with new datasets, increasing the accuracy of their simulations
Having evaluated simulation procedures and the modelling choices of JLR, a new set of methodologies were created. This included formulation of geometric models and the specific material models used for simulating both Polyurethane (PU) and Expanded Polypropylene (EPP). The latter were constructed using test data sourced from a manufacturer of EPP from Europe in both MAT_57 and MAT_83.
Components sourced from a Land Rover vehicle were tested in order to validate material models. A comparison between the original JLR datasets and those updated showed a significant improvement, reducing the residual errors for loading by 89%.
The modelling capabilities were also improved with robust models that can now compress to high strain without the occurrence of calculation errors. This removed the requirement for model alteration from the user. With the new robust modelling procedures, output data can be relied upon as being an accurate representation of the intended material.
39
4
Geometry Investigation: Stress-Strain Response of Expanded
Polypropylene, Strain Rate Effect and Production Variation
(Submission Three)
Having created the material inputs for simulation and shown an improvement using the new data acquired from EUEPP, it was important to show the dataset is an accurate representation of their material; as it is used to evaluate safety critical components within the vehicle. As Jaguar Land Rover (JLR) do not source all of their material from EUEPP, the material was tested to ensure the dataset represents other manufacturer’s foam. There were also gaps within the data provided, as shown previously in Table 3.
This chapter is a summary of the work produced in Submission Three - Geometry Investigation. New methodologies were produced for characterising energy absorbing foams at a range of strain rates on three different compression testing machines. Using these methods the following testing and research was carried out to investigate the mechanical response of Expanded Polypropylene (EPP).
1. The materials behaviour when using a decelerating mass versus a constant velocity impact, therefore effecting the simultaneous strain rate of an experiment (Section 4.4)
2. EUEPP’s stated foam stress-strain response versus the reality of testing samples purchased from them (Section 4.5)
3. EUEPP’s foam versus the performance of UKEPP foam (Section 4.6)
4. The effect on EPP with an increase in strain rate compression (Section 4.6.1)
5. Coupon testing using a flat plate impactor versus a localised load from a cylindrical compression fixture, improving the representation of a car crash (Section 4.7) 6. The use of Digital Image Correlation to view the strain distribution during
compression (Section 4.7.1)
40 8. The effect of a dense skin layer that is formed during the moulding process (Section
4.8.2)
9. The mechanical response when stacking multiple layers of foam to produce a single test sample. Can the performance be tailored to reduce high stresses from occurring early on in an impact (Section 4.8.3)
10.The effect of sample size on the stress-strain output of EPP, investigating whether coupon testing can be applied to alternative samples within simulation. (Section 4.8.4)
4.1
Material Selection and Sample Preparation
All sample preparation, testing, post-processing and simulations have been done at WMG to avoid problems with missing details and traceability. Table 5 shows the material purchased for testing, both suppliers use the same raw material for creating their EPP. Therefore any differences in material performance stems from the manufacturing process. A large single block was purchased from EUEPP, whereas UKEPP supplied pre-cut cuboids, it is therefore unknown from where within the original mould they come from.
Table 5: Material Specifications for Testing
Manufacturer Density (kg/m3) Dimensions (mm)
EUEPP 30, 60, 80, 120 Single Block - 1200 x 800 x 200
UKEPP 30, 50, 80 30 x Blocks - 200 x 200 x 100
Samples of density 30 and 80 kg.m-3 were purchased from both suppliers in order to have a direct comparison, the other densities correspond to gaps in EUEPP’s supplied data as well as the 60 kg.m-3 that they have performed extensive testing on, as a benchmark.
41 calculate each sample’s density and for converting results into a stress-strain output. The mass of each sample was recorded in grams to two decimal places.
Through preliminary sample preparation, methods of cutting EPP were investigated. A hotwire cutter was found to cause structural change due to melting, which was not occurring with a band saw. Through changing the surface of the material it is possible the flow of air during compression would be effected, increasing air pressure and therefore the stresses exhibited. Cutting has therefore been done using the band saw method, taking into consideration the thickness of the blade when planning sample size.
As previously discussed in Section 2.3, the number of available tests for polymeric foam is vast. A British Standard and ASTM Standard have been chosen for each loading condition, in order to consolidate the possibilities and to direct test engineers at JLR to the correct format. Uniaxial Compression is the most important method for analysing the materials energy absorption capabilities; testing for which has consequently been done based on BSENISO_3386_1_1997 (British Standards Institution, 1997).
4.2
Test Methodologies: Strain Rate Sensitivity Investigation
The following three subsections contain the test methodologies for compression testing across the three testing machines used within this project; an Instron 5800R, the Drop Tower and the VHS respectively.
These machines were chosen for their range of strain rates, from quasi-static to 100 s
-1