Direct and Rapid Quanti
fi
cation of Calcium Phosphate Precipitate on Titanium
by X-Ray Fluorescence Analysis Using Fundamental Parameter Method
Kozue Satoh
1,+1,+2, Masashi Komata
2, Manabu Mizuhira
3,
Kazuaki Wagatsuma
4and Naofumi Ohtsu
11Instrumental Analysis Center, Kitami Institute of Technology, Kitami 090-8507, Japan
2Department of Biotechnology and Environmental Chemistry, Kitami Institute of Technology, Kitami 090-8507, Japan
3Bruker AXS K.K., Yokohama 221-0022, Japan
4Institute for Materials Research, Tohoku University, Sendai 980-8577, Japan
In the present study, we propose a characterization technique to determine the amount of calcium phosphate (CP) precipitate formed on a titanium (Ti) substrate. The quantitative analysis of the CP precipitate on a metallic substrate is significant for researchers of metallic biomaterials because CP that spontaneously precipitates in a simulated-bodyfluid gives information on the bioactivity of the metallic biomaterials. We focused on X-rayfluorescence (XRF) analysis and adopted the thin-film fundamental parameter method (thin-film FP method) because it allows direct (non-pretreatment) and rapid quantitative analysis without any reference materials. We show that XRF analysis using the thin-film FP method can be adequately applied to the quantitative analysis of the CP precipitate in the simulated-bodyfluid immersion test. We also show that the density of the CP-precipitate layer can be estimated by combining the XRF results with images of cross-sectional scanning electron microscopy (SEM).
Consequently, XRF analysis combined with the thin-film FP method can provide a convenient means to evaluate the CP precipitate on a Ti substrate, which improves the accuracy and accessibility of the simulated-bodyfluid immersion test. [doi:10.2320/matertrans.M2013020]
(Received January 15, 2013; Accepted February 4, 2013; Published April 12, 2013)
Keywords: X-ray fluorescence analysis, fundamental parameter method, thin film, calcium phosphate, titanium, metallic biomaterial, bioactivity
1. Introduction
Metallic materials have been widely used as medical devices for various parts of the human body. In particular, titanium (Ti) and its alloys have been employed as alternative materials for hard tissues, such as dental implants and artificial hip joints due to their high corrosion resistance and low toxicity.13) However, after the implantation, a lengthy period is required to form a strong bond between the metal surface and the living bone because of their low hard-tissue compatibility,4) which often causes serious clinical problems. To resolve this problem, researchers have dedicated a great deal of effort to fabricate bioactive coatings on a Ti surface.513)
When a novel bioactive coating is developed, its hard-tissue compatibility is investigated thorough several exper-imental procedures. It is generally accepted that animal experiments in vivo14)and cell culture tests in vitro15,16)are reliable evaluation methods because these tests reproduce the physiological responses occurring in the human body quite well. However, it is difficult for materials scientists to regularly use the above methods because of the technical difficulties and the need to prepare specially designed equipment. Furthermore, animals have to be sacrificed for the evaluation. As an alternative method for evaluating the bioactivity of the metallic biomaterials without sacrificing animals, a simulated-body fluid immersion test was sug-gested by Kokubo et al.12,13,17) The simulated-body fluid,
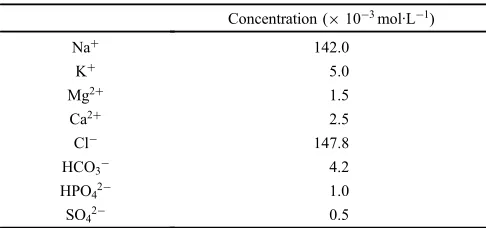
[image:1.595.305.548.408.522.2]whose ion concentrations are nearly equal to those of human blood plasma, includes supersaturated calcium ions (Ca2+) and hydrogen phosphate ions (HPO42¹) (Table 1). When a bioactive metallic material is immersed in the simulated-body fluid, calcium phosphate (CP) is spontaneously precipitated on the metallic surface. Because the performance of the CP precipitate could be closely related to bone formation in the human body, a simple and rapid analytical technique for evaluating the amount of the precipitated CP would give important information on the bioactivity of the metallic material and would make it possible to accelerate research in this area. Several researchers have estimated the amount of the precipitate that forms in the initial stage either by counting the number of individual precipitate particles or by estimating the area density of the coated surface using images of cross-sectional scanning electron microscopy (SEM).1823) This method might be superior to other techniques with respect to the sample preparation; however, it neither can yield any quantitative results nor be applied for observation
Table 1 Composition of conventional simulated-bodyfluid. Concentration (©10¹3mol·L¹1)
Na+ 142.0
K+ 5.0
Mg2+ 1.5
Ca2+ 2.5
Cl¹ 147.8
HCO3¹ 4.2
HPO42¹ 1.0
SO42¹ 0.5
+1Undergraduate Student, Kitami Institute of Technology. Present address:
Institute for Materials Research, Tohoku University, Sendai 980-8577, Japan
+2Corresponding author, E-mail: kozue.satoh@imr.tohoku.ac.jp
over a wide surface area of the sample. When the surface of a Ti substrate is covered completely with the precipitate, the amount of the precipitate has been evaluated either by estimating the thickness of the CP-precipitate layer from cross-sectional SEM images20,21)or by chemically quantify-ing calcium and P in the precipitate usquantify-ing inductively coupled plasma optical emission spectrometry (ICP-OES) after dissolving them into an acidic solution.24) However, these methods require troublesome pretreatments and they also destroy the sample. It is thus considered that the above-mentioned analytical methods are not suitable for routine quantitative analysis that could be used in the field during material development.
Our research group focused on X-rayfluorescence (XRF) analysis as an alternative method for SEM or ICP-OES in quantifying the CP precipitate. XRF has the advantage of being able to conduct direct (non-pretreatment), rapid, and non-destructive analysis; on the other hand, the accuracy requires further investigation, especially with regard to the CP precipitate on a Ti substrate. Abe et al. reported that a calibration curve for CP quantification could be prepared based on standard reference materials whose were determined by ICP-OES and that by using this calibration curve, they were able to obtain an accurate value for the atomic ratio of calcium (Ca) to phosphorus (P), as well as mass per unit area of these elements and CP compound on the sample surface.25) However, preparation of the calibration curve requires several time-consuming procedures, including chemical analysis and, in addition, standard reference materials for this sample are generally difficult to obtain. Therefore, we focused on the fundamental parameter (FP) method, which can provide a quantitative solution based on theoretical calculations with-out the need for any standard reference materials.26,27)In the 1950s, Sherman’s equation was suggested as a way to describe the relationship between the fluorescent X-ray intensity of an element and its concentration in a sample according to the principle of generating X-rays. In the FP program, a quantitative result such as the composition of a constituent element in a solid sample is calculated by means of iterative matching of the measured intensities and the calculated intensities based on the FP equations. It should be noted that diverse elements co-existing in a sample can cause the absorption and secondary excitation of the fluorescent X-ray of an analytical element, which is known as the matrix effect. In addition, this effect depends strongly not only on the kind and content of co-existing elements, but also on their distribution in the sample; therefore, all these factors should be taken into account in the calculation process in the FP method. Nowadays, the FP method program is pre-installed in most commercial XRF equipment. The FP algorithm assumes that the analyte is a bulk material in which all elements containing an analytical element are uniformly distributed. However, a sample of the CP precipitate has a localized distribution of Ca and P on the Ti surface. Therefore, we considered that an accurate quantitative determination of CP-precipitate layers cannot be obtained using a general FP method because it cannot accurately estimate the matrix effect due to insufficient correction for the spatial distribution of Ca and P on the Ti substrate. Accordingly, because the sample is regarded as a thin film
on a surface, we focused on an FP method specialized for film-like samples, which is known as the thin-film FP method.2831) In the case of a thin-film sample, the matrix effect becomes much complicated than in a bulk material having a homogeneous composition. For this reason, several additional parameters such as the structure of the layer-by-layer film, which is known as the layer structure model, should be provided for in the calculation when using the thin-film FP method. On the other hand, it has been reported that the quantitative results contained relative uncertainties in the range of 110% because the algorithm of the thin-film FP would be incomplete.28) Therefore, when a novel sample is analyzed using the thin-film FP method, the accuracy of the results needs to be carefully investigated and the sensitivity factors of each analytical element are calibrated as may be necessary.
In the present study, several layer structure models were employed to quantify the amount of the CP precipitate. By comparing these results, we investigated how much each factor of the layer structure model affected the quantitative results, in order to understand which parameters should be of more concern in order to obtain more accurate analytical results. Furthermore, using XRF with the thin-film FP method, we determined the amount of CP precipitated on a Ti substrate after immersing the substrate in simulated-body fluid. The accuracy of the analytical values thus obtained, as well as the applicability of the method to the simulated-body fluid immersion test is discussed by comparing the results with the reference values determined using ICP-OES. We also examined whether the thickness of the CP precipitate can be determined using quantitative values determined by XRF. Based on these results, the performance of XRF using the thin-film FP method is presented as it was applied to quantitative evaluation of CP precipitated on a Ti substrate surface in the simulated-body fluid immersion test.
2. Experimental Procedures
2.1 Sample preparation
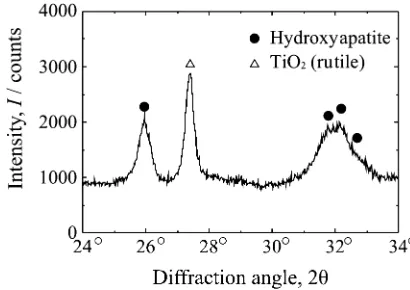
precipitate was confirmed using a glancing-incidence X-ray diffraction method (D8 ADVANCE, Bruker AXS K.K., Germany). In the X-ray diffraction measurement, the monochromated Cu K¡ was incident on the sample at a glancing angle of 2°. Figure 1 shows the typical X-ray diffraction pattern of the sample soaked in simulated-body fluid for 2 d, suggesting that the CP precipitate is hydrox-yapatite. In the same way, the CP precipitates of all samples produced in this study were confirmed to be hydroxyapatite. The surface morphology and cross-sectional image of the CP-precipitate layer were observed by SEM (JCM-5000 Neo Scope, JEOL, Japan) using secondary electron image mode at an acceleration voltage of 10 kV. Samples for observation of cross-sectional SEM were prepared by cutting CP-coated Ti samples with a conventional cutting machine after fixing them to a silicon wafer through a resin.
2.2 XRF measurements
A wavelength-dispersive XRF instrument (S8 Tiger, Bruker AXS K.K., Germany) equipped with an end-window X-ray tube with an Rh-target was used. The fluorescent X-rays emitted from a sample passed through a mask with a diameter of 8 mm to cut out unwanted signals such as fluorescent X-rays from the sample cup. The software used for the analysis was Quant-Express ver. 2.0 for the general FP method and ML-Quant ver. 2.0 for the thin-film FP method, both of which were provided by Bruker AXS K.K., Germany. The measurement conditions are shown in Table 3. To refrain from statistical fluctuations of their X-ray intensities, the accumulation time of the Ca K¡ and P K¡
lines was determined to be 100 s. The sensitivity factors corresponding to Ca K¡ and P K¡ were adjusted so that the atomic ratio of Ca to P in the hydroxyapatite [Ca10(PO4)6(OH)2] powders (Taihei Chemical Industrial Corp., Japan), which had been calculated by using the general FP method, would be 1.66«0.01 (n=5). In the thin-film FP method, a layer structure model has to be constructed for individual samples. We employed a simple model in which the absorption effect of hydrogen and oxygen, as well as the secondary excitation effect by Ti substrate was taken into account. The XRF instrument used in this study could not detect the signals of hydrogen and oxygen, even though their concentrations were high enough to affect the quantitative results. It was thus assumed that Ca and P in the precipitate each formed an oxide having chemical compositions of Ca5OH and P3O4, respectively.
2.3 ICP-OES measurements
To obtain reference values for the quantification, the samples used in the XRF analysis were also measured by ICP-OES (SPS3000, SII Nano Technology Inc., Japan). The samples were soaked in 16 mL of a 7 mol/L nitric acid solution and then heated to approximately 373 K in order to completely dissolve the CP precipitate in the solution. After cooling, the solution was diluted to 50 mL using a volumetric flask, and then the concentrations of Ca and P were determined by ICP-OES. The analytical lines were selected to be Ca I 317.933 nm and P I 213.686 nm. For comparison with the quantitative values by XRF, the concentrations determined by ICP-OES were converted into values of mass per unit area (g/m2).
3. Results and Discussion
3.1 Comparison of the atomic ratio of Ca to P in the CP-precipitate layer as determined by ICP-OES, thin-film FP method, and general FP method
[image:3.595.306.549.83.180.2]The atomic ratios of Ca to P ([Ca]/[P] ratio) in the CP-precipitate layer determined by XRF with the thin-film FP method and with the general FP method are compared to the results obtained by ICP-OES (Fig. 2). When using the thin-film FP method, the [Ca]/[P] ratios are fairly consistent with the ICP results, although the values tend to be somewhat lower with the thin-film FP method. In contrast, the ratios determined by the general FP method are notably lower than those of both the ICP-OES method and the thin-film FP method. These results imply that the algorithm for the thin-film sample significantly improved the accuracy of the [Ca]/
Table 2 Chemical composition of the CP-precipitate layer which was prepared by soaking in conventional simulated-bodyfluid, determined by ICP-OES.
Composition (mass%)
Ca 63.8
P 32.6
Mg* 2.9*
Na* 0.6*
*Advisory value: determined by using the calibration curve which is pre-installed in ICP-OES equipment.
Fig. 1 X-ray diffraction pattern of CP-precipitate layer on a Ti substrate which was prepared by soaking in simulated-bodyfluid for 2 d.
Table 3 Experimental parameters of XRF analysis.
Lines
Rh tube
Crystal Detector 2ª (°)
Counting time
(s) Tube
voltage (kV)
Tube current
(mA)
Ca K¡ 50 60 LiF (200) Proportional
Counter 113.105 100 P K¡ 30 100 Pentaerythritol Proportional
[image:3.595.46.291.105.180.2] [image:3.595.64.269.233.378.2][P] ratio and that XRF analysis can lead to accurate results by using only the thin-film FP method. The algorithm of the general FP method, on the other hand, is constructed on the assumption that the analyte is a homogeneous bulk material without any segregation. However, the CP precipitate samples have Ca and P which are localized on the Ti surface, which probably leads to an inaccurate estimation of the matrix effect under the general FP method. In addition, when using the general FP algorithm, the value of Ca is fairly lower than that of P. For stoichiometric hydroxyapatite, the linear absorption coefficients of Ca K¡ and P K¡ are 22.58 and 64.39 m2/kg, respectively. When analyzing a sufficiently thick bulk material, the difference in the escape depth between the two elements needs to be corrected for; however, in the case of a thin-film sample, the correction using the escape depth of the two elements as the parameter would fail, which could explain why the analytical values were incorrect when using the general FP algorithm. On the other hand, it should be mentioned that the average value of the [Ca]/[P] ratio obtained by ICP-OES is 1.62, which is lower than that of a stoichiometric hydroxyapatite (1.67), although an XRD pattern corresponding to stoichiometric hydroxyapatite is observed. Small amounts of Na and Mg were detected in the CP-precipitate layer by both ICP-OES (Table 2) and XRF methods. These ions occupy substitution sites of ionic Ca in the hydroxyapatite structure.34,35) Moreover, it has been reported that small amount of CO32¹ ions, which is a constituent of the simulated-bodyfluid, substitute for PO43¹ sites, resulting in Ca2+ deficiency form.36,37) As a result, the value of the [Ca]/[P] ratio obtained by ICP-OES was estimated to be lower than that of the stoichiometric value.
3.2 Comparison of mass thickness determined by ICP-OES and thin-film FP methods
In order to confirm of the influence of the parameters used in the layer structure model on the quantitative results, we investigated two models, one in which the presence of the Ti substrate is considered and the other in which it is not. The mass per unit area, which is known as the mass thickness, of Ca and P in the CP-precipitate layer was determined by XRF using the thin-film FP method for each model. The values for each model were then compared to the reference values determined by the ICP-OES (Fig. 3). The dashed line in this
figure represents the expected values when the analytical results determined with the thin-film FP method completely agree with standard values determined using ICP-OES. In the case of both Ca and P, almost all of the plots appear below these dashed lines, meaning that the mass thickness determined with the thin-film FP method is about 1018% higher than that by ICP-OES, regardless of the layer structure model employed. This effect is probably because the actual samples have a layer structure that is somewhat different from that of the models for the FP calculation. In the present case, the actual sample contained small amounts of Na and Mg ions, and CO32¹ in the CP-precipitate layer and had an interfacial TiO2layer under the CP-precipitate layer,32)which is different from the model used for the FP calculation, which comprised a pure hydroxyapatite layer and a Ti substrate. It is further considered that the roughness of the sample surface could affect the detected intensity of the fluorescent X-rays, which is known as the shadow effect. As a result, these complicated effects could cause the slight difference in the quantitative results between ICP-OES and XRF with the thin-film FP. However, because most of the plots exhibit clear linear relationships between the thin-film FP method and the ICP method regardless of the amounts of the CP precipitate, the mass thickness of Ca and P estimated with the thin-film FP method could be calibrated and then quantified on an accurate scale. In addition, the mass thickness of Ca and P determined with the thin-film FP is on the same order as the corresponding ICP values; therefore, the thin-film FP method could offer an
approx-Fig. 2 Comparison of the atomic ratio of Ca to P ([Ca]/[P] ratio) in the CP-precipitate layer determined by ICP-OES, XRF with the thin-film FP method (TF-FP-XRF), and with the general FP method (FP-XRF).
[image:4.595.76.270.63.215.2] [image:4.595.317.537.70.360.2]imate solution with a rapid response, which may be suitable for actual use in simulated-body fluid immersion tests. On the basis of these results, we concluded that the XRF analysis using the thin-film FP method can be adequately applied to the quantitative analysis of the CP-precipitate layer in the simulated-body fluid immersion test. On the other hand, by considering the existence of a Ti substrate in the layer structure model, the accuracy of the determination of mass thickness was improved by 12 and 3% for Ca and P, respectively. The Ti substrate covered with the CP precipitate causes secondary excitation of Ca K¡and P K¡by radiating Ti K¡. Because 7896% of Ti K¡ emitted from the Ti substrate can pass through 6-µm-thick CP-precipitate layer, the secondary excitation effect from the Ti substrate is too large to be ignored. Therefore, consideration of the additional excitation by the Ti substrate is indispensable; otherwise, higher analytical values of Ca and P are obtained because the contribution of the secondary excitation is not taken into account. It should be noted that in the secondary excitation by Ti K¡, the degree of the correction needed for Ca is greater than that needed for P. Ca absorbs Ti K lines more easily than does P because the K-absorption end of Ca (6.47©10¹13J) is much closer to the Ti K¡ line (7.23©10¹13J) than that of P (3.44©10¹13J). Hence, the algorithm of the thin-film FP should be modified based on the fact that Ca K¡is more sensitive towards the secondary excitation effect from the Ti substrate than P K¡by means of taking into account the effect in layer structure model.
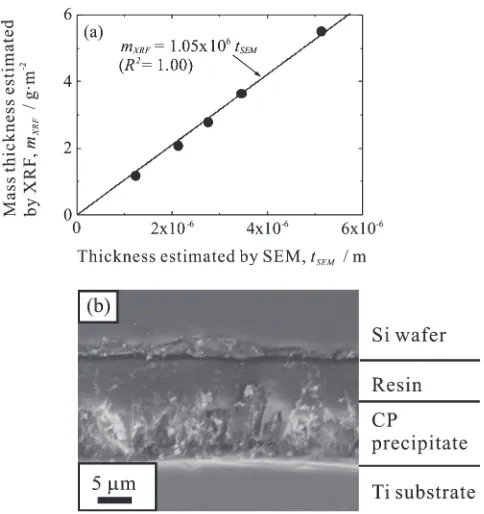
3.3 Evaluation of the density of the CP-precipitate layer
We here show that the density of the CP-precipitate layer can be estimated by combining the XRF results with cross-sectional SEM images. The mass thicknesses of the CP-precipitate layer obtained by XRF are plotted against the thickness estimated from the cross-sectional SEM images, as shown in Fig. 4(a). The typical example of the cross-sectional SEM image of the CP sample, which was soaked in simulated-bodyfluid for 30 d, is shown in Fig. 4(b). A good linear correlation is found in Fig. 4(a). The slope of this correlation gives the density of the CP-precipitate layer. Here, the density of the layer, obtained from the slope of this plot, is estimated to be 1.05©106g/m3. Hiromoto et al. reported that experimental conditions such as the pH of the soaking solution could affect the nature of the precipitated hydrox-yapatite.38,39)Hence, control of the solution for precipitating CP might change the density of the resultant-precipitate layer. Therefore, our suggested method using XRF can be recommended as a simple and reliable tool to obtain the density of the CP-precipitate layer.
On the other hand, by using density as a parameter, the thickness of the CP-precipitate layer can be easily calculated from the mass thickness of the CP-precipitate layer estimated by XRF analysis. It should be noted that the density of stoichiometric hydroxyapatite is 3.15©106g/m3, which is three times larger than that of the CP-precipitate layer produced in this study. Therefore, to use the XRF for analyzing the layer thickness for daily analysis, we recommend preliminarily determining the adequate density of the CP-precipitate layers by combining XRF analysis with cross-sectional SEM images.
3.4 XRF analysis in comparison with conventional analytical methods
The XRF analysis using the thin-film FP method was compared with conventional analytical methods which evaluate the amount of the CP precipitate in the simulated-body fluid immersion test. SEM images have been utilized for this evaluation in the past, in which results were obtained by counting the number and/or by estimating the area density of individual precipitate particles on the surface.14,1823) However, this method cannot be applied to a quantitative estimation of the precipitate covering the Ti substrate completely because the thickness of the CP-precipitate layer cannot be estimated from the SEM image of the surface. Therefore, it is difficult to obtain the amount of CP-precipitate layers of various thicknesses; however, due to its simplicity and rapid response, the SEM images would be useful for CP precipitate particles that are isolated on the surface. On the other hand, there appears to be another method in which SEM images can be used to estimate the deposition rate of the CP precipitate. This method involves counting the number of days from the start of the reaction to the day on which the precipitate is observed to take on the typical shape in the SEM image.22,23) This method has drawbacks in that many samples are required and that slight changes in the deposition rate cannot be distinguished. In contrast, in the case of XRF analysis with the thin-film FP method, only a few samples are required and small differences in the amount of the CP precipitate, on the order of 0.01 g/m2, can be detected. Furthermore, the XRF method can measure insulator materials such as CP easily. Observa-tion of cross-secObserva-tional SEM images can directly provide information on the thickness of the precipitate;20,21)however,
[image:5.595.307.549.68.325.2]it is impossible to evaluate multiple samples rapidly because it requires a time-consuming and technically difficult pretreatment of the samples, leading to destruction of the samples. The SEM method therefore is not suitable for routine analysis, whereas XRF can conduct a rapid and non-destructive analysis without needing special techniques. ICP-OES has been employed for the determination of Ca and P remaining in the simulated-body fluid after soaking a test material;22,23) however, it does not always provide accurate analytical values because the concentrations of Ca and P might vary due to adsorption to the container or contami-nation from the environment. This analytical method has another drawback in that test materials must be soaked in the simulated-body fluid for a long period of time because decreased concentrations of Ca and P in the simulated-body fluid have to beyond their detection limits. Another method using ICP-OES to quantify the Ca and P on the sample chemically has been reported;24) however, this method requires a troublesome chemical treatment in which the precipitate is dissolved in an acidic solution, which eventually leads to the destruction of samples. Furthermore, in this case, the analytical values obtained by ICP-OES do not directly correspond to the amount of the precipitate. In contrast, the XRF analysis with the thin-film FP method can simultaneously determine the [Ca]/[P] ratio in the CP-precipitate layer and the mass thickness of the layer, without the need for any chemical pretreatment; also, the thickness of the layer can be easily calculated from the mass thickness.
It should be noted that in this study the layer structure model was constructed on the assumption that the precipitate has the composition of stoichiometric hydroxyapatite; there-fore, it cannot accurately quantify the CP that precipitates in the initial stage when there is more Ca than the stoichiometric composition.40)Nevertheless, we can conclude that the XRF analysis with the thin-film FP method could be highly suitable for the evaluation of the CP-precipitate layer on a Ti substrate in the simulated-body fluid immersion test, which would be very helpful for research regarding bioactive coatings.
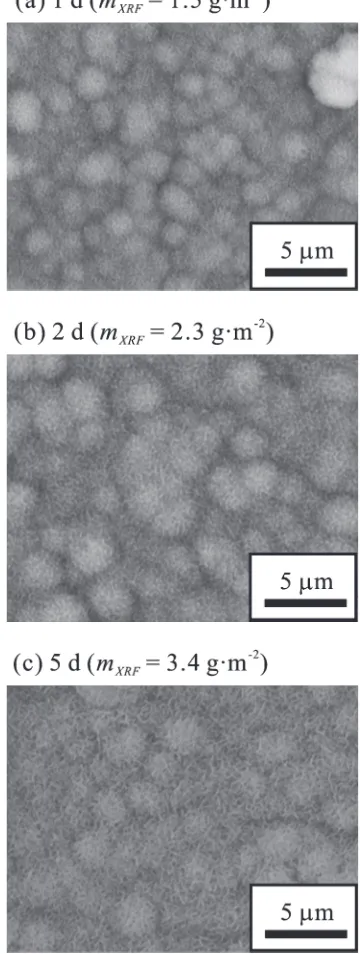
3.5 Analytical example of XRF analysis using thin-film FP method with CP-precipitate layer
SEM images of typical samples are shown in Fig. 5, together with mass thickness of the CP-precipitate layer determined by XRF on the basis of the thin-film FP method. The SEM images show the Ti substrates after soaking in the simulated-body fluid for 1 d (Fig. 5(a)), 2 d (Fig. 5(b)) and 5 d (Fig. 5(c)). While these images indicate that each sample has somewhat different surface morphology, it is rather difficult to analyze the difference in the amount of CP precipitate quantitatively from these images. On the other hand, the mass thickness was successfully determined by the XRF method, and it was revealed that the mass thicknesses of the CP-precipitate layers on the Ti substrates soaked for 2 and 5 d was approximately 1.5 and 2.3 times, respectively, as much as that soaked for 1 d. This result shows that the XRF analysis using thin-film FP method can provide more quantitative information on the CP-precipitate layer than SEM can.
4. Conclusions
(1) When using a thin-film fundamental parameter (FP) method, the values obtained for the atomic ratio of Ca to P ([Ca]/[P] ratio) in the CP-precipitate layer were almost consistent with the reference values determined by ICP-OES, indicating that the XRF analysis can be used to determine the [Ca]/[P] ratio.
(2) Because it did not take the thin-film structure into consideration, accurate analytical values were not obtained when a general FP algorithm was employed for the calculation. The reasons are as follows: the influence of the matrix effect cannot be accurately estimated because the general FP method assumes the
[image:6.595.336.516.78.555.2]sample to be homogeneous. The correction using the escape depth as the parameter toward thin-film sample failed because there is a significant difference in the linear absorption coefficients: Ca K¡ and P K¡ are 22.58 and 64.39 m2/kg, respectively. The algorithm of the thin-film FP method drastically improved the accuracy of the [Ca]/[P] ratio in the CP-precipitate layer.
(3) The mass per unit area (mass thickness) of Ca and P in the CP-precipitate layer determined with the thin-film FP method was somewhat higher than that determined by ICP-OES. On the other hand, it was revealed that the mass thickness of both Ca and P determined with the thin-film FP method was within the same order as that determined by ICP-OES, regardless of the total amount of the precipitate.
(4) If the Ti substrate contributed to the layer structure model for the FP calculation, the accuracy of mass thickness improved by 12 and 3% for Ca and P, respectively. The reason for this is that the secondary excitation effect of Ti K¡ is too large to be ignored because 7896% of Ti K¡ radiation from the Ti substrate could emanate through 6-µm-thick CP-precipitate layer. Therefore, the secondary excitation must be taken into account for the FP calculation. (5) The degree of the correction for Ca was larger than that
for P when the effect of secondary excitation by Ti K¡ was considered in the FP calculation, because the K-absorption end of Ca (6.47©10¹13J) is much closer to the Ti K¡lines (7.23©10¹13J) than that of P (3.44© 10¹13J). This means that Ca K¡is more sensitive to the secondary excitation of Ti K¡than P K¡.
(6) A good correlation was found between the mass thickness of the CP-precipitate layer estimated by XRF with thin-film FP method and the thickness estimated from cross-sectional SEM images. Thus, the density of the CP-precipitate layer can be estimated based on the correlation. The density of the layer produced in this study was estimated to be 1.05© 106g/m3. Using this density, the thickness of the CP-precipitate layer is able to be calculated from the mass thickness estimated by XRF.
(7) The XRF analysis using the thin-film FP method has several advantages over conventional analytical meth-ods as follows: XRF can perform rapid and non-destructive analysis with a limited number of samples with minimal pretreatment and without specific tech-niques. The thin-film FP analysis can simultaneously determine the [Ca]/[P] ratio in the CP-precipitate layer, the mass thickness of the layer; also, the thickness of the layer can be easily calculated from the mass thickness. We concluded that XRF analysis with the thin-film FP method would be highly suitable for evaluating the amount of CP precipitate formed on a Ti substrate in the simulated-body fluid immersion test.
Acknowledgements
The authors gratefully acknowledge Mr. Yamane and Mr. Tokuda of Kitami Institute of Technology, and Ms. Abe of
Tohoku University for technical supports of experiments. Part of this work was supported by a Grant-in-aid for Young Scientist (B) (20791460) from the Ministry of Education, Culture, Sports, Science and Technology of Japan.
REFERENCES
1) S. G. Steinemann: Evaluation of Biomaterials, (John Wiley & Sons Inc., New York, 1980) pp. 134.
2) H. Kawahara:Bull. Japan Inst. Met.31(1992) 10331039.
3) Y. Okazaki, S. Rao, T. Tateishi and Y. Ito: Mater. Sci. Eng. A243
(1998) 250256.
4) D. E. Steflik, R. S. Corpe, F. T. Lake, T. R. Young, A. L. Sisk, G. R. Parr, P. J. Hanes and D. J. Berkery:J. Biomed. Mater. Res.39(1998) 611620.
5) A. Nanci, J. D. Wuest, L. Peru, P. Brunet, V. Sharma, S. Zalzal and M. D. McKee:J. Biomed. Mater. Res.40(1998) 324335.
6) J. Pan, D. Thierry and C. Leygraf:J. Biomed. Mater. Res.30(1996) 393402.
7) C. Ohtsuki, H. Iida, S. Hayakawa and A. Osaka:J. Biomed. Mater. Res.
35(1997) 3947.
8) H. W. Kim, H. E. Kim and J. C. Knowles: Biomaterials25(2004) 33513358.
9) L. Tang, C. Tsai, W. W. Gerberich, L. Kruckeberg and D. R. Kania:
Biomaterials16(1995) 483488.
10) J. G. C. Wolke, K. de Groot and J. A. Jansen:J. Biomed. Mater. Res.39
(1998) 524530.
11) S. Vercaigne, J. G. C. Wolke, I. Naert and J. A. Jansen:J. Biomed. Mater. Res.41(1998) 4148.
12) X. Liu and C. Ding:Biomaterials23(2002) 40654077.
13) H. M. Kim, F. Miyaji, T. Kokubo and T. Nakamura:J. Biomed. Mater. Res.32(1996) 409417.
14) T. Kokubo and S. Yamaguchi:Materials3(2010) 4863.
15) A. Gupta, P. Majumdar, J. Amit, A. Rajesh, S. B. Singh and M. Chakraborty: Trends Biomater. Artif. Organs.20(2006) 8489. 16) A. Johnson, T. Shiraishi and K. H. Gillingham:J. Oral Sci.53(2011)
387391.
17) T. Kokubo and H. Takadama:Biomaterials27(2006) 29072915.
18) S. Yamaguchi, H. Takadama, T. Matsushita, T. Nakamura and T. Kokubo:J. Ceram. Soc. Jpn.117(2009) 11261130.
19) L. Jonášová, F. A. Müller, A. Helebrant, J. Strnad and P. Greil:
Biomaterials25(2004) 11871194.
20) N. Ohtsu, K. Sato, A. Yanagawa, K. Saito, Y. Imai, T. Kohgo, A. Yokoyama, K. Asami and T. Hanawa:J. Biomed. Mater. Res. Part A
82A(2007) 304315.
21) N. Ohtsu, K. Sato, K. Saito, K. Asami and T. Hanawa:J. Mater. Sci.: Mater. Med.18(2007) 10091016.
22) H. M. Kim, F. Miyaji, T. Kokubo and T. Nakamura:J. Ceram. Soc. Jpn.
105(1997) 111116.
23) H. M. Kim, F. Miyaji, T. Kokubo and T. Nakamura:J. Mater. Sci.: Mater. Med.8(1997) 341347.
24) J. Y. Ha, Y. Tsutsumi, H. Doi, N. Nomura, K. H. Kim and T. Hanawa:
Surf. Coat. Technol.205(2011) 49484955.
25) C. Abe, F. Sakamoto, N. Ohtsu, T. Ashino and K. Wagatsuma:Mater. Trans.50(2009) 22972301.
26) K. Sugiyama, J. W. Essel, T. Kitamura and Y. Waseda: Bull. Inst. Adv. Mater. Process. Tohoku Univ.48(1993) 140150.
27) X. Y. Han, S. J. Zhuo, R. X. Shen, P. L. Wang and A. Ji:J. Quant. Spectrosc. Radiat. Transfer97(2006) 6874.
28) J. A. M. Vrielink, R. M. Tiggelaar, J. G. E. Gardeniers and L. Lefferts:
Thin Solid Films520(2012) 17401744.
29) M. H. J. Bekkers and H. A. van Sprang:X-ray Spectrometry26(1997) 122124.
30) R. Sitko:Spectrochim. Acta Part B64(2009) 11611172.
31) M. Klenk, O. Schenker, U. Probst and E. Bucher:Sol. Energ. Mat. Sol. Cells.58(1999) 299319.
32) N. Ohtsu, Y. Nakamura and S. Semboshi: Surf. Coat. Technol.206
(2012) 26162621.
33) N. Ohtsu, S. Semboshi, C. Abe and S. Tokuda:Surf. Coat. Technol.
34) H. Takadama, H. M. Kim, T. Kokubo and T. Nakamura:J. Biomed. Mater. Res.57(2001) 441448.
35) H. M. Kim, T. Himeno, T. Kokubo and T. Nakamura:Biomaterials26
(2005) 43664373.
36) H. M. Kim, K. Kishimoto, F. Miyaji, T. Kokubo, T. Yao, Y. Suetsugu, J. Tanaka and T. Nakamura:J. Biomed. Mater. Res.46(1999) 228 235.
37) H. M. Kim, K. Kishimoto, F. Miyaji, T. Kokubo, T. Yao, Y. Suetsugu,
J. Tanaka and T. Nakamura:J. Mater. Sci.: Mater. Med.11 (2000) 421426.
38) S. Hiromoto and M. Tomozawa:Mater. Trans.51(2010) 20802087.
39) S. Hiromoto and A. Yamamoto:Electrochim. Acta54(2009) 7085 7093.
![Fig. 2Comparison of the atomic ratio of Ca to P ([Ca]/[P] ratio) in the CP-precipitate layer determined by ICP-OES, XRF with the thin-film FPmethod (TF-FP-XRF), and with the general FP method (FP-XRF).](https://thumb-us.123doks.com/thumbv2/123dok_us/319783.530738/4.595.317.537.70.360/comparison-atomic-precipitate-determined-lm-fpmethod-general-method.webp)