Simulation of the Si Precipitation Process in Mg
2Si Using a Phase-Field Kinetic
Model
Bin Liu
1, Teruyuki Ikeda
2and Yasushi Sasajima
2,3,*1Graduate School of Science and Engineering, Ibaraki University, Hitachi 316–8511, Japan
2Department of Materials Science and Engineering, Faculty of Engineering, Ibaraki University, Hitachi 316–8511, Japan 3Frontier Research Center for Applied Atomic Sciences, Ibaraki University, Tokai 319–1106, Japan
The Si precipitation process in an Mg2Si matrix has been simulated by the phase-field kinetic model, considering the eigen strain at the
interface between precipitates and the matrix. We observed that the shape of the precipitate changed during the course of heat treatment from circular to lenticular. As the Si precipitate grew larger, the adjacent precipitate aggregated to form a lamellar microstructure. This microstructure is suitable for thermo-electric materials because the scattering of phonons will frequently occur at the interface between the Si precipitates and the Mg2Si matrix. Our present simulation suggests drastic improvements of thermo-electric properties of this type of material are possible due
to the eigen strain. [doi:10.2320/matertrans.M2015479]
(Received January 6, 2016; Accepted March 16, 2016; Published April 22, 2016)
Keywords: Mg2Si, phase-field, precipitation, eigen strain, thermo-electric
1. Introduction
The conversion of waste heat into electrical energy plays a key role in current engineering challenges to develop alterna-tive energy technologies that reduce dependence on fossil fu-els and lower greenhouse gas emissions. One factor driving the interest in studying nano-composite thermo-electric (TE) materials is the need for safe, clean, and sustainable energy sources. Silicon has been attracting much attention because of its abundance in the earth s crust and its excellent TE prop-erties. Nano-silicon and silicide materials have become com-petitive TE materials.1) Mg2Si has excellent TE properties and it is the only stable compound in the Mg–Si binary sys-tem. Therefore, understanding the generation and growth pro-cesses of Mg2Si TE material precipitates is an important step in the study of thermal power systems.
A phase-field kinetic model can be used for simulating phase transition making it a very effective tool in material simulation. The morphology of second phase precipitation in many materials and alloys has been studied.2) For example, the phase-field model was used to simulate martensitic trans-formations in the polycrystalline phase based on the elasticity theory of Khachaturyan.3)
In this study, we simulated generation and growth process-es of Si precipitatprocess-es in Mg2Si matrix using a phase-field ki-netic model. The free energy of the system was expressed as the summation of Landau-type chemical free energy, gradient energy and elastic energy.4) Time development equations with respect to a concentration field and the structural order pa-rameter variables were deduced by the variation principle and solved numerically to simulate the microstructure evolution. We confirmed that a single Si particle changed its shape from circular to lenticular under the influence of the eigen strain of Si. We also simulated the microstructure evolution and con-cluded that finely dispersed Si nano-precipitates would im-prove the performance of TE materials.
2. Phase-Field Kinetic Model
In the present study, the phase-field simulation was con-ducted in a 2D space by using two structural field variables, s1 and s2. Both the diffusion and precipitation of Si were consid-ered. The time evolution of a microstructure was determined by solving the time dependent Ginzburg-Landau equations for si(r, t), (i = 1, 2) and the Cahn-Hilliard diffusion equation for c(r, t) as follows5,6)
∂c(r,t)
∂t =M∇2
δGsys
δc(r,t) (1)
∂si(r,t)
∂t =−Lp
δGsys
δsi(r,t) (2)
where M and Lp are kinetic coefficients characterizing struc-tural relaxation and surface diffusional mobility and Gsys is the free energy of the system. In order to solve the time evo-lution, the free energy of the system must be strictly defined. Details are given in the next section.
2.1 Free energy of the system
The free energy of the system may be expressed as Gsys=Gchem+Ggrad+Gstr (3)
where Gchem is the chemical free energy, Ggrad is the gradient energy, and Gstr is the elastic strain energy which is discussed in section 2.1.3 within the framework of the theory of elastic-ity.
2.1.1 Chemical free energy
In the phase-field model, a microstructure is described by a set of spatially dependent field variables. The structure and composition of the precipitate phase (Si) and the parent phase (Mg2Si) can be studied. These different characteristics can be described by using a composition field variable c(r, t), and the occurrence probability of precipitates, si(r, t), where the sub-script i (i = 1, 2) represents the different kinds of orientation to the matrix.
The growth of Si precipitates is driven by the difference in *
chemical free energy and the volume fraction of Si precipi-tate. In the present model, we described the chemical free en-ergy density approximately using a Landau-type of free ener-gy polynomial as2)
Gchem(c,s1,s2)=A21(c−C1)2+A22(c−C2)(s21+s22)
−A23(s4 1+s42)+
A4 2 (s
6 1+s62)
+A5s21s22+A6(s41s22+s21s42)
(4)
where C1 and C2 are the constants close to Si concentration in the Mg2Si matrix and of the Si phase, respectively, and their values were chosen as C1 = 0.33 and C2 = 1. For the present case of Si precipitation in the matrix, the coefficients in eq. (4) were chosen as A1 = 148, A2 = −8, A3 = 118.5, A4 = 2.7, A5 = A6 = 0.2. The process to determine these parameters is as fol-lows.
The temperature 973 K was chosen because an actual ex-periment has already been done at this temperature.1) At this temperature, the Gibbs free energy of pure Mg2Si and Si was calculated by utilizing Gibbs energy function for pure sub-stance and we found that ∆(GSi−GMg2Si) = 5493 J/mol.7,8) The unknown Gibbs free energies of the Mg2Si and Si phases as a function of silicon concentration, c, should have the min-imum at c = 0.333 and c = 1, respectively. For the Gibbs free energies of the Mg2Si and Si phases as a function of silicon concentration, the two simple quadratic forms, which have the energy difference ∆(GSi−GMg2Si) = 5493 J/mol and com-mon tangent at c = 0.333 and c = 1, were assumed. The pa-rameters in eq. (4) were determined to reproduce the quadrat-ic Gibbs free energies of the Mg2Si and Si phases as a function of silicon concentration by using a mathematical fitting tool.
From eq. (4), the variation of Gchem with respect to si is given by
δGchem δsi
=si{A2(c−C2)−A3s2i +A4s4i
+2A5s2j+2A6(2s2is2j+s4j)}(i j).
(5)
2.1.2 Gradient energy
According to the Spinodal decomposition theory, the gra-dient energy density term, Ggrad can be expressed as9,10)
Ggrad= 12Ks r
[(∇s1)2+(∇s2)2]dr+12Kc r
(∇c)2dr (6)
where Ks, Kc is the coefficient of the gradient energy. The variation of Ggrad with respect to si and c is given by
δGgrad
δs1(r) =−Ks∇
2s 1, δ
Ggrad
δs2(r) =−Ks∇
2s 2, δ
Ggrad
δc(r) =−Kc∇2c.
(7) 2.1.3 Elastic energy
The elastic energy is caused by lattice mismatch between the Si-precipitate and Mg2Si matrix. According to Khachatu-ryan s theory, the elastic energy can be expressed as follows:
Gst=12 r
ci jkl(r,t){εci j(r,t)−ε0i j(r,t)}{εckl(r,t)−ε0kl(r,t)}dr
(8)
εci j(r,t)=εi j−c(t)+eci j(r,t) (9)
where cijkl(r, t) is elastic constant, εci j(r,t) is total strain, and ε0i j(r,t) is eigen strain. The spatial mean ε−i jc(t) and variation ec
i j(r,t) are included in the total strain. The boundary
condi-tion is stress free, so that the system can expand and contract. Then the spatial mean of strain tensor ε−i jc can be obtained from
δGstr
δε−i jc =0. (10)
The eigen strain is given by
ε0i j(r,t)=ε0i j(1)s2
1(r,t)+ε0i j(2)s22(r,t) (11) where the eigen strain tensor matrix can be represented as
ε0i j(1)= −0.00971 0
0 0.0396
ε0i j(2)= 0.0396 0
0 −0.00971
(12)
from the experimental observation of semi-coherent interface between Si and Mg2Si in the form of a thin film (see Fig. 3 in Ref. 11)). According to the observation, the semi-coherent interface was such that Si (111) // Mg2Si (110), Si [1¯10] // Mg2Si [1¯10] and Si [11¯2] // Mg2Si [00¯1]. In addition, every seven Si {2¯20} atomic planes, there were six Mg2Si {2¯20}
planes. From the lattice parameters of Mg2Si (a = 0.635 nm) and Si (a = 0.539 nm), we estimated the mismatch strains at the interface as −0.971% in the Si [1¯10] direction and 3.96% in the Si [11¯2] direction. Then we set the x and y directions as the Si [1¯10] // Mg2Si [1¯10] and Si [11¯2] // Mg2Si [00¯1] direc-tions, respectively. The values of the elastic constants of Mg2Si are C11 = 121.37 GPa, C12 = 20.28 GPa, and C44 = 46.78 GPa for the normal crystal orientation.12) By the trans-formation from the normal orientation to the present orienta-tion, we used the values as C11 = 138 GPa, C12 = 61 GPa, and C44 = 116 GPa. In the present study, we used only the elastic constants of Mg2Si to simplify the calculation; this approach has been used in the case of the precipitation of θ′ phase in Al
matrix4). Si precipitate is harder than Mg2Si matrix by about 20–30%. According to the simulation of Hu et al.13), such dif-ference does not alter the obtained conclusion (see Fig. 12 in Ref. 13)). From eq. (8), the variation of Gstr with respect to sp is given by
δGstr
δsp =2sp(ci jkl(r,t)ε
0
i j(p)ε0kl(r,t)
−ci jkl(r,t)ε0kl(p)εci j(r,t)) (p=1,2). (13)
2.1.4 Simulation conditions
com-paring to an actual experiment as shown in the discussion. As the seeds of Si precipitates, 98 circular areas, with a radial 3.5 grid, were randomly chosen and the values of s1 within the seeds were all set to be 1. It may seem to be curious why only the values of s1 were set. Our purpose is to obtain a lamellar microstructure in which the scattering of phonons will occur frequently at the interface between the Si precipitates and Mg2Si matrix for high performance TE material. If s1 and s2 were both set to be 1 as nucleus, our preliminary simulation showed that they interrupt each other during the growth pro-cess, leading to an undesirable structure. However, in the case of mixed nucleus of s1 and s2, the growth of only s1 variant can be achieved by utilizing unidirectional stress on the spec-imen as shown in Ref. 4), that a supersaturated Al-Cu system under unidirectional compressive stress gives the preferential growth of θ′ precipitation along the direction of applied stress.
Taking into account of this effect, we have chosen only s1 as nucleus for the first step to the research. The simulation of the case of mixed nucleus of s1 and s2 under unidirectional stress will be performed in the subsequent research.
3. Results and Discussion
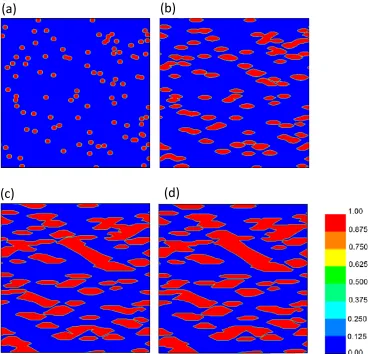
Figure 1 shows the microstructure evolution of Si precipi-tates in Mg2Si matrix: (a) at the 120 time step, (b) at the 1200
time step, (c) at the 3600 time step and (d) at the 6000 time step. We simulated the precipitation process of pure Si in Mg2Si matrix, and for the Si precipitation, s1 were set to be 1, while for Mg2Si matrix, s1 were set to be 0. The inserted color scale represents the value of s1 which represents the occur-rence probability of Si precipitates. That means, the locations colored by red (s1 = 1) are occupied by pure Si precipitates, and those colored by blue Mg2Si matrix. The precipitate shape clearly changed during the course of heat treatment from that of circular to lenticular. As the Si precipitate grew larger, adjacent precipitates aggregated to form lenticular shaped precipitates. This was mainly due to the fact that the elastic energy is a crucial factor to decide the morphology of the Si precipitates.
From Fig. 2 we can see how a single circular Si precipitate changed its shape under the influence of eigen strain by com-paring it to the case without eigen strain. Figure 2(c) shows the shape change of the Si precipitate from the circular shape presented in Fig. 2(a) to the lenticular shape under the influ-ence of eigen strain, while the case without eigen strain showed no change in shape (Fig. 2(b)). The antisymmetric shape for the case with eigen strain was due to the anisotropy of the elastic energy.
In an actual experiment, Ikeda et al. have formed the na-no-composite structure of the Mg2Si-Si system and confirmed
Fig. 1 Microstructural evolution of the Mg2Si-Si binary system: (a) at the 120 time step, (b) at the 1200 time step, (c) at the 3600 time step and (d) at the
6000 time step. The inserted color scale represents the value of s1 which represents the occurrence probability of Si precipitates. That means, the locations
[image:3.595.113.482.396.750.2]that the spherical Si particles dispersed in the entire region by field-emission scanning electron microscopy and transmis-sion electron microscopy (see Fig. 3 in Ref. 1)). From the comparison of the actual experiment, a time step can be esti-mated to be 0.4 second and the length of the system shown in Figs. 1 and 2 is about 600 nm and 150 nm, respectively.
Our simulation result suggests that the lamellar micro-structure can be obtained in this system by utilizing effective-ly the eigen strain, leading to more efficient TE material. The performance for thermoelectric energy conversion is charac-terized by the figures of merit ZT(≡S2σT/κ), where S is
See-beck coefficient, σ the electrical conductivity, T the absolute temperature and κ the thermal conductivity. In this study, it can be considered that the precipitated Si particles formed semi-coherent interface under the influence of the eigen strain. Due to the semi-coherent interfaces, the phonon scat-tering enhances while electron scatscat-tering remain almost un-changed, leading to that κ decreases and σ stays unchanged in the figures of merit ZT. Thus, the lamellar microstructure could improve the thermoelectric properties of the Mg2Si ma-terials.
At the present study, the comparison with experimental work is done only in the respect of the form of the precipitat-ed particles. We have focusprecipitat-ed on the effect of eigen strain on the form of the precipitated particles and have found that the precipitated particles in the actual experiment are round shaped and stress-free. Therefore we propose that the lenticu-lar shaped precipitation can be achieved by utilizing eigen strain at the interface between Si precipitation and Mg2Si ma-trix. This is crucial, however, it should be noticed that the structure shown in Fig. 1 was obtained assuming that Si pre-cipitation with fixed orientation in single crystal of Mg2Si. To utilize the eigen strain effect in actual experiment, we pro-pose the sintering under hot press with free boundary condi-tion for pre-sintered specimen. We will report such experi-ments in the subsequent paper.
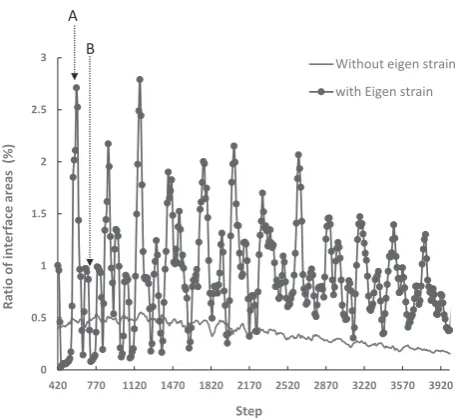
Figure 3 shows the time change of the ratio of interface area with and without eigen strain. The definition of interface area is as follows. We use a 256 × 256 simulation uniform square grid and every grid has a value of s1. The value of the pure Si precipitate is 1 and that of pure Mg2Si matrix is 0. It should be noted that the s1 values at interface change contin-uously between 0 and 1, so we defined the value of s1 for the interface area as 0.4–0.7. The ratio of the number of grids at interface to the total number of grids 256 × 256 is the
inter-face area ratio.
When the system had eigen strain, larger fluctuation of the ratio of interface area was seen, with the maximum value be-ing 2.79%. The interface growth rate gradually decreased with time because of the lack of Si atoms. Figures 4 (a) and Fig. 2 Time change of the shape of a Si precipitate from a circular one: (a) at the 0 time step, (b) at the 6000 time steps without eigen strain and (c) at the
6000 time steps with eigen strain. The inserted color scale is the same as in Fig. 1.
Fig. 3 Time change of the ratio of interface areas with and without eigen strain.
Fig. 4 Region around a Si precipitate arbitrarily selected from the system: (a) at the 590 time step (A in Fig. 3) and (b) at the 650 time step (B in Fig. 3). The inserted color scale is the same as in Fig. 1. The red zone is Si, the blue zone is the Mg2Si matrix, and the zone with intermediate
color between red and blue is the interface of Si precipitates and Mg2Si
[image:4.595.312.541.245.454.2] [image:4.595.304.548.510.628.2](b) show the regions around a Si precipitate arbitrarily select-ed from the system at two time steps, 590 and 650. We con-sider that the large fluctuation of the interface area for the case with eigen strain is crucial, not caused by numerical er-ror. From Fig. 4, the origin of high fluctuation of the interface area is due to the oscillation of growth front along s1 variant, i.e. the origin of apexes of lenticular precipitate.
4. Conclusion
We simulated the Si precipitation process in Mg2Si matrix by the phase-field method, considering the eigen strain at the interface between precipitates and the matrix. We observed that the shape of the precipitate changed during the course of heat treatment from circular to lenticular. As the Si precipita-tion grew larger, the adjacent precipitates aggregated to form a lamellar microstructure. This is mainly due to the fact that the elastic energy is a crucial factor to decide the morphology of the Si precipitates. This microstructure is suitable for TE materials because the scattering of phonons will occur fre-quently at the interface between the Si precipitates and Mg2Si matrix. Our present simulation suggested drastic improve-ments of TE properties of this type of material would be pos-sible because of the eigen strain.
Acknowledgements
This work was supported by JSPS KAKENHI Grant Num-ber 26289246.
REFERENCES
1) T. Ikeda, L. Haviez, Y. Li and G.J. Snyder: Small 8 (2012) 2350–2355.
2) L.Q. Chen: Ann. Rev. Nucl. Sci. 32 (2002) 113–140.
3) H. K. Yeddu: Doctoral thesis, KTH Industrial Engineering and Man-agement, Stockholm, Sweden, 2012.
4) D.Y. Li and L.Q. Chen: Acta Mater. 46 (1998) 2573–2585.
5) Y. Sasajima: J Jpn Inst. Light Metals 54 (2004) 192–202. 6) T. Koyama: J. Inst. Met. 42 (2003) 397–404.
7) A.T. Dinsdale: Calphad 15 (1991) 402–403.
8) M. Schick, B. Hallstedt, A. Glensk, B. Grabowski, T. Hickel, M. Ham-pl, J. Gröbner, J. Neugebauer and R. Schmid-Fetzer: Calphad 33 (2012) 673–678.
9) J. E. Hilliard, Phase Transformation, ed. by H. I. Aaronson: (American Society for Metals, Metals Park, OH, 1970) pp. 497–560.
10) T. Koyama: J. Inst. Met. 48 (2009) 508–514.
11) X.N. Wang, Y. Wang, Z.X. Mei, J. Dong, Z.Q. Zeng, H.T. Yuan, T.C. Zhang, X.L. Dua, J.F. Jia, Q.K. Xue, X.N. Zhang, Z. Zhang, Z.F. Li and W. Lu: J. Appl. Phys. Lett. 90 (2007) 151912.