ORIGINAL ARTICLE
Emission from quantum-dot high-
β
microcavities:
transition from spontaneous emission to lasing and
the effects of superradiant emitter coupling
Sören Kreinberg
1, Weng W Chow
2, Janik Wolters
1, Christian Schneider
3, Christopher Gies
4, Frank Jahnke
4,
Sven Hö
fl
ing
3,4, Martin Kamp
3and Stephan Reitzenstein
1Measured and calculated results are presented for the emission properties of a new class of emitters operating in the cavity quantum electrodynamics regime. The structures are based on high-finesse GaAs/AlAs micropillar cavities, each with an active medium consisting of a layer of InGaAs quantum dots (QDs) and the distinguishing feature of having a substantial fraction of spontaneous emission channeled into one cavity mode (high β-factor). This paper demonstrates that the usual criterion for lasing with a conventional (low β-factor) cavity, that is, a sharp non-linearity in the input–output curve accompanied by notice-able linewidth narrowing, has to be reinforced by the equal-time second-order photon autocorrelation function to confirm lasing. The paper also shows that the equal-time second-order photon autocorrelation function is useful for recognizing super-radiance, a manifestation of the correlations possible in high-β microcavities operating with QDs. In terms of consolidating the collected data and identifying the physics underlying laser action, both theory and experiment suggest a sole dependence on intracavity photon number. Evidence for this assertion comes from all our measured and calculated data on emission coherence and fluctuation, for devices ranging from light-emitting diodes (LEDs) and cavity-enhanced LEDs to lasers, lying on the same two curves: one for linewidth narrowing versus intracavity photon number and the other for g(2)(0) versus intracavity photon number.
Light: Science & Applications(2017)6,e17030; doi:10.1038/lsa.2017.30; published online 25 August 2017
Keywords: coherence, laser physics, microlasers, nanolasers, optoelectronics, photon statistics, quantum dots, quantum optics
INTRODUCTION
The question,‘What is a laser?’has been a long-standing subject of discussion1. For example, during the 1970s, there was much debate
over whether the X-ray laser was really a‘laser’given the poor or non-existent resonator. Currently, the question is resurfacing for an entirely different reason. With micro- and nanocavities producing high Q-factors and close to complete channeling of all spontaneous emission into a single cavity mode (bt1), cavity quantum electro-dynamic (cQED) effects may be present to the extent that the concepts of lasing action and verification have to be reexamined2–5.
The development of low-threshold micro- and nanolasers has become an important interdisciplinary research topic in recent years, encompassing epitaxy growth and lithographic chemistry, spectro-scopic and photon correlation measurements, as well as quantum optics and quantum electronics6,7. Research has been conducted for
multiple material systems, ranging from III–V and III-nitride com-pounds to silicon8. Even emerging two-dimensional materials have been applied as active media for nanolasers9. Cavity designs for
photonic lattices, micropillars and plasmonic cavities embedding bulk,
quantum-well and quantum-dot (QD) gain materials are being explored10,11.
There is considerable activity focusing on high-βlasers because of the potential to exceed present limits on lasing threshold, modulation speeds and spatial footprint. Advances are being made in geometrical waveguiding and in enhancing performance by quantum optical effects, such as the Purcell effect12. The interest in using high-β
cavities extends beyond lasers to light-emitting diodes (LEDs), for applications such as high-efficiency lighting, and to single-photon sources, for quantum information processing13,14. In research
applica-tions, high-β emitters provide experimental platforms to study the intricate interplay between classical cavity-mode confinement and quantum optics15–17.
Along with the exciting progress achieved in device performance and in realizing application potential, there is a vivid debate on the precise definition and verification of lasing in high-β emitters18-23.
Particular controversy exists regarding the limiting regime involving the interesting prospect of thresholdless lasing24,25. Indeed, with an
increasing β-factor, it becomes more difficult to find a definitive
1Institut für Festkörperphysik, Technische Universität Berlin, Berlin 10623, Germany;2Sandia National Laboratories, Albuquerque, NM 87185-1086, USA;3Lehrstuhl für
Technische Physik, Universität Würzburg, Würzburg 97074, Germany;4School of Physics and Astronomy, University of St Andrews, St Andrews KY16 9SS, UK and5Institute for
Theoretical Physics, University of Bremen, Bremen 28334, Germany Correspondence: WW Chow, E-mail: [email protected]
transition in device output intensity from being dominated by spontaneous emission to being governed by stimulated emission. Such a transition has long been accepted as the characteristic signature of lasing.
Usually, lasing in a high-β emitter is claimed when there is noticeable linewidth narrowing (or coherence time increase) accom-panied by an intensity output versus input curve (often with output in arbitrary units) that does not show a pronounced‘S’shape on a log– log plot26–30. In this paper, we reinforce earlier investigations
indicat-ing that these two pieces of information are insufficient proof for lasing19. We measure and model the excitation dependencies of the
intensity, linewidth and second-order photon autocorrelation of emitters operating purely as LEDs, as lasers and as cavity-enhanced LEDs. The emitters consist of AlAs/GaAs micropillar cavities with InGaAs QD gain regions. Many of the devices show input–output curves and linewidth narrowing that satisfy the generally accepted criteria for lasing in high-β cavities. However, measurements of second-order photon autocorrelation indicate distinctly different statistical properties of the emitted photons.
Photon correlations have been largely ignored by the laser engineering community in regard to characterizing devices. In addition to the demanding time and equipment requirements, this measurement is unnecessary for emitters operating with conventional resonators. The customary lasing criterion is the appearance of a noticeable kink in a log–log plot of output versus input power. For further confirmation, one looks for a sharp increase in linewidth narrowing in the vicinity of the input–output jump. However, the abruptness of these signatures diminishes in high-βlasers, with the input–output jump disappearing altogether and the linewidth narrow-ing not approachnarrow-ing the Schawlow-Townes linewidth in the limit of 'thresholdless' lasing31–34. This difference makes for much discussion
when distinguishing between high-β lasing and the effects from nonlinearities (for example, from saturation or state filling) in a non-lasing,βoo1 emitter.
In contrast to laser engineering, the quantum optics community has long studied photon statistics, which are customarily gauged by the equal-time second-order photon autocorrelation function g(2)(0)19,34–36. Specifically, when g(2)(0) reduces from 2 to 1, the
emitted light transitions from spontaneous emission dominated to predominately stimulated emission. This change from thermal to coherent emission serves as a reliable indicator for lasing.
Following this introduction, we describe the experimental devices and setup for performing the systematic measurements of emission intensity, coherence and photon correlations, together with an over-view of the theoretical approach to model the quantum optics of nanoemitters. Results are presented in the form of output intensity,
emission linewidth and g(2)(0) versus optical pump power. The
measured micropillar emitters have Q-factors varying from 8000 to 35 000 andβ-factors from 0.2 to 0.4. In terms of the number of QDs within the entire inhomogeneously broadened distribution that interact with the radiation field, our simulations indicate a range from 5 to 40. Analyses of the experiments, using the cQED model, show a commonality among the devices in the form of a relationship betweeng(2)(0) and the intracavity photon number in the lasing mode.
The origin of this link, which comes directly from the laser field quantization, will be discussed, together with a quantitative connection between linewidth narrowing andg(2)(0).
MATERIALS AND METHODS
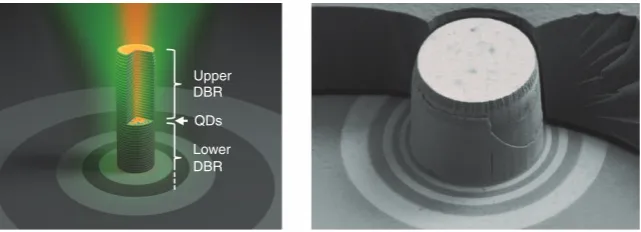
[image:2.595.147.468.584.700.2]This section describes the emitter fabrication and measurement setup used to study emission from low-mode-volume, high-βmicropillars. Employing electron-beam lithography and plasma reactive ion etching, each free-standing micropillar is processed from the same planar high-Q microcavity consisting of a lower and an upper AlAs/GaAs distributed Bragg reflector (DBR) with 25 and 30 layer pairs, respectively, and a single layer of InGaAs QDs as the active medium (Figure 1). The structures were planarized by the polymer benzocy-clobutene (BCB) for mechanical stability and to suppress oxidation of the AlAs layers in the DBRs. Owing to a slight radial asymmetry in heterostructure layer thicknesses, different locations on the epitaxial wafer produce micropillars with different detuning between the fundamental cavity mode and QD resonance, thus allowing for control of modal gain. In addition, by varying micropillar diameters, we can influence the Purcell enhancement of spontaneous emission and thus theβ-factor via its dependence on the modal volume and cavity Q-factor. In this way, we are able to fabricate emitters showing only luminescence (LED behavior), cavity-enhanced spontaneous emission, and high-β lasing. Details of the micropillar layout and processing have been previously reported37.
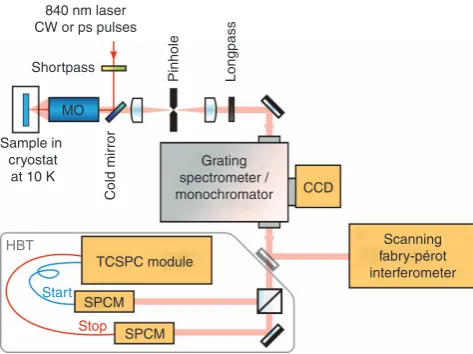
Figure 2 is a schematic representation of the spectroscopic measurement setup. Experiments are performed at 10 K by mounting the micropillar sample on a cold-finger of a liquid-helium flow cryostat. Continuous wave (cw) excitation is provided by an external-cavity laser tuned to 840 nm, which resonates with the wetting layer of QDs in the active region.μPL emission spectra are measured using either a grating spectrometer with a spectral resolution of 25μeV or a scanning Fabry–Pérot interferometer with a free spectral range of 30μeV and a spectral resolution of 0.5μeV. The second-order photon autocorrelation function is measured using afiber-coupled Hanbury Brown and Twiss (HBT) configuration equipped with Si-avalanche photodiode-based single-photon counting modules (SPCMs) with temporal resolutions of 260 ps.
Upper DBR
DBR QDs
Lower
Figure 1(left) Artist’s impression of an optically pumped QD micropillar consisting of two GaAs/AlAs distributed Bragg reflectors (DBRs) and QDs on a wetting layer. (right) SEM image of an 8μm diameter micropillar, where part of the planarizing BCB layer (visible in the background) was mechanically removed to show the layers comprising the micropillar’s DBRs. SEM, scanning electron microscopy.
A cQED model is used to compute the intracavity photon number, emission linewidth and second-order intensity correlation function for different pump powers and QD-micropillar configurations. The model is derived in the Heisenberg picture using a cluster expansion method to obtain a closed set of equations of motion for the polarization p, photon population np and electron (hole) carrier population
ne(nh)36,38,39.
dp
dt¼ ðgþgcÞpþg nenhþðneþnh1Þnp
ð1Þ
dnp
dt ¼2gNQDRe pð Þ 2gcnp ð2Þ
dns
dt ¼ 2gRe pð Þ gnlnenhgnrnsþ ZP _op
1ns
ð Þ ð3Þ
where the subscript σ=e (h) labels the electron (hole). Input parameters are the dephasing rate γ, the cavity photon decay rate 2γc, the spontaneous emission rate into non-lasing modesγnland the
nonradiative carrier-loss rateγnr. The light–matter coupling coefficient
is
g¼Y ffiffiffiffiffiffiffiffiffiffi
n _EbV
r
WðRQDÞX n
C Rð Þn V Rð Þn ð4Þ
whereYis the bulk material dipole matrix element,vis the laserfield frequency, V is the optical mode volume, Eb is the background
permittivity, W is the amplitude of the passive optical mode eigenfunction atRQD, which is the location of the QDs within the
optical cavity and the summation involves the overlap of the electron and hole envelop functionsC(Rn) andV(Rn) over all unit cells within the active region. The last term in Equation (3) contains the laser pump powerP, photon energy_opand carrier injection efficiencyη,
which accounts for the fraction of photoexcited carriers that actually end up populating the QD levels. Finally,NQDis the number of QDs
within an inhomogeneously broadened active medium that are resonant with the microcavityfield.
Initial modeling was performed using a nonequilibrium model, in which the gain region is assumed to consist of an inhomogeneous distribution of QDs, a quantum-well wetting layer and injection pumped bulk regions36. The model enables the description of spectral
hole burning, plasma heating and population bottleneck, in terms of carrier–carrier and carrier–phonon scattering. These simulations led us to believe that this approach is overly complicated for the present problem because at a sufficiently low temperature the QD states are less coupled to the quantum well and, to a good approximation, the QDs interacting with the radiation field may be treated alone. Therefore, the present model tracks only those QD states and approximates all carrier transport effects via an injection efficiency, which is determined byfitting to experiment. This approach is closer to the earlier rate-equation treatments18,40, except that we extended the derivation to include the linewidth and intensity correlation.
For the emission linewidth and equal-time second-order intensity correlation function, we use Do¼2RNNdtgð Þ1ð Þt21and gð Þ2ð Þ ¼0 /bwbwbbS=n2
p, respectively, where gð Þ1ð Þ ¼t /bwbð ÞtS=np,
and the correlations /bwbð ÞtS and /bwbwbbS, involving photon annihilation and creation operators b and b†, are evaluated under a stationary condition by solving the next level of equations of motion in the cluster expansions for Gð1Þð Þ ¼t /bwbð ÞtSeint and Pð Þ ¼t /bwvwð Þtcð ÞtSeint:
dGð1Þ dt ¼ gcG
1
ð Þþ2gN
QDRe Pð Þ ð5Þ
dP
dt¼ ðgþgcÞPþg nð eþnh1ÞG
ð1Þ ð6Þ
Wherev†creates an electron in the lower QD state andcannihilates an electron in the upper QD state. For the equal-time second-order correlation
bwbwbb
, we solve
dd/bwbwbbS
dt ¼ 4gcd/a wawaaS
þ4gNQDRe d/bwbwbvwcS
;
ð7Þ
dd/bwbwbvwcS
dt ¼ ðgþ3gcÞd/bwbwbvwcSþg nð eþnh1Þd/bwbwbbS
þ2g nh þnpd/bwbcwcSneþnpd/bwbvwvS2gp2
ð8Þ
dd/bwbcwcS
dt ¼ 2gcd/b
wbcwcS2gRe n eþnp
pþd/bwbwbvwcS
ð9Þ
dd/bwbvwvS
dt ¼ 2gcd/b
wbvwvSþ2gRe n
hþnp
pþd/bwbwbvwcS
ð10Þ Furthermore, for some emitters, the electron-hole polarization receives contributions from carrier correlations such asd/vwcwcvS, which give rise to coherence phenomena such as subradiance and superradiance. These correlations modify the input–output andgð Þ2ð Þ0 behaviors of an emitter,
as will be discussed in the next section41–44.
Finally, theβ-factor is computed from the rates of emission into the laser mode and into non-lasing modes according to the system
840 nm laser CW or ps pulses
Shortpass
MO
Sample in cryostat
at 10 K
TCSPC module
Stop
Start HBT
SPCM
SPCM
CCD
Scanning fabry-pérot interferometer Grating
spectrometer / monochromator
Pinhole Longpass
[image:3.595.41.278.68.245.2]Cold mirror
parameters
b¼ 2gRe p 0
ð Þ
2gRe pð Þ þ0 gnlnenh ð
11Þ
where we use the steady-state solution of dp0=dt¼gnenh.
RESULTS AND DISCUSSION
In this section, we present the results of measuring and modeling the
five micropillars A–E. Table 1 lists the device parameters relevant to
emission properties. The Q-factors in column 3 are obtained directly from experiment via dividing the measured emission energy by the spectral linewidth at the low-excitation plateau region (Figure 4). These Q-values are used in the modeling where they enter into equations (1) and (2) asn=Q¼2gc, the cavity photon lifetime due to outcoupling and background absorption. Theβ-factor and number of QDs resonant with the lasing-mode resonanceNQDare extracted by
simultaneously fitting the theoretical and experimental curves for intensity and linewidth versus pump power. We note that given the areal density of QDs (2 × 109cm−2), the micropillar diameter
determines the absolute number of QDs in the active layer. The effective number of QDs NQDalso depends on the spectral overlap
between the resonator mode and the inhomogeneously broadened QD emission band, which explains, for example, whyNQDis higher for
emitter A than for emitter B, which has a larger diameter. Two of the devices (micropillars A and B, with 1.7 and 2.0μm diameters, respectively) operate purely as LEDs; one exhibits behaviors of a cavity-enhanced LED (micropillar C, with 2.0μm diameter); the remaining two are lasers (micropillars D and E, with 2.5μm diameters), with micropillar E exhibiting subradiance and then
superradiance emission during the transition from spontaneous emission to lasing. The assignments are based on the combination of emission properties shown in Figures 2, 3 and 5, which we will discuss in the remainder of this section.
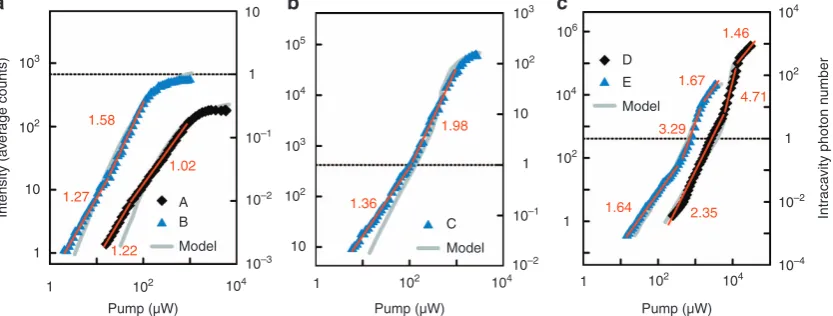
First, we look at the steady-state input–output relationship, which is an expedient and therefore frequently employed method to demon-strate lasing in conventional (βoo1) lasers. In Figure 3, the data points are from experiments, and the gray curves are computed using the cQED model. The matching of experimental and theoretical curves enables the extraction of the spontaneous emission rate into non-lasing modes γnl, the effective QD number NQD and the carrier
injection efficiency η for each micropillar. The comparison also provides a calibration for the detector setup, enabling the conversion of detector counts over the integration period to intracavity photon numbers in the lasing mode (left and right ordinates in the top row of Figure 3). Using the conversion, the average intracavity photon number np reaches an excess of unity for emitters C, D and E, whereasnpmaximizes below unity for the non-lasing emitters A and B
at saturation.
For low excitation, all five emitters have highly similar, slightly super-linear pump–power dependences, which we quantify byfitting toIpPr, whereIandPare intensity and pump power, respectively. The power law exponentrfor separate portions of each input–output curve is given in Figure 3. At higher excitations, the input–output dependence separates into strong saturation for the LEDs A and B and nonlinear increase for the lasers D and E, and emitter C, the cavity-enhanced LED. The nonlinear increase, which signals the onset of stimulated emission, is considerably less pronounced than for conventional low-β lasers. As a result, it is necessary to look for further lasing confirmation in high-βsituations.
Currently, further confirmation of lasing often comes from the presence of a noticeable decrease in emission linewidth with increasing excitation. With conventional cavities where βoo1, the onset of linewidth narrowing occurs abruptly at the lasing threshold and typically scales inversely proportional with the excitation strength, consistent with the Schawlow-Townes description33. Alternatively, it is
[image:4.595.51.300.413.493.2]reported that with largeβ, the narrowing is less pronounced and then becomes indiscernible in the limiting case ofβ=120–25.
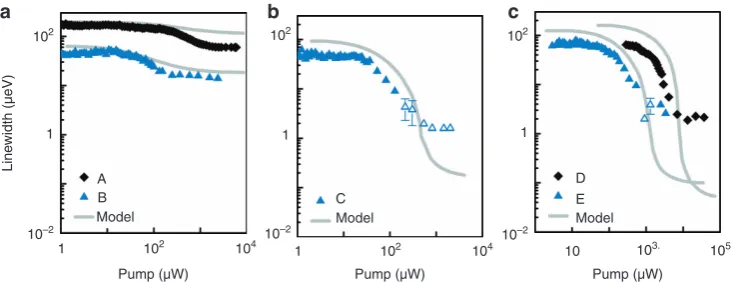
Figure 4 shows plots of the emission linewidth versus pump power for
thefive emitters. The data points are measured results obtained from a
scanning Fabry-Pérot interferometer or from the decay time ofg(2)(τ).
Table 1 Parameters for micropillars A–E used in the study
∅(μm) Q β NQD
A 1.7 8300 0.40 10
B 2.0 32 100 0.37 6
C 2.0 32 100 0.37 15
D 2.5 22 800 0.23 60
E 2.5 24 900 0.72 40
Abbreviation: QD, quantum dot.
The columns are (left to right) micropillar diameter, cavity Q-factor, spontaneous emission factor and effective number of QDs interacting with the cavityfield.
103
a b c
1.58
1.02
1.98
1.36 1.64
2.35 3.29
1.67 1.46
4.71
1.27
1.22
103
103
104 10–3
10–2
10–2
10–2 10–4
Intr
aca
v
ity photon n
u
mber
10–1
10–1
102
Intensity (a
v
e
ra
ge counts)
104 104
104 106
105
102
102
Model
Model Model
D
C
E
A B
102
102
102
Pump (µW) Pump (µW) Pump (µW) 10
10
10 10
1
1
1
1 1 102 104 1 102 104
1
1
Figure 3 Input–output characteristics of QD-micropillar emitters for (a) LEDs, (b) cavity-enhanced LED and (c) lasers. The data points are from experiment and the gray curves are from theory. The left ordinate is the average detector counts over the integration period, and the right ordinate is the calculated average intracavity photon numbernpin the lasing mode. The dashed lines indicate the nominal lasing determined bynp=1. The red numbers and lines indicate power law exponents and curves, respectively, as described in the main paper.
[image:4.595.99.516.534.692.2]First, the low pump–power plateaus show that emitters B, C, D and E have similar passive cavity linewidths of approximately 40–70μeV, whereas emitter A has a larger passive cavity linewidth of approximately 140μeV, indicating larger optical losses in this smallest diameter micropillar. With increasing pump power, emitters A and B show only slight decreases in linewidth, which support their assignments as LEDs. The linewidth reduction is partially from an increase in the amplified spontaneous emission, which the model describes (gray curves in Figure 4a), and partly from saturation of absorption losses, which the model does not take into account. Figures 4b and 4c indicate appreciably greater linewidth narrowing for emitters C, D and E. The reduction of over two orders is due mostly to the onset of stimulated emission, which is reproduced relatively well by the model. A discrepancy between theory and experiment arises at high excitation, with the theoretical curves indicating significantly narrower linewidths than those observed experimentally. The measured linewidths are not spectrometer resolu-tion limited, but they may contain contriburesolu-tions from spectral fluctuations and temperature-induced jitter at a timescale smaller than the sweep time (50 ms per free spectral range) of the scanning Fabry–Pérot interferometer. Interestingly, the calculated minimum linewidth of approximately 0.1μeV, which translates to a coherence time of 13ns, matches well with the coherence time of≈20 ns reported for a similar QD-micropillar laser45.
Other than the discrepancy possibly caused by the scanning Fabry-Pérot interferometer measurement sweep time, the cQED model generally agrees with the experiment. The data points and curves in Figure 3 show noticeable but acceptable differences. Varyingγnl,NQD
andηto obtain better linewidth agreement would degrade the good agreement of the input–output curves. We choose not to adjust the dephasing associated with/bwbð ÞtS, which will change the linewidth independently of input–output behavior, but rather to base all effective scattering rates on reported results from experiments or quantum-kinetic calculations39,46,47. For the same reason, the polarization
dephasing γ is not treated as a free parameter in our curvefitting. Furthermore, the model neglects that for high-Q cavities there may be excitation-dependent bleaching of absorption, which will result in a narrower linewidth48.
The remaining task to perform is distinguishing between lasing and amplified spontaneous emission; both phenomena exhibit highly similar excitation dependences on emission intensity and linewidth (compare Figures 3b and 4b with Figures 3c and 4c). A concern is that the plots in Figure 3b and 4b may easily be mistaken as evidence for lasing in an idealβ=1 device because they show appreciable linewidth narrowing and a basically straight log–log input–output curve. To definitively separate laser and cavity-enhanced LED operation, it is necessary to examine the equal-time intensity correlationg(2)(0). In recent years, there has been a considerable effort to improve techniques and equipment for determining g(2)(0) because of the
102
a b c
Line
width (
µ
eV)
102 104
10–2 10–2
10–2 1
A
B C E
D
Model Model Model
1 1 102 104 103.
10
Pump (µW) Pump (µW)
Pump (µW)
105
1 1
[image:5.595.107.473.69.210.2]102 102
Figure 4 Spectral linewidth versus pump power of QD-micropillar emitters for (a) LEDs, (b) cavity-enhanced LED and (c) lasers. The gray curves are from theory, and the data points are from experiment. Filled symbols indicate the scanning Fabry–Pérot interferometer or spectrometer results, and open symbols indicate the results from the analysis ofgð Þ2ðtÞmeasurements.
3
a b c
2
g
(2)
(0)
1
1 A
B C
D E
Model Model Model
102 104 1 102 104 103
10
Pump (µW) Pump (µW)
Pump (µW)
105 0
3
2
1
0
3
2
1
[image:5.595.118.472.268.413.2]0
importance of characterizing single-photon and entangled-photon sources and, to a lesser extent, of verifying lasing, particularly in the high-β regime8,38,49. Performing the necessary HBT measurement remains labor and equipment demanding, as one faces the experi-mental issue of time resolution in the case of thermal light38,49. The challenge is that the coherence time of emission, which determines the timescales of g(2)(τ), is usually much shorter than the timing
resolution of the single-photon counting based HBT setups. This issue can be circumvented by using a streak-camera with a dual time-base49; however, the cost is a significantly lower quantum efficiency, which again imposes constraints on measuringg(2)(τ) in the thermal
regime at low emission rates.
For chaotic light, the Siegert relation links the normalized first-order correlation function gð Þ1ð Þt to the second-order photon
auto-correlation function g2ð Þ ¼t 1þc g ð Þ1ðtÞ2
with c=1. A common approach is to model the intermediate regime between coherent and chaotic light with this function as well, where 0oco1. Homogenously broadened emission lines, as in our case, have a Lorentzian shape in the frequency spectrum; therefore, the envelope of the normalized
first-order correlation function gð Þ1ð Þt is an exponential function
decaying with the coherence time as a constant. As the area under the c g ð Þ1ðtÞ2
function is conserved under convolution with the instru-ment impulse response function, it is now possible to estimatecwhen the area and an estimate of the coherence time are given. Thus, by integrating over the measured rawgð Þ2ðtÞ function, we estimate the
original equal-time second-order photon auto-correlation function as gð Þ2ð Þ ¼0 1þDE=ð Þ2_Rdtgð Þ2ð Þ t 1 for a Lorentzian spectrum
with linewidth ΔE (full-width at half-maximum). The data points shown in Figure 5 demonstrate the measured g(2)(0) versus pump
power for all the devices. The data indicating thermal emission are obtained by analyzing the area under thegð Þ2ð Þt function, whereas the
data showing the onset of stimulated emission or lasing are obtained directly by fitting the convolved model function to the HBT measurements. For emitter C, like LEDs A and B, g(2)(0) stays at
~ 2 through the excitation range. Alternatively, micropillars D and E clearly exhibit a transition from thermal light (g(2)(0)≈2) to coherent
light (g(2)(0)≈1). In all cases, there is appreciable scattering in the data
describing the operation with thermal emission because of the time resolution and low emission rate challenges discussed in the previous paragraph. The gray curves are from the model, using the same input parameters as in Figures 2 and 3.
Figure 5b depicts a peculiar behavior, whereg(2)(0) for emitter C first reduces with increasing excitation, then reverses at approximately 100μW pump power and eventually returns tog(2)(0)=2 for pump power41 mW. Hence, despite the indications from Figures 3b and 4b, emitter C does not represent a high-β laser, but it is a good
example of the importance ofg(2)(0) measurements. We suspect the
g(2)(0) behavior is due to the carrier-density dependence of the dephasing rate, which has been reported to be strong in QD structures50,51. The difference between emitter C and the lasers D
and E may be that with a smaller diameter it operates with a higher carrier density to achieve gain. The present model neglects the carrier-density dependence of the dephasing coefficient, which explains the discrepancy between the calculated and measured results in Figure 4b. In addition, micropillar E clearly demonstrates g(2)(0)42 before decreasing to unity with increasing excitation. The observed super-thermal bunching is one manifestation of superradiance41,43; the occurrence in semiconductor micro- or nanocavities is presently being intensely investigated44,52–55. Based on modeling the experimental
result, the higher photon bunching results from correlations among QDs. The appearance of this correlation sensitively depends on the QD number, which explains the differentg(2)(0) power dependences of emitters D and E, which otherwise have very similar emission characteristics.
The correlation also affects the input–output curve for emitter E in Figure 3c by contributing to the intensity jump43. Fitting the experimental curve with a model including inter-QD correlation gives
β=0.72. Neglecting the inter-QD correlations gives a much lower estimation ofβ=0.23, which is incorrect because of the unmistakable g(2)(0)42 exhibited by emitter E, as shown in Figure 5c.
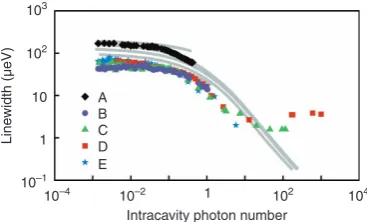
The measured and calculated information from the five QD-micropillars provide a relatively complete picture of the broad range of emission properties exhibited by high-βdevices. To understand the underlying physics governing the widely different behaviors, it is necessary to condense the information from Figures 3, 4, 5. Thefirst hint comes from noticing that the emission linewidth narrowing exhibited by all emitters appears very similar when the linewidth narrowing is plotted as a function of intracavity photon numbernp,
rather than the pump power. In Figure 6, the curves calculated for 8500oQo32000 are essentially identical in terms of the onset and slope of the line narrowing when one factors out the different low excitation plateaus due to the differences in passive cavity linewidth. The experimental data follows the same trend. Despite the large number of experimental data points, the scatter is minimal.
Extending upon Figure 6, we plot g(2)(0) versus the intracavity
photon number (Figure 7). The blue curves are calculated using the broad range of input parameters listed in Table 1 for emitters A–D (8500oQo32000;15oNQDo40;0:03oZo0:3 and 0:23rbr0:37).
The essentially overlapping curves strongly indicate a single functional device-independent relationship regarding lasing. Within the standard deviation of the measurement, the experimental results support this claim. For clarity, the experimental data from the four micropillars are combined and presented in terms of an average and standard deviation at an averaged intracavity photon number. There is noticeably more scatter in Figure 6 because of the challenges in measuring g(2)(0) for low-intensity thermal emission, where the accuracy is limited by the combination of the low signal-to-noise ratio and short coherence time. Nevertheless, both theory and experiment appear to indicate a lasing threshold when the intracavity photon number reaches approximately 102, independent of emitter
configuration. The red curve and data points are for emitter E, which exhibits super-thermal bunching, indicating the presence of sub- and super-radiance with changing pump power42–44,52–55. Again, there is an interdependence between photon correlations and photon number, in addition to the suggestion of a lower intracavity photon number necessary to reach the lasing threshold when superradiance is present43.
103
102
10
1
10–1
10–4 10–2 102
Intracavity photon number
Line
width (
µ
eV)
A B C D E
104
[image:6.595.83.267.71.182.2]1
Figure 6 Spectral linewidth versus intracavity photon number in lasing mode. The data points are from experiment, and the gray curves are from theory for (top to bottom)Q=8500, 25 000 and 32 000.
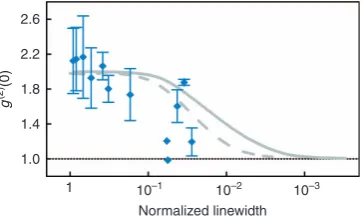
As linewidth narrowing will likely continue to be used as proof of lasing, it may be helpful to arrive at some quantitative indication of how much narrowing is necessary to support a lasing claim. Figure 8 shows the result of combining Figures 6 and 7. The abscissa is the emission linewidth divided by the passive cavity width. To more clearly demonstrate the trend in the experimental data, we again combined the results from the emitters and plot only the averages and the standard deviations. According to theory (gray curves), a greater than 102reduction is necessary. This refers to the fundamental linewidth determined solely by spontaneous emission. The measured data demonstrate a less stringent requirement of a reduction to approxi-mately 16% of the passive cavity width, which is observed in emitter E. The apparent discrepancy arises because the measured linewidths of the lasing emitters are further broadened by frequency jitter.
CONCLUSIONS
This paper describes research motivated by considerable discussions involving near-unity spontaneous-emission factor (bt1) emitters, in particular their unique emission properties during the transition from spontaneous emission to lasing. There are two aspects to our
investigation. First is to learn as much as possible about the emission properties of high-βemitters. For the task, we fabricate, measure and model a wide variety of experimental configurations, ranging from LEDs to lasers. In addition to the usual characterizations involving the excitation dependences on emission intensity and linewidth, we measure and calculate the second-order intensity correlation g(2)(τ) as a function of pump power. The importance of examining all three properties is illustrated very well by an emitter whose properties fall between those of an LED and a laser: a cavity-enhanced LED. Importantly, it can easily be mistaken for a laser because the intensity and linewidth excitation dependences are similar to those of lasers. However, the g(2)(0) clearly indicates thermal statistics.
The importance of g(2)(0) is further reinforced by the results for a
laser that exhibits superradiant emitter coupling as it approaches the lasing threshold. Obviously, without knowingg(2)(0), the interesting property would have been missed, and equally important, an under-estimation of the spontaneous emission factor would have resulted.
The second aspect of our research involves consolidating the vast amount of data to identify and understand the physics underlying the broad range of behaviors. Progress is made with the discovery that the experimental and theoretical results for all the emitters seeminglyfit into two relationships: linewidth reduction versus intracavity photon number and g(2)(0) versus intracavity photon number. Hence, laser (or
non-laser) action comes from achieving a given photon number above unity, and device parameters, such as Qand β factors, QD density, dipole matrix element, carrier transport and optical mode volume, determine the lasing threshold by affecting the intracavity photon number.
CONFLICT OF INTEREST
The authors declare no conflict of interest.
ACKNOWLEDGEMENTS
The research is funded in part by the European Research Council under the Seventh Framework ERC Grant Agreement No. 615613 of the European Union, the German Research Foundation via the projects RE2974/5-1, Ka2318 7-1 and JA 619/10-3, and the US Department of Energy under Contract No. DE-AC04-94AL85000. WWC thanks the Technical University Berlin for hos-pitality and the German Research Foundation via collaborative research center
787 for travel support. CG and FJ gratefully acknowledgefinancial support
from the German Science Foundation (DFG). FJ further acknowledges support from the German Federal Ministry of Education and Research (BMBF).
1 Blood P. The laser diode: 50 years on.IEEE J Sel Top Quantum Electron2013;19: 1503201.
2 Vahala KJ. Optical microcavities.Nature2003;424: 839–846.
3 Lodahl P, van Driel AF, Nikolaev IS, Irman A, Overgaag Ket al.Controlling the dynamics of spontaneous emission from quantum dots by photonic crystals.Nature2004;430: 654–657.
4 De Giorgio V, Scully MO. Analogy between the laser threshold region and a second-order phase transition.Phys Rev A1970;2: 1170–1177.
5 Rice PR, Carmichael HJ. Photon statistics of a cavity-QED laser: a comment on the laser–phase transition analogy.Phys Rev A1994;50: 4318–4329.
6 Gourley PL. Microstructured semiconductor lasers for high-speed information proces-sing.Nature1994;371: 571–577.
7 Noda S. Seeking the ultimate nanolaser.Science2006;314: 260–261.
8 Stefan TJ, Noelia VT, Gordon C, Stefan K, Ian MRet al.Thresholdless Lasing of Nitride Nanobeam Cavities 2016; arXiv: 1603.06447.
9 Salehzadeh O, Djavid M, Tran NH, Shih I, Mi ZT. Optically pumped two-dimensional MoS2lasers operating at room-temperature.Nano Lett2015;15: 5302–5306.
10 Bergman DJ, Stockman MI. Surface plasmon amplification by stimulated emission of radiation: quantum generation of coherent surface plasmons in nanosystems.Phys Rev Lett2003;90: 027402.
11 Lu YJ, Wang CY, Kim J, Chen HY, Lu MYet al.All-color plasmonic nanolasers with ultralow thresholds: autotuning mechanism for single-mode lasing.Nano Lett2014;
14: 4381–4388.
3.4
2
1 Emitter
Emitters E
A-D 3.0
2.6
2.2
g
(2)
(0)
1.8
1.4
1.0
10–4 10–2
10–2
102
102
1
1
Intracavity photon number
[image:7.595.71.252.69.180.2]104
Figure 7 Equal-time intensity correlation versus intracavity photon number in lasing mode for all micropillar emitters. The data are separated for emitter F, which exhibits radiative emitter coupling, and emitters A–D, which do not. The inset shows data points from all emitters plotted separately. In the main figure, data from emitters A–D are separated into bins of different average linewidths. The average and standard deviation are plotted in each bin. The calculated curves from all emitters are plotted. All curves except one (dashed curve from emitter C), are indistinguishable from one another. We suspect the separation of the dashed and solid curves to be due to numerical error.
2.6
2.2
1.8
1.4
g
(2)
(0)
1.0
1
Normalized linewidth 10–1 10–2 10–3
[image:7.595.72.254.310.418.2]12 Purcell EM. Spontaneous emission probabilities at radio frequencies.Phys Rev1946;
69: 681.
13 Lodahl P, Mahmoodian S, Stobbe S. Interfacing single photons and single quantum dots with photonic nanostructures.Rev Mod Phys2015;87: 347–400.
14 Chow WW, Crawford MH. Analysis of lasers as a solution to efficiency droop in solid-state lighting.Appl Phys Lett2015;107: 141107.
15 Reithmaier JP, Sęk G, Löffler A, Hofmann C, Kuhn Set al.Strong coupling in a single quantum dot-semiconductor microcavity system.Nature2004;432: 197–200. 16 Manga Rao VSC, Hughes S. Single quantum-dot Purcell factor andβfactor in a
photonic crystal waveguide.Phys Rev B2007;75: 205437.
17 De Martini F, Innocenti G, Jacobovitz GR, Mataloni P. Anomalous spontaneous emission time in a microscopic optical cavity.Phys Rev Lett1987;59: 2955–2958. 18 Björk G, Yamamoto Y. Analysis of semiconductor microcavity lasers using rate
equations.IEEE J Quantum Electron1991;27: 2386–2396.
19 Jin R, Boggavarapu D, Sargent M, Meystre P, Gibbs HM et al. Photon-number correlations near the threshold of microcavity lasers in the weak-coupling regime.Phys Rev A1994;49: 4038–4042.
20 Björk G, Karlsson A, Yamamoto Y. Definition of a laser threshold.Phys Rev A1994;50: 1675–1680.
21 Ning CZ. What is laser threshold?IEEE J Sel Top Quantum Electron2013; 19: 1503604.
22 Coldren LA. What is a diode laser oscillator?IEEE J Sel Top Quantum Electron2013;
19: 1503503.
23 Yokoyama H. Physics and device applications of optical microcavities.Science1992;
256: 66–70.
24 DeMartini F, Jacobovitz GR. Anomalous spontaneous-stimulated-decay phase transition and zero-threshold laser action in a microscopic cavity.Phys Rev Lett1988;60: 1711–1714.
25 Khajavikhan M, Simic A, Katz M, Lee JH, Slutsky Bet al.Thresholdless nanoscale coaxial lasers.Nature2012;482: 204–207.
26 Takiguchi M, Taniyama H, Sumikura H, Birowosuto MD, Kuramochi Eet al.Systematic study of thresholdless oscillation in high-βburied multiple-quantum-well photonic crystal nanocavity lasers.Opt Express2016;24: 3441–3450.
27 Ye Y, Wong ZJ, Lu XF, Ni XJ, Zhu HYet al.Monolayer excitonic laser.Nat Photonics
2015;9: 733–737.
28 Jang H, Karnadi I, Pramudita P, Song JH, Kim KSet al.Sub-microWatt threshold nanoisland lasers.Nat Commun2015;6: 8276.
29 Wu SF, Buckley S, Schaibley JR, Feng LF, Yan JQet al.Monolayer semiconductor nanocavity lasers with ultralow thresholds.Nature2015;520: 69–72.
30 Prieto I, Llorens JM, Muñoz-Camúñez LE, Taboada AG, Canet-Ferrer Jet al.Near thresholdless laser operation at room temperature.Optica2015;2: 66–69. 31 Armstrong JA, Smith AW. Intensityfluctuations in a GaAs laser.Phys Rev Lett1965;
14: 68–70.
32 Mohideen U, Slusher RE, Jahnke F, Koch SW. Semiconductor microlaser linewidths.
Phys Rev Lett1994;73: 1785–1788.
33 Schawlow AL, Townes CH. Infrared and optical masers. Phys Rev 1958; 112: 1940–1949.
34 Choi YS, Rakher MT, Hennessy K, Strauf S, Badolato Aet al.Evolution of the onset of coherence in a family of photonic crystal nanolasers.Appl Phys Lett2007;91: 031108. 35 Elvira D, Hachair X, Verma VB, Braive R, Beaudoin Get al.Higher-order photon correlations in pulsed photonic crystal nanolasers.Phys Rev A2011;84: 061802. 36 Chow WW, Jahnke F, Gies C. Emission properties of nanolasers during the transition
to lasing.Light Sci Appl2014;3: e201.
37 Lermer M, Gregersen N, Dunzer F, Reitzenstein S, Höfling S et al. Bloch-wave engineering of quantum dot micropillars for cavity quantum electrodynamics experi-ments.Phys Rev Lett2012;108: 057402.
38 Ulrich SM, Gies C, Ates S, Wiersig J, Reitzenstein S et al.Photon statistics of semiconductor microcavity lasers.Phys Rev Lett2007;98: 043906.
39 Chow WW, Jahnke F. On the physics of semiconductor quantum dots for applications in lasers and quantum optics.Prog Quantum Electron2013;37: 109–184.
40 Yokoyama H, Brorson SD. Rate equation analysis of microcavity lasers.J Appl Phys
1989;66: 4801–4805.
41 Dicke RH. Coherence in spontaneous radiation processes. Phys Rev 1954; 93: 99–110.
42 Svidzinsky AA, Yuan LQ, Scully MO. Quantum amplification by superradiant emission of radiation.Phys Rev X2013;3: 041001.
43 Leymann HAM, Foerster A, Jahnke F, Wiersig J, Gies C. Sub- and superradiance in nanolasers.Phys Rev Appl2015;4: 044018.
44 Temnov VV, Woggon U. Superradiance and subradiance in an inhomogeneously broadened ensemble of two-level systems coupled to a low-Qcavity. Phys Rev Lett
2005;95: 243602.
45 Tempel JS, Akimov IA, Aßmann M, Schneider C, Höfling Set al.Extrapolation of the intensity autocorrelation function of a quantum-dot micropillar laser into the thermal emission regime.J Opt Soc Am B2011;28: 1404–1408.
46 Gomis-Bresco J, Dommers S, Temnov VV, Woggon U, Laemmlin Met al.Impact of Coulomb scattering on the ultrafast gain recovery in InGaAs quantum dots.Phys Rev Lett2008;101: 256803.
47 Kurtze H, Seebeck J, Gartner P, Yakovlev DR, Reuter Det al.Carrier relaxation dynamics in self-assembled semiconductor quantum dots.Phys Rev B 2009;80: 235319.
48 Strauf S, Hennessy K, Rakher MT, Choi YS, Badolato Aet al.Self-tuned quantum dot gain in photonic crystal lasers.Phys Rev Lett2006;96: 127404.
49 Wiersig J, Gies C, Jahnke F, Aβmann M, Berstermann Tet al.Direct observation of correlations between individual photon emission events of a microcavity laser.Nature
2009;460: 245–249.
50 Lorke M, Chow WW, Nielsen TR, Seebeck J, Gartner Pet al.Anomaly in the excitation dependence of the optical gain of semiconductor quantum dots.Phys Rev B2006;74: 035334.
51 Laucht A, Hauke N, Villas-Bôas JM, Hofbauer F, Böhm Get al.Dephasing of exciton polaritons in photoexcited InGaAs quantum dots in GaAs nanocavities.Phys Rev Lett
2009;103: 087405.
52 Jahnke F, Gies C, Aβmann M, Bayer M, Leymann HAMet al.Giant photon bunching, superradiant pulse emission and excitation trapping in quantum-dot nanolasers.Nat Commun2016;7: 11540.
53 Il GTN, Kim JH, Lee J, Wang YR, Wójcik AKet al.Giant superfluorescent bursts from a semiconductor magneto-plasma.Nat Phys2012;8: 219–224.
54 Scheibner M, Schmidt T, Worschech L, Forchel A, Bacher Get al.Superradiance of quantum dots.Nat Phys2007;3: 106–110.
55 Mlynek JA, Abdumalikov AA, Eichler C, Wallraff A. Observation of Dicke super-radiance for two artificial atoms in a cavity with high decay rate.Nat Commun2014;5: 5186.
This work is licensed under a Creative Commons Attribution-NonCommercial-ShareAlike 4.0 International License. The images or other third party material in this article are included in the article’s Creative Commons license, unless indicated otherwise in the credit line; if the material is not included under the Creative Commons license, users will need to obtain permission from the license holder to reproduce the material. To view a copy of this license, visit http:// creativecommons.org/licenses/by-nc-sa/4.0/
rThe Author(s) 2017