Heart Rate and Ischemia Detection Using Wavelet
Transform
A. Fancy Nija1, M. Kamalanathan2 1
M.E- Applied Electronics, 2Assistant Professor, Department of ECE Gnanamani College of Technology, Namakkal, Tamil Nadu, India
Abstract— Electrocardiogram (ECG) is generally used for diagnosis of cardiovascular abnormalities and disorders. An efficient method is implemented towards the detection of heart rate (HR) and ischemic from the ECG signal. The heart rate is calculated using the extracted features of the ECG signal for diagnosing cardiac arrest. The detection of ischemia from a patient’s electrocardiogram (ECG) signal is based on the characteristics of a specific part of the beat called the ST segment which is used to diagnose the heart arrest. Wavelet transforms provides a good learning and detection capabilities which is an efficient tool to deal with uncertainties. Neural network classifier is used for classifying the abnormalities such as arrhythmia, types of ischemia as transmural and non transmural ischemia.
Keywords— ECG, Daubachies wavelet, Ischemia, Arrhythmia, neural network classifier
I. INTRODUCTION
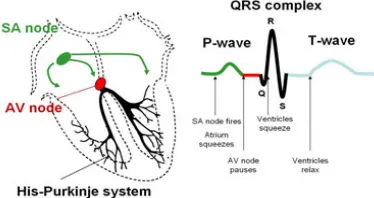
[image:2.612.217.404.495.594.2]Electrocardiographic (ECG) signals information is derived from analysis of the information indirectly reflected on the surface ECG. The ECG signal is able to make of basic information for heart disease, indisposed of the autonomic nervous system and stress. The World Health Organization estimates that 17.5 million people died of various abnormalities. One of the most common fatal diseases is ischemic heart disease in the world. Myocardial ischemia is caused by a lack of sufficient blood flow to the contractile cells and many lead to myocardial information with its severe sequel of heart failure, arrhythmias and death. ECG is a quasi-periodical, rhythmically repeating signal synchronized by the function of the heart which acts as a generator of bioelectric events. The generated signal which appears on the surface are thus recorded signal displays as waveform. The normal electrocardiogram is composed of a P wave, a QRS complex, and a T wave. The QRS complex is often, but not always, three separate waves: the Q wave, the R wave, and the S wave. The electrical activity of heart is shown in fig. 1
Fig. 1 Electical activity of Heart
The P wave is caused by electrical potentials generated when the atria depolarize before\ atrial contraction begins. The QRS complex is caused by potentials generated when the ventricles depolarize before contraction, that is, as the depolarization wave spreads through the ventricles. Therefore, both the P wave and the components of the QRS complex are depolarization waves.
The T wave is caused by potentials generated as the ventricles recover from the state of depolarization. This process normally occurs in ventricular muscle 0.25 to 0.35 second after depolarization, and the T wave is known as a repolarization wave. Thus, the electrocardiogram is composed of both depolarization and repolarization waves.
partial blockage of coronary artery which leads to damage of cardiac muscle and reducing its ability to pump. The sudden severe blockage of a coronary artery is called as heart attack. The paper has been proposed to identify the cardiac ischemia from ECG by changes in values of measured amplitudes, times and durations on the ST-T complex. Differentiation of the transmural and non transmural ischemia is done by neural network classifier based on thickness of ventricle wall. Heart attack can be identified by the transmural signal which denotes full thickening of ventricle wall due to the severe blocks in coronary artery. Heart rate is the speed of the heartbeat calculated by counting the number of heartbeats per unit of time typically beats per minute. The heart rate can vary according to the body's physical needs, including the need to absorb oxygen and excrete carbon dioxide. Heart rate can also vary due to physical exercise, sleep, stress, illness and drugs. The normal heart rate for adult at rest from 60–100 bpm. Bradycardia, Tachycardia is the slow and fast heart rate, at rest. When the heart is not beating in a regular pattern, this is referred to as an arrhythmia. These abnormalities of heart rate sometimes indicate disease.The paper organized as follows: section II explains the methodology of the proposed system. Section III provides the experimental results using LTST Database. Finally section IV concludes the paper.
II. METHODOLOGY
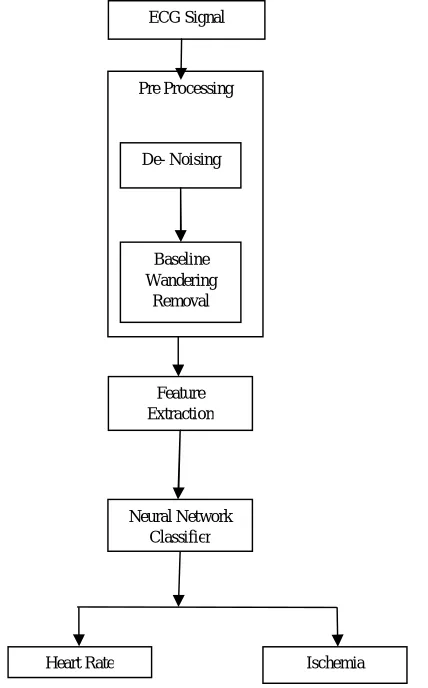
[image:3.612.223.437.345.689.2]The proposed methodology is used to detect the arrhythmias and types of cardiac ischemia. Basically it consists of five stages. In first stage, the preprocessing is done to achieve the noise removal. In next stage, features of ECG signal are extracted to locate QRS complex, ST segment and T wave. After that heart rate is calculated from extracted feature of ECG signal. The ischemia is detected based on ST-T segment and classification is based on neural network classifier. Figure shows the block diagram of detection of Heart Rate and Ischemia in fig 2.
Fig. 2 Block diagram for the detection of heart rate and Ischemia.
ECG Signal
Feature Extraction
Neural Network Classifier
Heart Rate Ischemia Pre Processing
De- Noising
Baseline Wandering
A. Data Study
The LTST database from physionet contains 24-hours ambulatory records selected from holter recordings obtained in routine practice settings in Europe and United States between 1994 and 2000. The records were collected to model real-world clinical conditions as far as with or without known coronary artery disease while containing significant ischemic and non ischemic ST events.
B. Preprocessing
The first stage is preprocessing the ECG signal and it is necessary to eliminate noises from input signals which involve different strategies for various noise sources. The pre- process is done before the extracting the feature which increases the system efficiency. Preprocessing of ECG signal consists of De-noising of ECG signal and baseline wandering removal using multiresolution wavelet transform.
1) De-Noising: ECG recording contain significant amount of noise. The recorded signal is corrupted by different types of noise and
interference, originated by another physiological process of the body. Wavelet analysis is performed using db4 mother wavelet.
2) Baseline Wander Removal: Baseline wanders (BW) that may be due to respiration or the motion of the patients or the instruments.
These artifacts severely limit the utility of recorded ECGs and thus need to be removed for better clinical evaluation. Moving Average filter is used to Eliminate the baseline wander which can be needed in the analysis to reduce the beat irregularities
C. Feature Extraction
Peak detection is important to extract the feature for ECG signal and which is used in next stage of ECG signal. The ability to manipulate and compute the data in compressed parameters form is one of the most important application of wavelet transform, are often known as features. Feature extraction is the most important step in pattern recognition. The compressed form of data can be manipulated by daubachies wavelet.
D. Neural Network Classifier
Artificial neural network (ANN) is generally called neural network which is a computational model which is motivated by the structure of biological neural networks. A neural network consists of an interconnected group of artificial neurons. This paper describes the use of neural network in pattern recognition, where the input unit represents the feature vector and the output units represents the pattern class which has to be classified. Each input vector (feature vector) is given to the input layer, and output of each unit is corresponding element in the vector. Each hidden units calculates the weighted sum of its input to outline its scalar a net activation. Net activation is the inner product of the inputs and weight vector at the hidden unit.
III. EXPERIMENTAL RESULTS
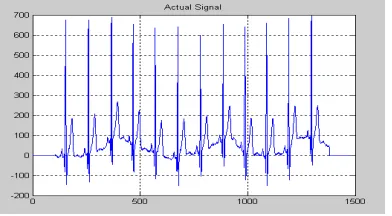
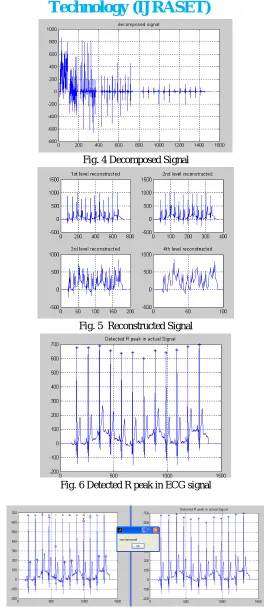
[image:4.612.217.413.599.707.2]The software used in this work is MATLAB 7.0. The various in the block diagram are done with MATLAB Programming with signal processing Toolbox. The following Figures show the output obtained from different stages. Fig. 3 shows the actual input signal from LTST database. Fig. 4 shows Decomposed Signal, fig. 5 shows reconstructed signal, fig. 6 shows detected R peak in ECG signal as a output of feature extraction. Non transmural ischemia signal is shown in fig. 7 which shows the partial blockage in coronary artery and predicted by the ST segment is less than 80 ms. Fig. 8 shows the transmural ischemia signal which shown the person possibility to get the heart attack of 95% by identifying the severity of blocks in coronary artery. The heart rate also calculated for any ECG signal from database and tachycardia and bradycardia are identified.
Fig. 4 Decomposed Signal
Fig. 5 Reconstructed Signal
Fig. 6 Detected R peak in ECG signal
Fig.8 Transmural Ischemia Signal shows heart attack
IV. CONCLUSION
This paper is proposed with the use of wavelet transform for detection of heart rate and ST segment deviation. With the help of neural network classifier the transmural and non transmural ischemia are identified based on the blocks in coronary artery. One of the crucial steps in the ECG analysis is to accurately detect the different waves forming the entire cardiac cycle. The wavelet transformation is worth in investigating in P- and T-wave recognition, the peaks of QRS complexes flatten and P- and T-waves containing lower frequencies become more visible. Wavelet transform can analyze noise signal in time domain and frequency domain. It is suitable for transient signal detection. Once R- R interval & ST deviation is calculated, the arrhythmia and the ischemia status can be easily recognized. The analysis with short term recording of ECG data samples i.e. 32 seconds was performed. Satisfactory results were obtained. In order to get accurate precise results, the work can be extended with more number of subjects with sufficient set of ECG database. In future the algorithm can be applied to real time ECG signal obtained from patient boy and the Myocardial Ischemia and arrhythmia can be detected in real time.
REFERENCES
[1] P.R. Bokde, Dr. N.K. Choudhari, “Analysis and Feature extraction of ECG signal for Myocardial Ischemia Detection”, International Journal of Engineering and Technical Research (IJETR) ISSN: 2321-0869, Volume 2, Issue-5, May 2014.
[2] Duck Hee Lee, Jun Woo Park, Jeasoon Choi, Ahmed Rabbi1 and Reza Fazel-Rezai1, “Automatic Detection of Electrocardiogram ST Segment: Application in Ischemic Disease Diagnosis”, IJACSA) International Journal of Advanced Computer Science and Applications, Volume. 4, November, 2013.
[3] Ghousia Begum S, Vipula Singh, “Automatic Diagnostic System for Long-Term ECG Data from Holter Monitor”, International Journal of Computer Applications (0975 – 888) Volume 47– No.20, June 2012.
[4] Goutam Kumar Sahoo, Samit Ari, Sarat Kumar Patra, “ECG signal analysis for detection of Heart Rate and Ischemic Episodes”, International Journal of Advanced Computer Research (ISSN (print): 2249-7277 ISSN (online): 2277-7970) Volume-3 Number-1 Issue-8 March-2013.
[5] Laszlo Gerencser, Gyorgy Kozmann, Zsuzsanna Vago, and Kristof Haraszti, “The Use of the SPSA Method in ECG Analysis”, IEEE transactions on biomedical Engineering, Volume. 49, No. 10, October 2002.
[6] D. Lemire, C. Pharand, J.-C. Rajaonah, B. Dub´e, and A.-R. LeBlanc, “Wavelet Time Entropy, T wave morphology and myocardial ischemia”, D. Lemire, C. Pharand, J.-C. Rajaonah, B. Dub´e, and A.-R. LeBlanc July 2000.
[7] A.Muthuchudar, Lt.Dr.S.Santosh Baboo, “A Study of the Processes Involved in ECG Signal Analysis”, International Journal of Scientific and Research Publications, ISSN 2250-3153,Volume 3, Issue 3, March 2013.