Title: Functionally-Relevant White Matter Degradation in Multiple Sclerosis: A Tract-Based Spatial Meta-Analysis
Manuscript Type: Original research.
Advances in Knowledge:
1. There are differential and only minimally-overlapping distributions of lower
fractional anisotropy relating to clinical disability and cognitive impairment.
Low anterior callosal and thalamic fractional anisotropy has specific
importance to cognitive status, whereas low posterior callosal and deep
parietal fractional anisotropy has specific importance to physical disability
(uncorrected p<0.005, z>1, cluster extent≥10 voxels).
2. Cerebral white matter degradation may be more relevant to cognitive than
physical disability: 2.3 times as many voxels had a significantly lower
fractional anisotropy in relation to cognition (753 voxels) than to physical
disability (323 voxels) and the z-scores for those clusters were higher for
cognition than for physical disability (2.532 and 1.701, respectively).
Implications for Patient Care:
1. Widespread white matter damage measured by diffusion tensor imaging
occurs in multiple sclerosis; our meta-analysis reveals differential and only
minimally-overlapping distributions of white matter damage relating to both
cognitive and physical disability.
Summary Statement: Our voxelwise meta-analysis of studies relating tract
fractional anisotropy to cognitive and physical disability in multiple sclerosis reveals
Abstract
Purpose
To identify statistical consensus between published studies for distribution and
functional relevance of tract white matter degradation in multiple sclerosis (MS).
Materials and Methods
By systematically searching online databases, we identified tract-based spatial
statistics (TBSS) studies which (1) compare fractional anisotropy (FA; a marker for
white matter integrity) in MS patients to healthy controls, (2) correlate FA in MS
patients with physical disability, or (3) correlate FA in MS patients with cognitive
performance. We performed voxelwise meta-analyses using the Signed Differential
Mapping technique for each comparison. Moderating effects of mean age, mean
physical disability score, scanner magnet strength, lesion load and number of
diffusion directions were assessed by meta-regression.
Results
Data from 495 patients and 253 controls across 12 studies were meta-analysed. MS
diagnosis was significantly associated with widespread lower tract FA (9 studies;
largest cluster: 4379 voxels, Z=7.1, p<0.1×10⁻⁸). Greater physical disability was significantly associated with lower FA in the right posterior cingulum, left callosal
splenium, right inferior fronto-occipital fasciculus and left fornix crus (6 studies; 323
voxels, Z=1.7, p=0.3×10⁻⁴). Impaired cognition was significantly associated with lower FA in the callosal genu, thalamus, right posterior cingulum and fornix crus (7
studies; largest cluster: 980 voxels, Z=2.5, p<0.1×10⁻⁸).
White matter damage is widespread in MS with differential and only
minimally-overlapping distributions of low FA relating to physical disability and cognitive
impairment. The higher number of clusters of lower FA in relation to cognition and
their higher Z-scores suggest that cerebral white matter damage may have a greater
relevance to cognitive dysfunction than physical disability in MS, with low anterior
Introduction
Magnetic resonance imaging (MRI) has been used extensively in research aimed at
elucidating mechanisms underlying disability in multiple sclerosis (MS)1, 2. Cerebral white matter (WM) has been a target for investigation, given the propensity of MS to
affect WM. Studies performing quantification and mapping of macroscopic WM
lesions have identified associations between lesion distribution and disability3-8, but fail to take into account widespread diffuse damage present in normal-appearing WM
(NAWM). A technique which is sensitive to this damage9,10, diffusion tensor imaging (DTI), allows quantification of fractional anisotropy (FA), a marker of ultrastructural
WM integrity that has been used for more than a decade to study both lesional and
NAWM damage in MS9-14.
Since its description in 2006, tract-based spatial statistics (TBSS)15, has been applied to multisubject spatial analysis of DTI data examining neurological and
cognitive correlates of WM degradation in MS15-32. These studies broadly support the suggestion that disconnection of cortical or subcortical grey matter by diffuse and
focal damage of interconnecting white matter may be an important factor contributing
to physical disability and cognitive dysfunction in MS18. However, results from these studies demonstrate differences in patterns of tract-based functionally-relevant FA
change (i.e.tract-based correlations between FA and measures of clinical disability
or cognitive function) even where there are significant methodological and
demographic overlaps, and this heterogeneity limits interpretation. Some sources of
such heterogeneity may include cohort age and level of disability, scanner magnet
From published studies, some common findings are apparent; for example, reduced
FA and increased mean diffusivity (MD) associated with greater physical disability
has been reported in the corpus callosum and pyramidal tracts15, 19, 21, 22, 31. An association between worse cognitive performance and lower FA in the corpus
callosum, posterior thalamic radiation and posterior cingulum has also been
reported18, 20, 21, 23, 24, 30, 31. Given that the sensitivity of DTI varies by brain region depending on the direction and density of nerve fibres33, meta-analysis of DTI data could potentially increase statistical power enough to identify important regions of
interest which would otherwise go unnoticed, for example those in smaller tracts. We
aimed to identify statistical consensus between published studies for distribution and
Methods
This study was financially supported by a studentship grant from the UK MS Society
(Registered Charity No. 1139257). The authors retained full control of the data and
information submitted for publication.
Literature Search
The literature search was performed separately by two researchers (TW: expertise in
computer science (6 years) and radiological science (2 years); DK: expertise in
medical sciences (3 years) and radiological science (1 year)). MEDLINE and Web of
Knowledge databases were searched, as well as Google Scholar, using the search
term: “”multiple sclerosis” AND ((TBSS OR “tract-based spatial statistics”) OR (DTI
OR “diffusion tensor”))”. Results were not restricted to a particular language but were
filtered to include only results during or after 2006 (the date of publication of the
original TBSS paper15). Abstracts and, where necessary, full texts of the identified articles were first screened to select only those that performed TBSS analysis of DTI
data. The remaining articles then underwent further screening to identify articles that
included one or more of the following voxelwise analyses:
1. Group comparison of fractional anisotropy (FA) in MS patients to FA in healthy
controls;
2. Correlation of FA in MS patients to scores on the Expanded Disability Status
Scale (EDSS)34, a general measure of disability comprising 8 functional systems which is heavily weighted toward ambulation;
3. Correlation of FA in MS patients to a general or summary score of cognition.
This included studies performing voxelwise correlation of paced auditory serial
of cognitive performance36 that tests functional domains including sustained attention, calculation ability, processing speed and working memory, and is used
as the summary cognitive measure in the Multiple Sclerosis Functional
Composite (MSFC)37.
Studies were excluded if they focussed on a region-of-interest instead of performing
a whole-brain analysis, or if they correlated whole-brain summary DTI measures
(e.g. mean FA) with test scores instead of performing voxelwise correlations. Where
multiple articles reporting TBSS results from a single cohort or overlapping cohorts
was suspected, this was checked directly with the authors and duplicate data
excluded. Reference lists of articles identified by the search were hand-searched to
identify any other relevant papers. We recorded from each included article: the
number of subjects, the included MS subtypes, the sample origin, the sample mean
age, the number of diffusion directions and which voxelwise correlations had been
made. Primary authors were contacted by e-mail to request the unthresholded
statistical maps required for voxelwise meta-analysis. We were also supplied with
additional unpublished data for the correlation of FA to EDSS scores from two of the
cohorts in the included published studies18, 31.
Quality Assessment
The methodological quality of each article was assessed against a set of nine
weighted criteria, based on those of Kmet et al38 and adapted to meet the needs of this review by TW (Table e-1). Weightings were set such that there was an emphasis
on image quality. Articles scoring less than a pre-defined threshold of 50% (fewer
than 9 of the available 17 points), corresponding to three of the higher-weighted
Meta-Analysis
Three separate spatial meta-analyses were performed (by TW) using the Signed
Differential Mapping (SDM) software39 (v 4.12): one for each of the three comparisons listed above. For each, the t-statistic images were converted to
unbiased effect size and variance maps using the method of Peters et al40: "(1) retrieval of a mass number (e.g, 5000) of low-thresholded local peaks from the
statistical maps, (2) incorporation of these peaks to the SDM peak-based
preprocessing procedure to reconstruct the effect-size maps”. The SDM software
then created an SDM map for each study and permuted the location of the voxels to
create randomised SDM maps. With this method, we ensured that all effect size
maps overlapped properly with the TBSS template. A 20mm half-width Gaussian
kernel was applied using the peak coordinates to recreate signed effect size maps,
as recommended by the authors of SDM39. Voxels closer to a peak were therefore
assumed to have a higher effect size. Using a random-effects model, a voxelwise
mean of the study maps was created, which was weighted by the mean of the
inverse of each study’s variance and the inter-study heterogeneity. This approach
meant that the results accounted for study size and for brain regions having a large
variance between studies. A voxel-based permutation test determined statistical
significance. Based on an empirical validation by the authors of SDM39, we used the recommended thresholds (uncorrected p<0.005, z>1, cluster extent≥10 voxels),
which were found to optimally balance sensitivity and specificity, and to
approximately correspond to an equivalent corrected p-value of 0.05. To assess the
effects of false positive results, we also ran the meta-analyses with the more
stringent p-value threshold of 0.00001. We conducted jack-knife (leave-one-out)
but leaving out one study each time, allowing assessment of the robustness of the
results.
Meta-Regressions
The moderating effects of mean age, mean EDSS score, scanner magnet strength,
lesion volume and number of diffusion directions were assessed by meta-regression
(by TW). In line with previous meta-analyses and recommendations by the authors of
SDM41, we used a low probability threshold of 0.0005, only included abnormalities that were apparent in both the slope and in one extreme of the regressor, and
Results
Literature Search
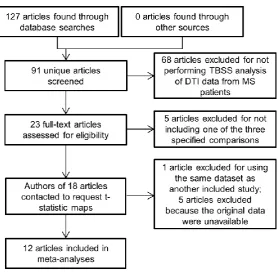
Figure 1 shows a summary of the results of the literature search. Of 127 search
results, 36 articles (28%) were duplicates from searches in the other databases. Of
the 91 unique search results, 68 articles (75%) were excluded based on review of
their titles and abstracts because they did not analyse diffusion data from MS
patients using TBSS. A further 5 papers were excluded following full reviews
because they did not meet the inclusion criteria. Corresponding authors of 18 articles
were contacted. Of those, one article32 was excluded because it reported the same dataset as that reported in another included study15. We received responses from all corresponding authors, but for 5 studies17, 26-29 the required t-statistic images were unavailable. The resulting dataset (table 1) comprised 495 MS patients and 253
healthy controls from 12 studies15, 16, 18-25, 30, 31. The dataset included subjects originating in 10 countries across 3 continents.
Quality Assessment
Table e-1 shows the results of the quality assessment. The mean quality score was
76.7% (13 of 17 available points; SD ± 14.1%). All articles surpassed the minimum
quality threshold.
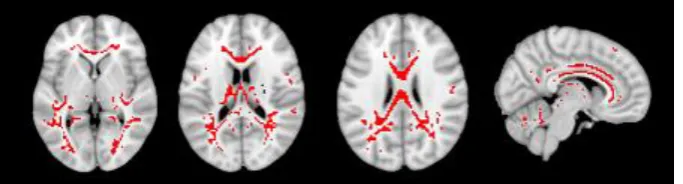
FA in MS Patients and Healthy Controls
The comparison of FA in MS to FA in healthy controls was reported in 9 of the
articles, whose combined sample numbered 398 MS patients and 233 healthy
controls. Voxelwise meta-analysis revealed widespread supra-threshold white matter
corpus callosum, periventricular white matter and fornix (figure 2, table e-2). There
was one large cluster (which contained all of those regions; 4379 voxels, Z=7.1,
p<0.1×10⁻⁸) and 7 smaller clusters. One cluster of lower FA negatively associated with MS diagnosis was present in the right posterior internal capsule (24 voxels,
Z=-1.3, p=0.9×10⁻⁶).
[Figure 2 here]
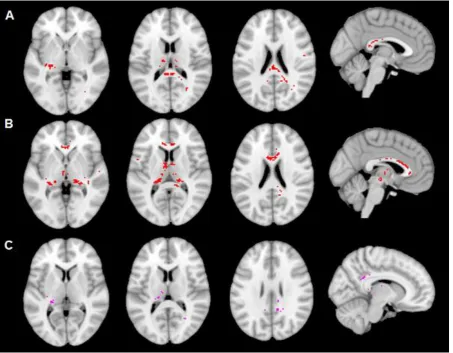
FA and Physical Disability
An FA-to-physical disability comparison was reported in 6 of the articles, whose
combined sample numbered 200 MS patients. All included studies measured
physical disability using EDSS34. More severe disability was associated with lower FA in one large cluster including the posterior body and splenium of the corpus
callosum, left fornix crus, left thalamus, right thalamus, posterior thalamic radiation
and stria terminalis (323 voxels, Z=1.7, p=0.3×10⁻⁴). There were no clusters where lower FA was associated with lower levels of physical disability (figure 3, table e-3).
FA and Cognition
An FA-to-cognition comparison was reported in 7 of the articles, whose combined
sample numbered 417MS patients. All comparisons were based on scores on the
PASAT35, except the study of Schoonheim et al30, which used a composite measure (‘average cognition’) derived from 7 cognitive domains, and the study of Mazerolle et
al24, which used the Symbol Digit Modalities Test42(SDMT).More impaired cognition was associated with lower FA in one large cluster comprising the thalami and
right posterior thalamic radiation (1073 voxels, Z=2.5, p<0.1×10⁻⁸). There were no clusters showing lower FA associated with better performance (figure 3, table e-4).
Meta-Regressions and Sensitivity Analyses
Meta-regression analyses showed that the number of diffusion directions used in the
scan had a significant moderating effect on the correlation between EDSS and FA in
MS patients, with more clusters being detected in scans with more diffusion
directions, specifically in one cluster in the posterior cingulum (13 voxels, Z=2.4,
p=0.9×10⁻⁵; table e-5). No other significant moderating effects of mean age, mean EDSS score, scanner magnet strength, lesion load or number of diffusion directions
were found for any comparison. Sensitivity analysis showed that, for the group
comparison, our results were consistent, with most analyses retaining 100% of the
significant cluster groups (9 of 9) when one study was excluded (table e-6). In the
correlation of lower FA to physical disability, although only one cluster group was
detected, it survived 66% of the tests (4 of 6; table e-7). In the correlation of lower FA
to impaired cognition, the results were partly sensitive to the exclusion of two
studies20, 30 (table e-8).
When running the meta-analyses with a lower p-value threshold of 0.00001, the
largest clusters in the meta analyses of FA in patients and controls and FA and
cognition remained significant, while in the FA and EDSS meta-analysis, the were no
Discussion
Our voxelwise meta-analysis of studies relating tract fractional anisotropy to cognitive and physical disability in multiple sclerosis reveals
minimally-overlapping distributions and a possible greater relevance to cognition than to physical disability. These findings provide the first statistical neuroimaging
consensus for distributions of altered FA in the cerebral white matter associated with
the diagnosis of MS, cognition and physical disability, and may aid in understanding
the mechanisms underlying disability in MS.
While some studies had reported the posterior cingulum and splenium as having
lower FA in patients with greater physical disability19, 22, our results suggest that further, previously unassociated, areas are implicated. Ultrastructural damage to
NAWM, both as a direct result of the disease process and as a result of Wallerian
degeneration secondary to distal lesions43, may have gone undetected in individual analyses but, in combination, reached significance in our analysis. An additional
advantage of our approach is that the relatively large combined sample sizes
reduced the risk of observing false positive results. The meta-analysis confirms the
relationship between structures known to play key roles in subcortical cognitive
circuits such as the thalami, fornices44, and right posterior cingulum: the posterior cingulum has a role in mild cognitive impairment and Alzheimer’s disease45
, and its
integrity is important to several task-relevant aspects of cognition including sustained
attention and working memory46. Our analysis of cognitively-relevant tract injury has confirmed the importance of callosal involvement24, 47, 48 and shows an anterior-posterior gradient, with a greater cognitive relevance of lower FA in the genu and
anterior body of the corpus callosum. The higher z-scores associated with clusters
analysis indicates that cerebral white matter damage may be more relevant to
cognitive impairment than to physical disability.
While both physical disability and cognitive dysfunction in MS are multifactorial,
being mediated by injurious or adaptive changes at multiple sites in the central
nervous system (including grey matter and spinal cord damage in addition to
cerebral white matter), this meta-analysis supports the notion that disconnection of
grey matter regions by white matter damage is an important mechanism contributing
to the symptomatology of MS, particularly cognitive dysfunction. Recent research
explores the disconnection of widespread brain networks by other approaches 49, 50 and is consistent with the structural disconnection phenomenon demonstrated here
in suggesting that cognition may be mediated by brain networks’ functional
connectivity. For example, graph-theoretic analyses with fMRI51, 52 and EEG53 have shown that lower long-range regional integration and altered topological network
properties are associated with disease diagnosis, disability and cognition54, 55.
Our study was limited by three main factors. First, our meta-regressions, as well as
being inherently less powerful than the main meta-analyses, were based on the
reported mean values from the individual articles rather than the raw values; as
such, their results are less accurate than they could be and should, in particular, be
interpreted with caution. Second, our analysis of cognitively relevant WM FA
alteration included studies that used different tests of cognition, based on the overlap
in cognitive domains tested by them. The structure and range of this data may vary
between cognitive tests, which could have impacted the final result. Finally, although
SDM uses a p-value threshold considered to be equivalent to FDR, the impact of
false positives on this type of study is not well-understood. False positive results are
use of t-statistic maps instead of reported coordinates and the reduced number of
statistical tests involved when focussing only on the white matter tracts.
Nonetheless, to attempt to control false positives we performed a secondary analysis
with a more conservative threshold than that recommended by the authors of SDM,
in which the results of the group comparison and the comparison of FA and cognition
retained significance.
Given the concern about false positives, further work is needed to establish the
validity of the SDM method; for example, in comparison with other popular methods,
such as ALE. One major issue in that regard is that SDM offers no way to control the
proportion of false positives at the cluster level. Future work should explore further
the relationship of other DTI indices to brain function: while our study focussed on
the FA diffusion metric because it is a sensitive measure of microstructural
neuropathology57 that is an established marker of white matter degradation in MS and a commonly reported metric in TBSS studies, there is evidence that it does not
fully describe the tensor shape or distribution, and thus may not sufficiently describe
the underlying cellular changes57. Several studies have used the axial diffusivity (AD), radial diffusivity (RD) and MD metrics, noting widespread higher values
corresponding to lower values of FA, and, in some cases, that they were better
predictors of physical disability scores than FA16, 20-23, 29-31; however, further work is needed in this area to establish a consensus view.
In conclusion, this meta-analysis confirms that WM damage is widespread in MS and
that distributions of lower FA related to cognitive impairment and physical disability
are spatially distinct from one another. Our findings highlight a possible greater
References
1. Ge Y. Multiple Sclerosis: The Role of MR Imaging. American Journal of
Neuroradiology 2006;27:1165-1176.
2. Filippi M, Rocca MA, Benedict RHB, et al. The contribution of MRI in
assessing cognitive impairment in multiple sclerosis. Neurology 2010;75:2121-2128.
3. Charil A, Zijdenbos AP, Taylor J, et al. Statistical mapping analysis of lesion
location and neurological disability in multiple sclerosis: application to 452 patient
data sets. Neuroimage 2003;19:532-544.
4. Foong J, Rozewicz L, Quaghebeur G, et al. Executive function in multiple
sclerosis. The role of frontal lobe pathology. Brain 1997;120:15-26.
5. Rovaris M, Filippi M, Falautano M, et al. Relation between MR abnormalities
and patterns of cognitive impairment in multiple sclerosis. Neurology
1998;50:1601-1608.
6. Arnett PA, Rao SM, Bernardin L, Grafman J, Yetkin FZ, Lobeck L.
Relationship between frontal lobe lesions and Wisconsin Card Sorting Test
performance in patients with multiple sclerosis. Neurology 1994;44:420-425.
7. Swirsky-Sacchetti T, Mitchell DR, Seward J, et al. Neuropsychological and
structural brain lesions in multiple sclerosis: a regional analysis. Neurology
1992;42:1291-1295.
8. Tsolaki M, Drevelegas A, Karachristianou S, Kapinas K, Divanoglou D,
Routsonis K. Correlation of dementia, neuropsychological and MRI findings in
9. Iannucci G, Rovaris M, Giacomotti L, Comi G, Filippi M. Correlation of multiple
sclerosis measures derived from T2-weighted, T1-weighted, magnetization transfer,
and diffusion tensor MR imaging. Ajnr: American Journal of Neuroradiology
2001;22:1462-1467.
10. Rovaris M, Iannucci G, Falautano M, et al. Cognitive dysfunction in patients
with mildly disabling relapsing-remitting multiple sclerosis: an exploratory study with
diffusion tensor MR imaging. Journal of the Neurological Sciences
2002;195:103-109.
11. Ciccarelli O, Werring DJ, Wheeler-Kingshott CAM, et al. Investigation of MS
normal-appearing brain using diffusion tensor MRI with clinical correlations.
Neurology 2001;56:926-933.
12. Guo AC, MacFall JR, Provenzale JM. Multiple sclerosis: diffusion tensor MR
imaging for evaluation of normal-appearing white matter. Radiology
2002;222:729-736.
13. Werring DJ, Clark CA, Barker GJ, Thompson AJ, Miller DH. Diffusion tensor
imaging of lesions and normal-appearing white matter in multiple sclerosis.
Neurology 1999;52:1626-1632.
14. Filippi M, Cercignani M, Inglese M, Horsfield MA, Comi G. Diffusion tensor
magnetic resonance imaging in multiple sclerosis. Neurology 2001;56:304-311.
15. Smith SM, Jenkinson M, Johansen-Berg H, et al. Tract-based spatial
statistics: voxelwise analysis of multi-subject diffusion data. Neuroimage
16. Blaschek A, Keeser D, Müller S, et al. Early white matter changes in
childhood multiple sclerosis: a diffusion tensor imaging study. American Journal of
Neuroradiology 2013;34:2015-2020.
17. Bodini B, Khaleeli Z, Cercignani M, Miller DH, Thompson AJ, Ciccarelli O.
Exploring the relationship between white matter and gray matter damage in early
primary progressive multiple sclerosis: an in vivo study with TBSS and VBM. Human
brain mapping 2009;30:2852-2861.
18. Dineen RA, Vilisaar J, Hlinka J, et al. Disconnection as a mechanism for
cognitive dysfunction in multiple sclerosis. Brain 2009;132:239-249.
19. Giorgio A, Palace J, Johansen‐Berg H, et al. Relationships of brain white
matter microstructure with clinical and MR measures in relapsing‐remitting multiple
sclerosis. Journal of Magnetic Resonance Imaging 2010;31:309-316.
20. Hulst HE, Steenwijk MD, Versteeg A, et al. Cognitive impairment in MS
Impact of white matter integrity, gray matter volume, and lesions. Neurology
2013;80:1025-1032.
21. Kern KC, Sarcona J, Montag M, Giesser BS, Sicotte NL. Corpus callosal
diffusivity predicts motor impairment in relapsing-remitting multiple sclerosis: a TBSS
and tractography study. Neuroimage 2011;55:1169-1177.
22. Liu Y, Duan Y, He Y, et al. Whole brain white matter changes revealed by
multiple diffusion metrics in multiple sclerosis: a TBSS study. European journal of
radiology 2012;81:2826-2832.
23. Llufriu S, Martinez-Heras E, Fortea J, et al. Cognitive functions in multiple
24. Mazerolle EL, Wojtowicz MA, Omisade A, Fisk JD. Intra-individual variability
in information processing speed reflects white matter microstructure in multiple
sclerosis. NeuroImage: clinical 2013;2:894-902.
25. Onu M, Roceanu A, Sboto-Frankenstein U, et al. Diffusion abnormality maps
in demyelinating disease: correlations with clinical scores. European journal of
radiology 2012;81:e386-e391.
26. Raz E, Cercignani M, Sbardella E, et al. Clinically isolated syndrome
suggestive of multiple sclerosis: voxelwise regional investigation of white and gray
matter. Radiology 2010;254:227.
27. Roosendaal SD, Geurts JJG, Vrenken H, et al. Regional DTI differences in
multiple sclerosis patients. Neuroimage 2009;44:1397-1403.
28. Roosendaal SD, Schoonheim MM, Hulst HE, et al. Resting state networks
change in clinically isolated syndrome. Brain 2010;133:1612-1621.
29. Sbardella E, Petsas N, Tona F, et al. Assessing the correlation between grey
and white matter damage with motor and cognitive impairment in multiple sclerosis
patients. PloS one 2013;8:e63250.
30. Schoonheim MM, Vigeveno RM, Lopes FCR, et al. Sex‐specific extent and
severity of white matter damage in multiple sclerosis: Implications for cognitive
decline. Human brain mapping 2013;35:2348-2358.
31. Yu HJ, Christodoulou C, Bhise V, et al. Multiple white matter tract
abnormalities underlie cognitive impairment in RRMS. NeuroImage
32. Cader S, Johansen-Berg H, Wylezinska M, et al. Discordant white matter
N-acetylasparate and diffusion MRI measures suggest that chronic metabolic
dysfunction contributes to axonal pathology in multiple sclerosis. NeuroImage
2007;36:19.
33. Mori S, van Zijl PC. Fiber tracking: principles and strategies – a technical
review. NMR Biomed 2002;15:468-480.
34. Kurtzke JF. Rating neurologic impairment in multiple sclerosis: an expanded
disability status scale (EDSS). Neurology 1983;33:1444-1452.
35. Gronwall DMA. Paced auditory serial-addition task: A measure of recovery
from concussion. Perceptual and motor skills 1977;44:367-373.
36. Tombaugh TN. A comprehensive review of the Paced Auditory Serial Addition
Test (PASAT). Arch Clin Neuropsychol 2006;21:53-76.
37. Fischer JS, Rudick RA, Cutter GR, Reingold SC. The Multiple Sclerosis
Functional Composite Measure (MSFC): an integrated approach to MS clinical
outcome assessment. National MS Society Clinical Outcomes Assessment Task
Force. Mult Scler 1999;5:244-250.
38. Kmet LM, Lee RC, Cook LS. Standard quality assessment criteria for
evaluating primary research papers from a variety of fields. HTA Initiative 2004;13.
39. Radua J, Mataix-Cols D, Phillips ML, et al. A new meta-analytic method for
neuroimaging studies that combines reported peak coordinates and statistical
40. Peters BD, Szeszko PR, Radua J, et al. White Matter Development in
Adolescence: Diffusion Tensor Imaging and Meta-Analytic Results. Schizophrenia
Bulletin 2012;38:1308-1317.
41. Radua J, Mataix-Cols D. Voxel-wise meta-analysis of grey matter changes in
obsessive-compulsive disorder. The British Journal of Psychiatry 2009;195:393-402.
42. Smith A. Symbol Digit Modalities Test. Los Angeles, CA: Western
Psychological Services; 1991.
43. Lin F, Yu C, Jiang T, Li K, Chan P. Diffusion tensor tractography-based group
mapping of the pyramidal tract in relapsing-remitting multiple sclerosis patients.
American journal of neuroradiology 2007;28:278-282.
44. Dineen RA, Bradshaw CM, Constantinescu CS, Auer DP. Extra-Hippocampal
Subcortical Limbic Involvement Predicts Episodic Recall Performance in Multiple
Sclerosis. PloS one 2012;7:e44942.
45. Zhang Y, Schuff N, Jahng G-H, et al. Diffusion tensor imaging of cingulum
fibers in mild cognitive impairment and Alzheimer disease. Neurology 2007;68:13-19.
46. Takahashi M, Iwamoto K, Fukatsu H, Naganawa S, Iidaka T, Ozaki N. White
matter microstructure of the cingulum and cerebellar peduncle is related to sustained
attention and working memory: a diffusion tensor imaging study. Neuroscience
letters 2010;477:72-76.
47. Hasan KM, Gupta RK, Santos RM, Wolinsky JS, Narayana PA. Diffusion
tensor fractional anisotropy of the normal-appearing seven segments of the corpus
callosum in healthy adults and relapsing-remitting multiple sclerosis patients. Journal
48. Mesaros S, Rocca MA, Riccitelli G, et al. Corpus callosum damage and
cognitive dysfunction in benign MS. Human Brain Mapping 2009;30:2656-2666.
49. Louapre C, Perlbarg V, García-Lorenzo D, et al. Brain networks disconnection
in early multiple sclerosis cognitive deficits: An anatomofunctional study. Human
Brain Mapping 2014;35:4706-4717.
50. Sharp DJ, Scott G, Leech R. Network dysfunction after traumatic brain injury.
Nature Reviews Neurology 2014;10:156-166.
51. Dogonowski A-M, Andersen KW, Madsen KH, et al. Multiple sclerosis impairs
regional functional connectivity in the cerebellum. NeuroImage: Clinical
2014;4:130-138.
52. Rocca M, Valsasina P, Absinta M, et al. Default-mode network dysfunction
and cognitive impairment in progressive MS. Neurology 2010;74:1252-1259.
53. Van Schependom J, Gielen J, Laton J, D’hooghe MB, De Keyser J, Nagels G.
Graph theoretical analysis indicates cognitive impairment in MS stems from neural
disconnection. NeuroImage: Clinical 2014;4:403-410.
54. He Y, Dagher A, Chen Z, et al. Impaired small-world efficiency in structural
cortical networks in multiple sclerosis associated with white matter lesion load. Brain
2009;132:3366-3379.
55. Shu N, Liu Y, Li K, et al. Diffusion tensor tractography reveals disrupted
topological efficiency in white matter structural networks in multiple sclerosis.
56. Tench CR, Tanasescu R, Auer DP, Constantinescu CS. Coordinate BAsed
Meta-Analysis of Functional Neuroimaging Data; False Discovery Control and
Diagnostics. PLoS ONE 2013;8:e70143.
57. Ni H, Kavcic V, Zhu T, Ekholm S, Zhong J. Effects of number of diffusion
gradient directions on derived diffusion tensor imaging indices in human brain.
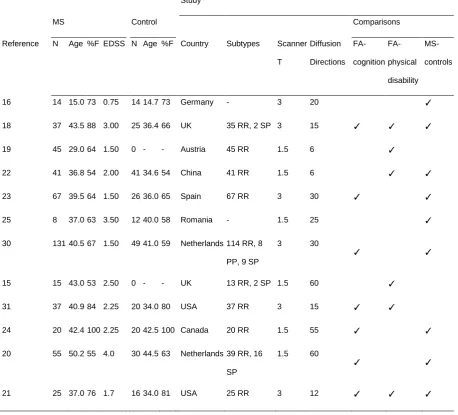
Table 1. Studies included in the final meta-analyses.
Study
MS Control Comparisons
Reference N Age %F EDSS N Age %F Country Subtypes Scanner T
Diffusion Directions
FA-cognition
FA-physical disability
MS-controls
16 14 15.0 73 0.75 14 14.7 73 Germany - 3 20 ✓
18 37 43.5 88 3.00 25 36.4 66 UK 35 RR, 2 SP 3 15 ✓ ✓ ✓
19 45 29.0 64 1.50 0 - - Austria 45 RR 1.5 6 ✓
22 41 36.8 54 2.00 41 34.6 54 China 41 RR 1.5 6 ✓ ✓
23 67 39.5 64 1.50 26 36.0 65 Spain 67 RR 3 30 ✓ ✓
25 8 37.0 63 3.50 12 40.0 58 Romania - 1.5 25 ✓
30 131 40.5 67 1.50 49 41.0 59 Netherlands 114 RR, 8 PP, 9 SP
3 30
✓ ✓
15 15 43.0 53 2.50 0 - - UK 13 RR, 2 SP 1.5 60 ✓
31 37 40.9 84 2.25 20 34.0 80 USA 37 RR 3 15 ✓ ✓
24 20 42.4 100 2.25 20 42.5 100 Canada 20 RR 1.5 55 ✓ ✓
20 55 50.2 55 4.0 30 44.5 63 Netherlands 39 RR, 16 SP
1.5 60
✓ ✓
21 25 37.0 76 1.7 16 34.0 81 USA 25 RR 3 12 ✓ ✓ ✓
Abbreviations: RR = relapsing-remitting; SP = secondary progressive; PP = primary
Supplemental Table e-1. The quality assessment criteria and scores.
Criterion W
e igh t B las c h e k 2 0 1 3 D ine e n 2 0 0 9 Gio rg io 2 0 1 0 L iu 2 0 1 2 L luf riu 2 0 1 3 On u 2 0 1 2 S c h o o n h e im 2 0 1 3 S mi th 2 0 0 6 Y u 2 0 1 2 Maz e ro lle 2 0 1 3 H u ls t 2 0 1 3 K e rn 2 0 1 1
Did the authors have a clear a priori hypothesis and
design? 3 ✓ ✓ ✓ ✓ ✓ ✓ ✓ ✓ ✓ ✓ ✓ ✓
Did all members of the MS group have a
clinically-definite diagnosis? 1 ✓ ✓ N ✓ ✓ ? ✓ ✓ ✓ ✓ ✓ ✓
Were the treatments currently being received by
members of the MS group recorded? 1 ✓ ✓ ✓ ✓ N N ✓ N N ✓ ✓ ✓ Did the authors justify their chosen FA threshold? 1 ✓ ✓ N N N N ✓ ✓ ✓ N N N Did the DTI protocol use 20 or more diffusion
directions? 3 ✓ N N N ✓ ✓ ✓ ✓ N ✓ ✓ N
Did the scanner used have a magnet strength of 3
Tesla or greater? 3 ✓ ✓ N N ✓ N ✓ N ✓ N N ✓
Did members of the MS group undergo clinical
assessment at the time of participation? 1 ✓ ✓ ✓ ✓ N ✓ ✓ ✓ ✓ N ✓ ✓ Did all subjects receive the same intervention using the
same facilities? 2 ✓ ✓ ✓ ✓ ✓ ✓ ✓ ✓ ✓ ✓ ✓ ✓
Were the data processing steps appropriate
considering the hypothesis? 2 ✓ ✓ ✓ ✓ ✓ ✓ ✓ ✓ ✓ ✓ ✓ ✓ Total 17 17 14 9 10 14 11 17 13 13 12 13 13 Percent 100 82 53 59 82 65 100 77 77 71 77 77
Supplemental Table e-2. Significant regional correlations between FA and MS
diagnosis.
Cluster Group Name & Sub-Clusters (a)
MNI Coordinates
SDM
Z-Value (b) P-Value
(c) Number of Voxels (d)
Cluster Breakdown (Number of Voxels) (d)
Lower FA associated with MS diagnosis (patients < controls)
Corpus callosum body 16, -26, 32 7.139 <0.000000001 4379 Corpus callosum body (531) Corpus callosum genu (307) Corpus callosum splenium (304) R posterior thalamic radiation (159)
BA 20 (138)
L posterior thalamic radiation (128) L anterior corona radiata (125) BA 18 (125)
L thalamus (102)
R posterior corona radiata (97) BA 37 (92)
R anterior corona radiata (91) R sagittal stratum (88) BA 20 (81)
L fornix crus / stria terminalis (80) Cerebellum 4, -56, -18 4.997 0.000001 160 Middle cerebellar peduncle (40)
R inferior cerebellar peduncle (12) BA 37 (11)
BA 18 (11) BA 10 14, 58, 10 4.704 0.000008 48 BA 9 (16)
BA 31 (11) BA 43 56, -10, 24 4.561 0.00001 54 BA 47 (13) BA 9 -10, 36, 46 4.415 0.00002 44 BA 31 (12) BA 9 (11) BA 47 -46, 14, 12 4.314 0.00004 59 BA 47 (23)
BA 5 (15) BA 47 (11)
R cerebellum lobule VI 8, -68, -24 4.080 0.0001 20 R cerebellum lobule VI (14) BA 22 58, -30, 10 3.984 0.0001 20 BA 41 (10)
BA 22 (10) Higher FA associated with
MS diagnosis (patients > controls)
R posterior internal
capsule 26, -16, 14 -1.322 0.0000009 24
R posterior internal capsule (21)
(a) Cluster group names assigned by SDM are illustrative and do not necessarily describe contiguous clusters.
(b) Voxel probability threshold: p = 0.005. (c) Peak height threshold: z = 1.
Supplemental Table e-3. Significant regional correlations between FA and EDSS
scores in MS patients.
Cluster Group Name (a) MNI Coordinates
SDM
Z-Value (b) P-Value
(c) Number of Voxels (d)
Cluster Breakdown (Number of Voxels) (d)
Lower FA associated with greater disability (FA < EDSS)
L Fornix crus / stria
terminalis -30, -22, -8 1.701 0.00003 323
Corpus callosum splenium (96) L fornix crus / stria terminalis (37) L thalamus (26)
Corpus callosum body (25) R posterior thalamic radiation (18) BA 18 (12)
R thalamus (11) Lower FA associated with
less disability (FA > EDSS) (none)
(a) Cluster group names assigned by SDM are illustrative and do not necessarily describe contiguous clusters.
(b) Voxel probability threshold: p = 0.005. (c) Peak height threshold: z = 1.
Supplemental Table e-4. Significant regional correlations between FA and cognitive
test scores in MS patients.
Cluster Group Name (a) MNI Coordinates
SDM
Z-Value (b) P-Value
(c) Number of Voxels (d)
Cluster Breakdown (Number of Voxels) (d)
Lower FA associated with poorer performance (FA < test scores)
Fornix crus / stria
terminalis -24, -34, 4 2.532 <0.000000001 980
Corpus callosum genu (211) Corpus callosum body (199) L thalamus (103)
Corpus callosum splenium (75) R thalamus (68)
R cingulum (36)
L fornix crus / stria terminalis (31) R fornix crus / stria terminalis (19) BA 22 (14)
L cingulum (13) BA 48 (12) R posterior thalamic
radiation 28, -64, 14 2.013 0.00003 19
R posterior thalamic radiation (16) L posterior thalamic
radiation -34, -58, 14 1.998 0.00004 42
L posterior thalamic radiation (12) BA 20 44, 10,
-30 1.900 0.0001 20
BA 20 (13) BA 41 56, -36, 16 1.724 0.0009 12 BA 41 (11) Lower FA associated with
better performance (FA > test scores)
(none)
(a) Cluster group names assigned by SDM are illustrative and do not necessarily describe contiguous clusters.
(b) Voxel probability threshold: p = 0.005. (c) Peak height threshold: z = 1.
Supplemental Table e-5. Relevance of WM degradation in MS to EDSS score: meta
regression analyses.
MNI Coordinates
SDM
Z-Value (a) P-Value
(b) Number of Voxels (c)
Cluster Breakdown (Number of Voxels) (c) EFFECTS OF MEAN AGE
(none)
EFFECTS OF MEAN EDSS SCORE (none)
EFFECTS OF NUMBER OF DIFFUSION DIRECTIONS
Greater FA-EDSS correlations specific to patients who were scanned with many diffusion directions (many diffusion directions > few diffusion directions)
Posterior Cingulum -18, -40, -4 2.380 0.000009 13 L BA 27 (11)
(a) Voxel probability threshold: p = 0.0005 for the slope and one intercept. (b) Peak height threshold: z = 1.
Supplemental Table e-6. Significant assocaiations between FA and MS diagnosis:
sensitivity analysis.
Lower FA associated with MS diagnosis
Higher FA associated with MS diagnosis Excluded study Corpus callosum body
Cerebellum BA 10 BA 43 BA 9 BA 47 R cerebellum lobule VI BA 22 R posterior internal capsule
Number of cluster groups surviving when excluding the study
Blaschek Yes Yes YesYesYesYesYes Yes Yes 9 of 9 Dineen Yes Yes Yes Yes Yes Yes Yes No Yes 8 of 9 Liu Yes Yes No Yes Yes No Yes No No 5 of 9 Llufriu Yes Yes YesYesYesYesYes Yes Yes 9 of 9 Onu Yes Yes YesYesYesYesYes Yes Yes 9 of 9 Schoonheim Yes Yes No Yes Yes Yes Yes Yes Yes 8 of 9 Mazerolle Yes Yes Yes Yes Yes Yes Yes Yes Yes 9 of 9 Hulst Yes Yes No Yes Yes Yes Yes Yes Yes 8 of 9 Kern Yes Yes Yes Yes Yes Yes Yes Yes Yes 9 of 9
Number of jack-knife
analyses survived by the cluster group
9 of 9 9 of 9 6 of 9 9 of 9 9 of 9 8 of 9 9 of 9
7 of 9 8 of 9
The table shows, by excluding each study from the meta-analysis one-by-one, which
cluster groups were retained in the result. Each cluster group detected in the signed
differential map is a column. A “Yes” indicates that the cluster in that column was still
present in the result when re-running the meta-analysis with the study in that row
Supplmental Table e-7. Significant regional correlations between FA and EDSS
scores in MS patients: sensitivity analysis.
Lower FA associated with greater disability
Excluded study L fornix crus / stria terminalis Number of cluster groups surviving when excluding the study
Dineen Yes 1 of 1
Giorgio Yes 1 of 1
Liu No 0 of 1
Smith Yes 1 of 1
Yu Yes 1 of 1
Kern No 0 of 1
Number of jack-knife analyses survived by the cluster group 4 of 6
The table shows, by excluding each study from the meta-analysis one-by-one, which
cluster groups were retained in the result. Each cluster group detected in the signed
differential map is a column. A “Yes” indicates that the cluster in that column was still
present in the result when re-running the meta-analysis with the study in that row
Supplemental Table e-8. Significant regional correlations between FA and cognitive
test scores in MS patients: sensitivity analysis.
Lower FA associated with poorer performance Excluded study Fornix crus / stria
terminalis
R posterior thalamic radiation
L posterior thalamic radiation
BA 20
BA 41
Number of cluster groups surviving when excluding the study
Dineen Yes No Yes Yes Yes 4 of 5
Llufriu Yes Yes Yes No Yes 4 of 5
Schoonheim No No Yes Yes No 2 of 5
Yu Yes Yes Yes No Yes 4 of 5
Hulst No No Yes No Yes 2 of 5
Kern Yes Yes Yes Yes No 4 of 5
Mazerolle Yes Yes Yes Yes Yes 5 of 5 Number of jack-knife analyses
survived by the cluster group 5 of 7 4 of 7 7 of 7
4 of 7
5 of 7
The table shows, by excluding each study from the meta-analysis one-by-one, which
cluster groups were retained in the result. Each cluster group detected in the signed
differential map is a column. A “Yes” indicates that the cluster in that column was still
present in the result when re-running the meta-analysis with the study in that row
Figure 1. Flowchart summarising the literature search process.
Figure 2. Comparison of FA in MS to FA in healthy controls. The images show the
weighted mean across studies overlaid on the 1mm MNI 152 brain. Red voxels show
areas in which lower FA for individuals with MS was significantly associated with
disease status, and blue voxels, higher FA (from left to right, the slice coordinates
are: z=75, z=90, z=98, x=100).
Figure 3. Significant regional correlations between FA and measures of physical
disability and cognition. The images show the weighted mean across studies
overlaid on the 1mm MNI 152 brain. In part A, red voxels show areas in which lower
FA was significantly associated with greater physical disability (from left to right, the
slice coordinates are: z=72, z=88, z=95, x=90). In part B, red voxels show areas in
which lower FA was significantly assoicated with more impaired cognition (from left
to right, the slice coordinates are: z=73, z=82, z=95, x=90). Part C shows, in pink,
the significant (positive) voxels common to both physical disability and cognition