ISSN Online: 2327-4344 ISSN Print: 2327-4336
DOI: 10.4236/gep.2019.74016 Apr. 29, 2019 239 Journal of Geoscience and Environment Protection
Climate Suitability and Vulnerability of Winter
Wheat Planting in Gansu under the Background
of Global Warming
Xing Wang
1, Yuhe Ji
2, Guangsheng Zhou
2, Sheng Wang
3, Xiaoying Yao
41Northwest Regional Climate Center, Lanzhou, China
2State Key Laboratory of Severe Weather (LASW), Chinese Academy of Meteorological Sciences, Beijing, China 3Lanzhou Institute of Aridology, China Meteorological Administration, Lanzhou, China
4Tianshui Meteorological Bureau, Tianshui, China
Abstract
Winter wheat is the main food crop in China. Gansu Province is a traditional winter wheat growing area, and its planting range is limited by the thermal conditions of winter. The average temperature in Gansu Province increased by 0.28˚C per decade, higher than the China’s and global average, and the warming in winter was more obvious. Therefore, it is necessary to study the climate suitability and vulnerability of winter wheat planting in Gansu. In this paper, the maximum entropy model Maxent and Arcgis software are used to select six major climatic factors including annual total radiation, annual pre-cipitation, the warmest monthly average temperature, the coldest monthly average temperature, annual average temperature, and annual extreme min-imum temperature, which construct winter wheat planting distribution-climate relationship model that studies the climate suitability and vulnerability of win-ter wheat during the period 1961-2015. Studies have shown that the average cold weather and annual extreme minimum temperature are the most impor-tant climatic factors affecting winter wheat in Gansu, which can reflect the low temperature conditions that winter wheat can tolerate. However, the main winter wheat planting areas in Gansu Province are distributed in arid and semi-arid rain-fed agriculture areas. Precipitation and total annual radiation are also very important constraints. At the same time, climate change has lit-tle effect on winter wheat in Gansu Province, and the area of suitable area fluctuates slightly. It shows moderate adaptation in each evaluation period.
Keywords
Winter Wheat, Climate Suitability and Vulnerability, Maxent Model, Threshold Curve
How to cite this paper: Wang, X., Ji, Y. H., Zhou, G. S., Wang, S., & Yao, X. Y. (2019). Climate Suitability and Vulnerability of Winter Wheat Planting in Gansu under the Background of Global Warming. Journal of Geoscience and Environment Protection, 7, 239-250.
https://doi.org/10.4236/gep.2019.74016
Received: September 20, 2018 Accepted: April 26, 2019 Published: April 29, 2019
Copyright © 2019 by author(s) and Scientific Research Publishing Inc. This work is licensed under the Creative Commons Attribution International License (CC BY 4.0).
DOI: 10.4236/gep.2019.74016 240 Journal of Geoscience and Environment Protection
1. Introduction
Crop cultivation, as a production activity that relies heavily on climatic condi-tions, shows more pronounced vulnerability in the context of global warming (Burton et al., 2002; Ragab & Prudhomme, 2002; Alam et al., 2013). The changes in meteorological factors seriously affect the changes in the pattern of agricul-tural production resources. The changes in environmental conditions of radia-tion, temperature and water caused by climate change directly affect the growth of crops and the changes in phenological period, which in turn cause fluctua-tions in crop yields (Fernanda & Maria, 2009; Ning, 2016). Gansu Province is located at the intersection of the three plateaus of the Qinghai-Tibet Plateau, the Loess Plateau and the Mongolian Plateau. It is also the province of China with three climatic zones including the westerly climate zone, the eastern monsoon zone and the Qinghai-Tibet Plateau climatic region. It is affected by the East Asian monsoon and the South Asian monsoon. The transition zone to the wes-terly climate impact system (Deng et al., 2008) is a typical climate change sensi-tive area and ecologically vulnerable area (Zhang et al., 2016;Han et al., 2016). The average temperature in Gansu Province increased by 0.28˚C per decade, higher than the China’s and global average, and the warming rate in winter was even higher (Shang et al., 2018; Deng et al., 2008), indicating that winter warm-ing is more obvious. Winter wheat is the main traditional food crop in China, and the winter wheat planting range is mainly limited by the wintering heat conditions. Therefore, the winter wheat planting range is more affected by the climate.
Vegetation is a fragile surface cover type that is the result of long-term inte-ractions between climate factors, geomorphology, soil and human activities. The area, type, structure and composition of vegetation and its spatial and event succession are determined by the climate of the geological era and the modern climate. At regional and global scales, climate is considered to be the most im-portant factor controlling the geographical distribution of vegetation (Zhou &
Wang, 2003). Modeling and prediction of crop species distribution are very
DOI: 10.4236/gep.2019.74016 241 Journal of Geoscience and Environment Protection
case of incomplete data distribution of species, the results can still be obtained with MaxEnt model prediction. Ma et al. (2013) used the MaxEnt model and ArcGis software to predict the potential distribution of Brassica and Woody plants in China at the “genus” level. As early as 1957, Jaynes proposed the theory of Maximum entropy (MaxEnt) for probability density assessment (Philips et al., 2004, Philips et al., 2006). Since then, MaxEnt has gradually applied in computer science and statistics, especially in Natural language processing is widely used. This theory can be expressed in bioecology as a species that, when uncon-strained, will spread as much as possible, close to a uniform distribution, and can be used to predict the potential geographic distribution of a species (Phillips et al., 2006). MaxEnt model can still get satisfactory results when the species dis-tribution data is incomplete.
Gansu winter wheat is mainly distributed in the Longdong Loess Plateau in Hedong, Gansu, the upper reaches of the Weihe River in the Loess Plateau in the west of Gansu, and the southern part of Gansu Province. It is one of the main food crops in Gansu Province. The planting area accounts for more than 20% of the total grain area of Gansu, and its planting range is affected by wintering. The limitation of thermal conditions makes it more necessary to study the climate suitability and vulnerability of winter wheat planting in Gansu in the context of climate warming.
2. Model Applicability Evaluation
Applying the MaxEnt model to study the climate suitability of winter wheat planting distribution in Gansu, we must first test the applicability of the MaxEnt model. Here, the model input data includes two categories: one is the geograph-ical distribution data of the target, using the geographgeograph-ical distribution data of 40 winter wheat agrometeorological observation stations (showing in Figure 1) in the winter wheat growing area of Gansu; the second is the environmental varia-ble, according to the period from 1961 to 1990. Grid daily climate data (10 km resolution), calculated by Arcgis software to 6 climatic factors, including annual total radiation, annual precipitation, warmest monthly average temperature, coldest monthly average temperature, annual average temperature, annual ex-treme minimum temperature the 30-year average during the base period (1961-1990) was used as an environmental input variable for constructing a dis-tribution-climate relationship model for winter wheat planting. Import the two types of data into the MaxEnt model and set the relevant parameters to run.
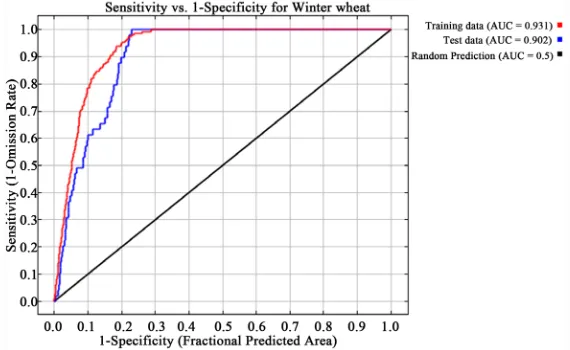
First, 75% of the total data set is randomly obtained as a training subset to train the model to obtain the relevant parameters of the model; then, all the data that does not participate in the model training, i.e. the remaining 25%, is used as a test subset for verification model. The ROC curve of the winter wheat planting distribution-climate relationship model based on six climatic factors is shown in Figure 2.
DOI: 10.4236/gep.2019.74016 242 Journal of Geoscience and Environment Protection
subset AUC value reached 0.902, the training subset AUC value also reached 0.931, and the AUC value was higher than 0.90 (Figure 2). It indicates that the prediction accuracy of the constructed model reaches the “very good” standard, and the MaxEnt model can be used to study the potential planting distribution of winter wheat in Gansu Province.
3. Analysis of Influence Factors of Winter Wheat Planting
Distribution
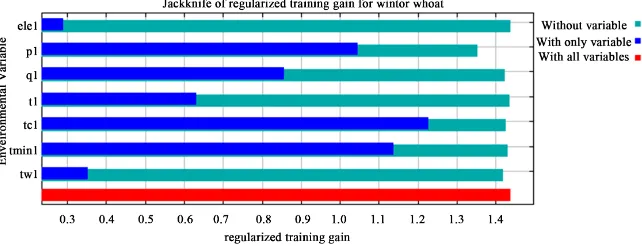
[image:4.595.232.516.221.463.2]Among the percent contribution rate and the importance of displacement, the
Figure 1. Geographical distribution of agro-meteorological observation station (the red
points in the figure) in Gansu winter wheat growing area (Source of data: Northwest re-gional climate center of China).
Figure 2. ROC curve of MaxEnt model simulation results for winter wheat planting
[image:4.595.230.515.518.693.2]DOI: 10.4236/gep.2019.74016 243 Journal of Geoscience and Environment Protection
[image:5.595.213.534.409.532.2]rankings of the effects of climatic factors on the geographical distribution of winter wheat planting are (Table 1 and Figure 3): the coldest month average temperature (Tc) > annual precipitation (P) > annual total radiation (Q) > An-nual Extreme Minimum Temperature (Tmin) > The warmest monthly average temperature (Tw) > Altitude (Ele) > Annual average temperature (T). The im-portance of the climatic factors on the distribution of winter wheat planting areas in Gansu Province according to the knife method shows that the coldest month average temperature and the annual extreme minimum temperature have the most important climatic factors affecting the distribution of winter wheat planting areas. At the same time, combined with the comprehensive analysis of
Table 1, the importance of climate factors affecting winter wheat in Gansu
Province is: the coldest month average temperature > annual extreme minimum temperature > annual precipitation > annual total radiation. The distribution of winter wheat planting areas is usually determined by the thermal conditions of winter wheat that can be safely wintered. The coldest month average tempera-ture and annual extreme minimum temperatempera-ture can reflect the low temperatempera-ture conditions that winter wheat can tolerate, but the main winter wheat planting areas in Gansu are distributed in drought and semi-arid rain-fed agricultural areas, annual precipitation and annual total radiation are also very important constraints, which is also an important difference between Gansu Province and other regions. See Figure 3.
[image:5.595.212.538.596.729.2]Figure 3. The score of the climatic factor in the knife method.
Table 1. Percentage contribution rate and replacement importance of environmental
va-riables to winter wheat planting area distribution.
Climatic factor contribution (%) Percentage of importance (%) Displacement
The coldest month average temperature (Tc) 44.5 3.7
Annual precipitation (P) 37.5 42.9
Annual total radiation (Q) 8.5 34.8
Extreme minimum temperature (Tmin) 7.3 4.8 Warmest monthly average temperature (Tw) 1.7 10.5
Altitude (Tc) 0.4 2.5
DOI: 10.4236/gep.2019.74016 244 Journal of Geoscience and Environment Protection
4. Classification of Climate Suitability for Winter Wheat
Planting
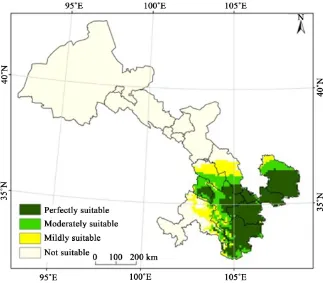
Based on the existence probability and climate resource guarantee rate of six climatic factors affecting the distribution of winter wheat planting in China, the climate suitability grades were classified by 60%, 76% and 85% climatic resource guarantee rates of six climatic factors, and the winter wheat of Gansu was con-structed by MaxEnt model. The planting distribution-climate relationship model can obtain the existence probability P of the winter wheat crop in Gansu Prov-ince in the area to be predicted. The classification criteria are: when 0 ≤ P < 0.05 (0.606), it is not suitable for climate; when 0.05 ≤ P < 0.19 (0.766), it is mildly suitable for climate; when 0.19 ≤ P < 0.38 (0.856), it is climate moderately suita-ble; when P ≥ 0.38, it is completely suitable for climate (Zhou et al. 2015). Figure 4 shows the climatic suitability classification of winter wheat planting distribu-tion in Gansu by the ArcGIS software during baseline period (1961-1990). Dif-ferent colors represent the climatic suitability of difDif-ferent wheat plantings.
[image:6.595.211.534.423.706.2]The climate suitable for distribution of winter wheat in Gansu Province counts for 23% of Gansu’s total area, the moderately moderate climate area ac-counts for 15%, the mild climate suitable area acac-counts for 5%, and the climate unsuitable area accounts for 57%. Affected by climatic conditions, winter wheat planting in Gansu from 1961 to 1990 was mainly concentrated in the parts of the eastern part of Gansu Province and the southern part of Gannan. The climate unsuitable area is in the Hexi area and the Gannan Plateau.
DOI: 10.4236/gep.2019.74016 245 Journal of Geoscience and Environment Protection
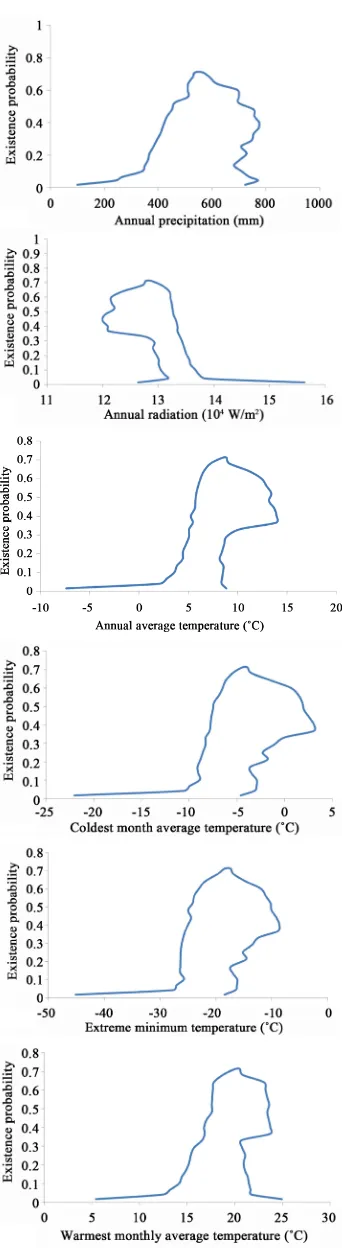
5. Threshold Analysis of Winter Wheat Impact
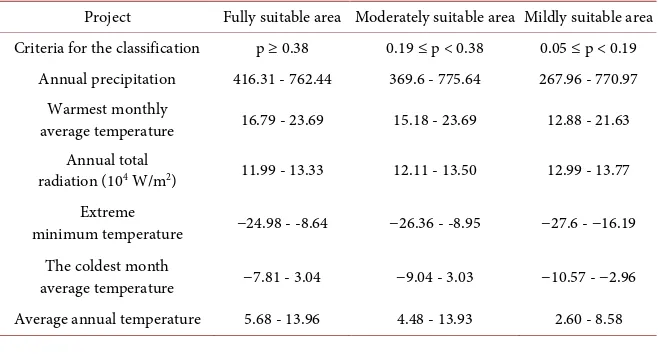
Using existence probability corresponding curve of climatic factors affecting the distribution of winter wheat (Figure 5), the curves are irregularly distributed in the shape of a bell. This bell-shape distribution means that the basic perfor-mance is that the existence probability of winter wheat increases with the in-crease of climatic factors and then dein-crease. The distribution of climate suitabil-ity of winter wheat in Gansu can be given in Figure 5 and Table 2. The com-pletely suitable areas are distributed in Tianshui, Pingliang, Longnan City, southern Qingyang, Dingxi East, south of Baiyin City, Central Linxia, Gannan Prefecture; moderately suitable areas are distributed in the north-central part of Qingyang, southern Lanzhou, southwest of Dingxi, The central and southern parts of Baiyin City, the southern and northern parts of Linxia Prefecture, the western part of Gannan Prefecture, and the southern part of Gannan Prefecture; the mildly suitable areas are distributed in the northern part of Qingyang City, the central part of Baiyin City, the northern part of Lanzhou City, the eastern part of Gannan Prefecture, the part of Dingxi City, and the part of Longnan City and Wuwei City, China.
6. Distribution Pattern and Dynamic Change of Climatically
Suitable Regions of Winter Wheat
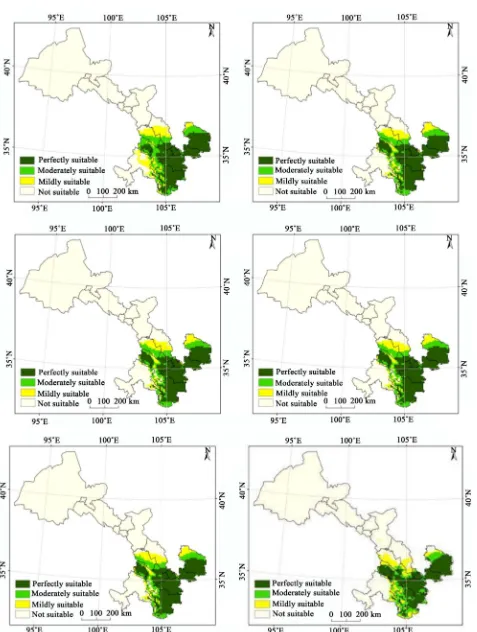
[image:7.595.210.539.556.733.2]MaxEnt simulated the dynamic changes of suitable areas of winter wheat in Gansu Province in the period of 1961-1990, 1966-1995, 1971-2000, 1976-2005, 1981-2010 and 1986-2015 (showing in Figure 6 and Figure 7 and Table 3). From the perspective of spatial distribution pattern, compared with the reference period (1961-1990), the area of fully suitable, moderately suitable, and mildly suitable areas for winter wheat planting in Gansu Province decreased slightly from 1966 to 1995 (5% - 20%). The variability of the area change in each region-al classification from 1971 to 2015 was very smregion-all, and the three periods of 1966-1995, 1971-2000 and 1976-2005 were basically unchanged. Compared with
Table 2. Distribution of winter wheat planting in Gansu and climate factor thresholds in
different climate-appropriate areas.
Project Fully suitable area Moderately suitable area Mildly suitable area Criteria for the classification p ≥ 0.38 0.19 ≤ p < 0.38 0.05 ≤ p < 0.19
Annual precipitation 416.31 - 762.44 369.6 - 775.64 267.96 - 770.97 Warmest monthly
average temperature 16.79 - 23.69 15.18 - 23.69 12.88 - 21.63 Annual total
radiation (104 W/m2) 11.99 - 13.33 12.11 - 13.50 12.99 - 13.77 Extreme
minimum temperature −24.98 - -8.64 −26.36 - -8.95 −27.6 - −16.19 The coldest month
DOI: 10.4236/gep.2019.74016 246 Journal of Geoscience and Environment Protection
DOI: 10.4236/gep.2019.74016 247 Journal of Geoscience and Environment Protection
Figure 6. Dynamic change of climate suitable area for winter wheat planting distribution in Gansu. (a) 1961-1990; (b) 1966-1995;
DOI: 10.4236/gep.2019.74016 248 Journal of Geoscience and Environment Protection
Figure 7. Dynamic change of climate suitable area change of winter wheat in Gansu.
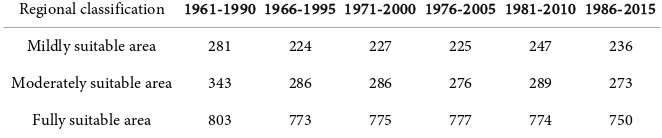
Table 3. Changes in the area of different climate suitable areas of winter wheat in Gansu Province (102 km2).
Regional classification 1961-1990 1966-1995 1971-2000 1976-2005 1981-2010 1986-2015 Mildly suitable area 281 224 227 225 247 236 Moderately suitable area 343 286 286 276 289 273
Fully suitable area 803 773 775 777 774 750
the first three periods, the moderately suitable and mildly suitable areas in-creased slightly (5% - 10%) from 1981 to 2010, and the area of fully suitable areas decreased slightly (4%) from 1986 to 2015, while mildly suitable. The dis-trict increased slightly (5%).
7. Vulnerability and Adaptability of Winter Wheat to
Climate Change
This study used the vulnerability index (V), the adaptive index (Al) and the ex-tended fitness index (Ae) to assess the adaptability and vulnerability of winter wheat to climate change in Gansu. Based on the spatial analysis function of ArcGIS software, based on the reference period (1961-1990), the vulnerable areas of winter wheat planting areas, local adaptive areas and extended adapta-tion areas and their respective average existence probability were identified (Table 4). The vulnerability and fitness indicators are then calculated (Table 5).
[image:10.595.208.539.310.379.2]DOI: 10.4236/gep.2019.74016 249 Journal of Geoscience and Environment Protection
Table 4. Area (km2) of suitable area of winter wheat in Gansu Province in different
pe-riods and its existence probability
Research period Evaluation data
Base period 1961-1990 Sik + Sim Sik∙pik + Sim∙pim
107,400 36,721.2
Evaluation period
Evaluation period Sjk Sjk ∙ pjk Sjm Sjm ∙ pjm Sjl Sjl ∙ pjl 1966-1995 11,000 440 128,200 51543 100 12 1971-2000 10,100 393.9 129,100 51,716.6 100 7.48 1976-2005 11,400 424.8 127,900 51,433.6 400 29.9 1981-2010 13,200 467.4 126,200 50,771.2 1700 118.6 1986-2015 14,300 508.3 125,800 48,957.9 2230 208.8 Note: Sik + Sim is the appropriate area of the base period, Sikpik + Simpim is the sum of the product area of the reference period and the existence probability, Sjk is the vulnerable area of the assessment period, pjk is the average existence probability of the vulnerable area, and Sjm is the locality of the assessment period. The adaptive area, pjm is the existence probability of the local adaptive region average, (Sjl) is the area for expanding the adaptation period during the evaluation period, and pjl is the existence probability of ex-panding the average of the adaptation region.
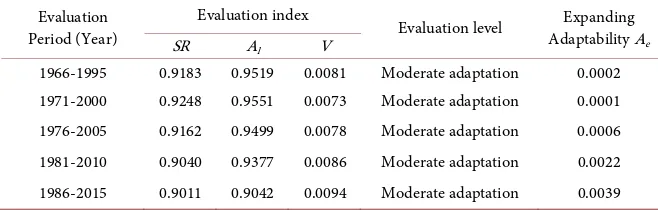
Table 5. Evaluation of adaptability and vulnerability of winter wheat to climate change in gansu province from 1961 to 2015.
Evaluation Period (Year)
Evaluation index
Evaluation level Adaptability AExpanding e
SR Al V
1966-1995 0.9183 0.9519 0.0081 Moderate adaptation 0.0002 1971-2000 0.9248 0.9551 0.0073 Moderate adaptation 0.0001 1976-2005 0.9162 0.9499 0.0078 Moderate adaptation 0.0006 1981-2010 0.9040 0.9377 0.0086 Moderate adaptation 0.0022 1986-2015 0.9011 0.9042 0.0094 Moderate adaptation 0.0039 Note: SR is the ratio of the area of the local adaptive period of the evaluation period to the area of the ap-propriate period of the reference period, Al is local adaptive, V is vulnerability, and Ae is for adaptability.
Acknowledgements
This research was jointly funded by the National Natural Science Foundation of China (41630426 and 41875022) and the Gansu Provincial Meteorological Situa-tion Research Project (GSMAMs2017-12), China.
Conflicts of Interest
The authors declare no conflicts of interest regarding the publication of this paper.
References
Alam, M. M., Siwar, C., Jaafar, A. H. et al. (2013). Agricultural Vulnerability and Adapta-tion to Climatic Changes in Malaysia: Review on Paddy Sector. Current World Envi-ronment, 8, 1-12. https://doi.org/10.12944/CWE.8.1.01
Burton, I., Huq, S., Lim, B. et al. (2002). From Impacts Assessment to Adaptation Priori-ties: The Shaping of Adaptation Policy. Climate Policy, 2, 145-159.
[image:11.595.209.538.328.433.2]DOI: 10.4236/gep.2019.74016 250 Journal of Geoscience and Environment Protection Elith, J., Graham, C. H., Anderson, R. P. et al. (2006). Novel Methods Improve Prediction
of Species’ Distributions from Occurrence Data. Ecography, 29, 129-151.
Fernanda, M. S., & Maria, L. F. (2009). Climate Change and Its Marginalizing Effect on Agriculture. Ecologicaleconomics, 68, 896-904.
Han, L., Zhang, Q., Zhao, H., Huang, T., Jia, J., & Zhang, X. (2016). Characteristics of Agricultural Drought Disaster Loss in Gansu Province and Its Response to Climate Warming. Journal of Desert Research, 36, 767-776.
Lei, J., & Xu, H. (2010). Prediction of Potential Distribution Area of Solidago canadensis
in China Based on MaxEnt. Journal of Ecology and Rural Environment, 26, 137-141. Ma, Y., Li, D., Yu, J. et al. (2013). The Relationship between the Distributed Genus and
Climatic Factors of Chinese Genus and Woody Genus. Biodiversity, 212, 177-184. https://doi.org/10.3724/SP.J.1003.2013.08102
Ning, X. (2016). Research on Environmental Adaptability of Major Food Crops in China under Climate Change. Zhengzhou: Henan University.
Philips, S. J., Anderson, R. P., & Schapire, R. E. (2006). Maximum Entropy Modeling of Species Geographic Distributions. Ecological Modelling, 190, 231-259.
https://doi.org/10.1016/j.ecolmodel.2005.03.026
Philips, S. J., Dudik, M., & Schapire, R. E. (2004). A Maximum Entropy Approach to Spe-cies Distribution Modeling. In Proceedings of the 21st International Conference on Machine Learning (pp. 655-662). New York, USA: Association for Computing Machi-nery.
Ragab, R., & Prudhomme, C. (2002). Climate Change and Water Resources Management in Arid and Semi-Arid Regions: Prospective and Challenges for the 21st Century. Bio-systems Engineering, 81, 3-34. https://doi.org/10.1006/bioe.2001.0013
Shang, S., Lian, L., Ma, T., Zhang, W., & Han, T. (2018). Temporal and Spatial Variation Characteristics of Temperature and Precipitation in Northwest China in Recent 54 Years. Arid Zone Research, 35, 68-76.
Sun, W., & Liu, Y. (2010). Research Progress in Risk Analysis of Biological Invasion.
Chinese Agricultural Science Bulletin, 26, 233-236.
Wang, Y., Xie, B., Wan, F. et al. (2007). Application of ROC Curve Analysis in Evaluation of Invasive Species Distribution Model. Biodiversity, 15, 365-372.
Zhang, Q., Han, L., Jia, J. et al. (2016). Management of Drought Risk under Global Warming. Theoretical & Applied Climatology, 125, 187-196.
Zhou, G., & Wang, Y. (2003). Global Ecology. Beijing: Meteorological Press.