International Journal of Geosciences, 2019, 10, 254-294 http://www.scirp.org/journal/ijg
ISSN Online: 2156-8367 ISSN Print: 2156-8359
DOI: 10.4236/ijg.2019.103016 Mar. 21, 2019 254 International Journal of Geosciences
Air Pollution Analysis in Kuwait Using a
Statistical Technique (CUSUM)
A. Al-Rashed
1, N. Al-Mutairi
2, M. Al Attar
21Science Department, Public Authority of Applied Education and Training, Safat, Kuwait 2Department of Civil Engineering, Kuwait University, Safat, Kuwait
Abstract
Investigating the changes in the air pollutants trends of an area is important as it helps in making further action plans for further implementation of con-trol strategies. Time series analysis provides indication to analyze any effect of uncontrolled changes in pollutants. In this study, exponentially weighted moving average (EWMA) and cumulative sum (CUSUM) analyzing methods are applied for detecting the trends and change in air pollutant concentra-tions in Kuwait. CUSUM method is effective in detecting shifts from average mean obtained by EWMA technique. The study aimed to investigate trends in major pollutants in three selective areas in Kuwait during the past five years. The data obtained from three monitoring stations in the study areas Ali Subah Al-Salem, Al-Mutla, and Al-Mansouriya for carbon monoxide (CO), nitrogen dioxide (NO2), sulfur dioxide (SO2), particulate matter—less than 10 micrometers (PM10), hydrogen sulphide (H2S), and non-methane hydrocar-bon (NMHC). Increase in CO and NMHC concentrations in the three areas and decrease in PM10, SO2, and NO2 concentration levels in non-industrial areas Al-Mutla and Al-Mansouriya are observed using CUSUM method.
Keywords
Air Pollution, CUSM, Kuwait, EWMA
1. Literature Review
1.1. General
The effect of air pollution on the quality of environment is considered as major and continues public concern since it affects human life and public health. Air pollution is considered as a risk that threatens people’s lives. Historically, exam-ples of air pollution episodes happened in Belgium where 63 died in 1930, in
How to cite this paper: Al-Rashed, A., Al-Mutairi, N. and Al Attar, M. (2019) Air Pollution Analysis in Kuwait Using a Sta-tistical Technique (CUSUM). International Journal of Geosciences, 10, 254-294. https://doi.org/10.4236/ijg.2019.103016
Received: December 10, 2018 Accepted: March 18, 2019 Published: March 21, 2019
Copyright © 2019 by author(s) and Scientific Research Publishing Inc. This work is licensed under the Creative Commons Attribution International License (CC BY 4.0).
A. Al-Rashed et al.
DOI:10.4236/ijg.2019.103016 255 International Journal of Geosciences
Donora, Pennsylvania where 20 were killed in 1948, and in New York City
where 200 people were killed in 1953, in the Manse Valley, [1]. In the last
dec-ade, the huge and significant development in the urban life especially in trans-portation system and the motorized road vehicle fleet encourage the mobility for the increasing population. As a result of the vehicle growth and the need for mo-bility, the fuel consumption has also increased. Motor vehicles are a critical source
of urban air pollution (PM10, CO, CO2, NOx, O3, SO2 and VOC’s) [2] [3] [4].
The burning of fossil fuels and the decline of the world’s forest areas have both directly affected a steady rise in CO2 concentrations in the last half century. On the other hand, still there is no clear and uncertain impact on the long-term
[5]. Britain’s Meteorological Office and the USA’s NASA Goddard Center for
Space Research both confirm recent rises in global temperatures, but it is unclear whether these are due to levels of greenhouse gases or natural variations in
glob-al climate [6].
Kuwait’s development policy plan aims at diversifying sources of income by encouraging the expansion of the economy and reducing the country depen-dency on oil exports. As a result of that plan, the industrial sector receives spe-cial support and encouragement from the government. As an example, the Shuaiba Industrial Area is a governmental authority located 50 km south of Ku-wait city between Ahmadi south pier and Mina Abdulla along the costline, with an independent budget and attached to the Minister of Commerce and Industry. Shuaiba Industrial plants locate near the expanding residential projects such as Ali Subah Al-Salem area, Subah Al-Ahmad area, Jaber Al-Ahmed etc. Emissions from the various industries have increased continuously in Shuaiba over the last
three decades [5]. The resulting impact on both the performance of the
indus-tries and the environment around Shuaiba is a cause for increasing concern to the State Authorities of Kuwait, the Shuaiba Area Authority and even local in-dustry. This has led to a recognition of the need for the scientific community to develop a sound approach for assessing the wide range of health and
environ-mental effects that result from exposure to toxic chemicals [7].
[8] proved the effectiveness of both techniques Cumulative Sum Control
A. Al-Rashed et al.
DOI: 10.4236/ijg.2019.103016 256 International Journal of Geosciences
Subah Al-Salem, industrial plants are located nearby the area, while Al-Mansouriya area are surrounded by heavy traffic because of main rings and roads in Kuwait City. However, Al-Mutla is plain area with no major external exposure. The con-tinuous monitoring is carried out by Kuwait Environment Public Authority, Kuwait. The 24 hourly data observed during 2013-2017 (study time) for CO, NO2, SO2, PM10, H2S, and NMHC is considered to analyse for any changes in the behavior of these pollutants. Environmental studies are essential before any plans especially the residential ones. This research investigates the trends of pol-lutants in three areas in Kuwait using CUSUM technique, which can be easily applied in several Environmental projects for several purposes especially in the design of new residential areas like Al-Mutla or other future development plans in Kuwait. In addition, the study investigates the uncontrol pollutants levels in order to apply some control program to decrease the bad effect of rising pollu-tants in some study areas.
1.2. Background of Kuwait
Kuwait is located on the north-western coast of Arabian Gulf. It borders Iraq,
Saudi Arabia and Arabian Gulf (Figure 1). The total area of Kuwait is about
17,818 km2. The Total area is mainly arid land while urban development is on
the coastline of the gulf. The climate is mostly dry consisting of intensely hot summer and short, cool winter. The mean elevation is 108 m where the lowest point is the Arabian Gulf which is 0 m and the highest point is 3.6 km West of Al-Salmi Border Post 300 m. Kuwait is modern well developed and planned emerging economic country having 6608 km of total road network according to
the statistical data for year 2010 (Figure 1).
A. Al-Rashed et al.
DOI:10.4236/ijg.2019.103016 257 International Journal of Geosciences
Despite the dependency of the Kuwait economy in crude oil only as the main energy source and the major generating commodity, Kuwait has a geographically small, but wealthy, relatively open economy with crude oil reserves of about 102 billion barrels more than 6% of world reserves. Kuwaiti officials plan to increase production to 4 million barrels of oil equivalent per day by 2020. Petroleum ac-counts for over half of Gross Domestic Product (GDP), 92% of export revenues, and 90% of government income. In 2015, Kuwait, for the first time in 15 years, realized a budget deficit after decades of high oil prices; in 2016, the deficit grew to 16.5% of GDP. The GDP per capita (PPP) in Kuwait was around $71,900 in year 2016 which is considered high to many countries.
Kuwait has a well-developed road system, although there are no trains, and public transport is limited to buses and taxis. Plans are on to build a railway sys-tem in future, but, buses, cars or taxis are the only means of common public transport available in Kuwait at present. Using any kind of transportation whether private car or public is necessary because of the extreme weather condi-tions especially in summer. Summer season extends over seven months, from April to October and the temperatures reaches 50 C and above especially in July and August. The hot and dry nature of Kuwait weather increases the demand toward transportation in general.
2. Methodology
The CUSUM technique was developed initially for statistical quality control [9]
[10] [11] applied CUSUM to change point detection of gaseous and particulate
pollution at road side location at Marylebone. Also, Barratt et al. (2007) applied
the approach to vehicle count and CO concentration data at Marylebone for the purpose of detection change in air pollutant concentrations. Due to the easy computations of the CUSUM technique, the applications of the approach is now become in large scale. CUSUM works better in detecting the small shifts in the process than other techniques such as Shewhart chart and exponential weighted moving average chart, however both techniques CUSUM and EWMA are used
in this study [12]. CUSUM methods apply to observations recorded over time
(daily, weekly, monthly). The observations may be physical measurements, counts or rates and may be grouped (in production batches for example) or in-dividual observations (e.g., as here, daily average concentrations of a pollutant at a monitoring station).
In order to apply the CUSUM approach to air pollutants in Kuwait areas, the procedure is described briefly. First, we will consider each concentration meas-ured in a day as a point in the EMWA and CUSUM charts. This mean each arising point will refer to the day when this rising happened.
Let xi, i = 1 - n; (n being the number of data points) is an independent time
series to be studied for the presence of any changes. The cumulative sum Si can be calculated as;
A. Al-Rashed et al.
DOI: 10.4236/ijg.2019.103016 258 International Journal of Geosciences
where S0 = 0, zi is the standard normal variate.
Thus, if there is a shift in the process mean away from the target then zi will
tend to be larger or smaller than the target average and the CUSUM will steadily increase or decrease. Depending upon the magnitude of the shift in the mean the CUSUM may not detect the change immediately, requiring a number of obser-vations at the new level before it begins to pick up the change in mean.
Zi =
where xi is the observed value at time i, X is the desired process mean and s is an
estimate of the standard deviation of the observed values. These are accumulated
over time to compute the CUSUM, S, at each time point (i).
Moreover, the change in terms of increased or decreased process mean can be detected, respectively by computing the quantities as (10);
SHi = MAX [0, (zi − k) + SHi-1] (2) SHi = MIN [0, (zi − k) + SLi-1] (3)
where parameter k is the reference value to be chosen appropriately. For the
normally distributed variables with mean 0 and unit standard deviation,
slack-ness factor k can be chosen as 0.5 to indicate the shift of 1σ in process mean. The
confidence limits specified for the CUSUM control charts are ±hσx, where h = 4
or 5 and σx is the standard deviation, slackness factor k can be chosen as 0.5 to
indicate the shift of 1r in process mean. The confidence limits specified for the
CUSUM control charts are ±hσx, where h = 4 or 5 and σx is the standard
devia-tion [13].
3. Results
The study will be based on data from three areas in Kuwait from different envi-ronment conditions and different Governorates. There will be brief description of each of area in the case study.
Capital Governorate (Al-Mansouriya)
Mansouriya is an area in the Capital Governorate and a suburb of Kuwait City
as shown in (Figure 2), its Population reaches 8352 in 2008 [2]. The total area is
1,255,302.329 m2. The area selected faces severe air pollution problem mainly
from transportation and daily traffic emissions from huge number of vehicles passing by its surrounding roads. The study will evaluate the pollutants levels in this area from Environment Public Authority last 5 years for urban air pollution (PM10, CO, H2S, NO2, SO2, NMHC).
Al-Jahra Government (Al-Mutla)
Al-Mutla is a series of plateaus located north-east of Kuwait, Al-Mutla area is 40 km away from the Kuwait capital.
About Future AL Mutla Housing Project:
A. Al-Rashed et al.
DOI:10.4236/ijg.2019.103016 259 International Journal of Geosciences
Figure 2. Location map of sampling area.
ALMutlaa City is proposed to be located to the north-west of Mtropolitan Area. PAHW commissioned a consortium led by Parsons Brinkkerhoff along with Malone Given Parsons (MGP), Deloitte and Kuwait Technical Consulting Bureau (KTCB) to develop AL Mutlaa Housing Project through the detailed planning and desigh stage. The expected date of completion September 2020.
Project Area: 9000 hectares Components of the project:
It consists of 12 residential suburb (220,000 Kuwaiti residents in 30,500 units): 9769 housing units N1, N2, N3, N4.
18,519 housing units N5, N6, N7, N8, N9, N10, N11, N12 Total = 28,288 housing units
The unit area of 400 m2
Al-Ahmadi Government (Ali Subah Al-Salem)
Ali Subah Al-Salem area is located the South Kuwait (Figure 2). The area is
considered from the newest urban areas in the last years in that region. The area consists of 9 blocks with total population of 47,302.
A. Al-Rashed et al.
DOI: 10.4236/ijg.2019.103016 260 International Journal of Geosciences
thousands of citizens, especially that the site is close to the industrial zones of the private and government sectors. Citizens complain of environmental diseases and problems they are constantly exposed to.
The environmental and health problem in Ali Subah Al-Salem is not a unique problem in Kuwait. Similarly, Qurain area faces problem with the waste disposal location, which was established next to the area. Although the problem was han-dled in a temporary and better way comparing to the Ali Subah Al-Salem.
Globally, in the United States, there was the problem of the residential area known as Love Canal, which was built next to a site for the disposal of industrial waste where diseases and cancer increased unexpectedly, causing population discontent and social and political problems with the local authorities. After a long period of the seriousness of the problem, authorities considered the area condition as a disaster and compensated the population for the environmental and health damage. However, still many countries in the world, including coun-tries in Europe and the United States, have industrial zones close to residential areas.
4. Results and Discussion
The CUSUM and EWMA techniques are applied to air quality data at three areas in Kuwait Ali Subah Al-Salem, Al-Mutla, and Al-Mansouriya. The site is cha-racterized as monitoring stations in each area with daily concentration mea-surements. In Ali Subah Al-Salem, industrial plants are located nearby the area, while Al-Mansouriya area are surrounded by heavy traffic because of main rings and roads in Kuwait City. However, Al-Mutla is plain area with no major exter-nal exposure. The continuous monitoring is carried out by Kuwait Environment Public Authority, Kuwait. The 24 hourly data observed during 2013-2017 (study time) for CO, NO2, SO2, PM10, H2S, and NMHC is considered to analyze for any changes in the behaviour of these pollutants.
Data analysis and Discussion for output: Ali-Subah Al-Salem
The data were collected from Ali Subah Al-Salem monitoring station from pe-riod 2013 to 2017, study time. In addition, the data that taken from Rya) are measured daily. Following graphs are analysed yearly and period from 2013-2017 for each pollutant CO, NO2, SO2, PM10, H2S, and NMHC respective-ly.
From Figure 3 and Figure 4, it can be observed that EWMA showed alarms
A. Al-Rashed et al.
DOI:10.4236/ijg.2019.103016 261 International Journal of Geosciences
Figure 3. EWMA chart of CO in Ali Subah Al-Salem 2013.
Figure 4. CUSUM chart of CO in Ali Subah Al-Salem 2013.
From Figure 5 and Figure 6, it can be concluded that EMWA displayed
alarms at the time period from day 3 Sep. to the end of the year, means it almost keep increasing for 119 day. CUSUM displays no increasing distribution above the average of this year except the last two days in 2014 faced some increase in CO concentration.
From Figure 7 and Figure 8, it can be observed that the period from 18 Jan.
A. Al-Rashed et al.
DOI: 10.4236/ijg.2019.103016 262 International Journal of Geosciences
Figure 5. EWMA chart of CO in Ali Subah Al-Salem 2014.
Figure 6. CUSUM chart of CO in Ali Subah Al-Salem 2014.
A. Al-Rashed et al.
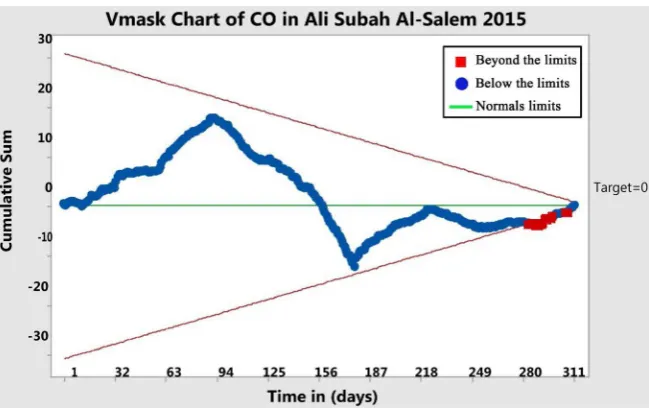
[image:10.595.212.537.68.274.2]DOI:10.4236/ijg.2019.103016 263 International Journal of Geosciences
Figure 8. CUSUM chart of CO in Ali Subah Al-Salem 2015.
From Figure 9 and Figure 10, EMWA showed 3 alarming periods 15 Apr. to
14 May, 18 May to 14 Jun., and 24 Jun. to 10 Jul.. CUSUM showed the increasing distribution of CO concentration above the average level from point 9 Jun. to 12 Sep. then it go in normal distribution within the Vmask.
From Figure 11 and Figure 12, it can be observed that EMWA viewed the
alarming periods 6 Jan. to 26 Jan., 8 Feb. to 14 Feb., 21 Feb. to 13 Apr., and 21 Apr. to 17 May. The CUSUM draw the out-of-control distribution from point 8 Feb. to 15 Aug.
From Figure 13 and Figure 14, EMWA showed many intervals that exceed
the standard level of CO during the 5 years. These intervals are the points 11 Jan 2013 to 27 Mar. 2013 (duration = 75 days), 22 Aug. 2014 to 26 Aug. 2014 (dura-tion = 4 days), 13 Oct. 2014 to 22 Jan. 2015 (dura(dura-tion = 101 days), 2 Feb. 2015 to 6 Mar. 2015 (duration= 32 days), 22 May 2015 to 20 Jul. 2015 (duration=59 days), 22 July 2015 to 26 Dec. 2015 (duration = 157 days), 15 Jan. 2016 to 22 Apr. 2016 (duration = 98 days), and 4 May 2016 to 30 Jun. 2016 (duration = 57 days). CUSUM showed only one period of out-of-control distribution from points 25 Mar. 2016 to 26 Feb. 2017 (duration = 390 days).
From Figure 15 and Figure 16, it can be observed that EWMA showed alarms
at the points from 1 Jan. 2013 to 10 Jan. 2013, 25 Jun. 2013, 12 Jul. 2013 to 23 Jul. 2013, 6 Aug. 2013 to 1 Sep. 2013, 7 Sep. 2013 to 26 Sep. 2013, 30 Sep. 2013 to 8 Oct. 2013, 16 Oct. 2013 to 24 Oct. 2013, 29 Dec. 2013. CUSUM showed only the upper limit period from points 21 Oct. 2013 to 10 Nov. 2013 while the other act within average distribution.
From Figure 17 and Figure 18, it obvious that EMWA displayed alarms at the
A. Al-Rashed et al.
DOI: 10.4236/ijg.2019.103016 264 International Journal of Geosciences
Figure 9. EWMA chart of CO in Ali Subah Al-Salem 2016.
Figure 10. CUSUM chart of CO in Ali Subah Al-Salem 2016.
A. Al-Rashed et al.
DOI:10.4236/ijg.2019.103016 265 International Journal of Geosciences
Figure 12. CUSUM chart of CO in Ali Subah Al-Salem 2017.
Figure 13. EWMA chart of CO in Ali Subah Al-Salem 2013-2017.
A. Al-Rashed et al.
DOI: 10.4236/ijg.2019.103016 266 International Journal of Geosciences
Figure 15. EWMA chart of NO2 in Ali Subah Al-Salem 2013.
Figure 16. CUSUM chart of NO2 in Ali Subah Al-Salem 2013.
A. Al-Rashed et al.
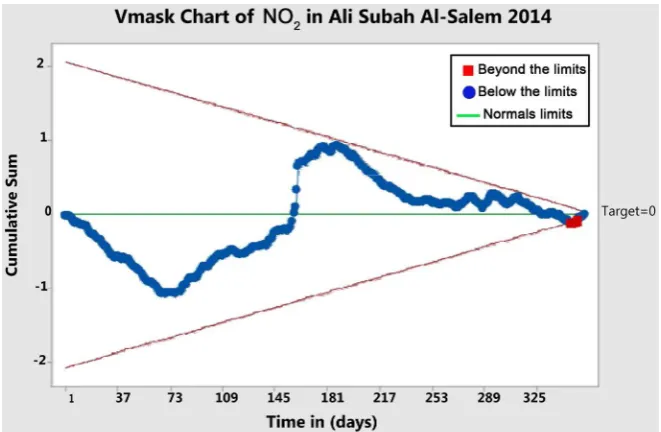
[image:14.595.208.539.69.285.2]DOI:10.4236/ijg.2019.103016 267 International Journal of Geosciences
Figure 18. CUSUM chart of NO2 in Ali Subah Al-Salem 2014.
Jun 2014. However, CUSUM chart showed within average distribution for the gas concentration during this year.
From Figure 19 and Figure 20, it can be concluded that two periods 11 Oct.
2015 to 14 Nov. 2015 and 4 Dec. 2015 to 31 Dec. 2015 showed increasing con-centration upon the normal average, while the CUSUM showed normal distri-bution within the year average.
From Figure 21 and Figure 22, EMWA showed 4 alarming periods 5 Jan.
2016 to 21 Feb. 2016, 18 Apr. 2016 to 24 Apr. 2016, 11 May 2016 to 19 May 2016, 9 Jun. 2016, 29 Jun. 2016 to 30 Jun. 2016, 28 Jul. 2016, and 31 Oct. 2016. CUSUM showed the increasing distribution of CO concentration above the av-erage level from point 21 Jul. 2016 to 29 Dec. 2016.
From Figure 23 and Figure 24, it can be concluded that EMWA viewed the
alarming days 3 Apr. 2017, 13 Apr. 2017 to 19 Apr. 2017, 29 Sep. 2017 to 12 Nov. 2017 (study time). The CUSUM draw had no out-of-control region.
From Figure 25 and Figure 26, EMWA showed many intervals that exceed
the standard level of NO2 during the 5 years. These intervals are the points 1 Jan. 2013 to 11 Jan. 2013, 25 Jun. 2013 to 24 Oct. 2013, 28 Dec. 2013 to 30 Dec. 2013, 3 Apr. 2014 to 7 Jul. 2014, 15 Oct 2014 to 15 Nov. 2014, 27 Dec. 2014 to 2 Jan. 2015, 12 Oct. 2015 to 20 Feb. 2016, 17 Apr. 2016 to 31 Oct. 2016, and 30 Sep. 2017 to 8 Nov. 2017. CUSUM showed only one period of out-of-control distri-bution from points 14 Jul. 2016 to 21 Feb. 2017.
From Figure 27 and Figure 28, it can be observed that EWMA showed alarms
at the points from 15 Jan. 2013 to 18 Jan. 2013, 1 Apr. 2013 to 13 Apr. 2013, 9 Jul. 2013 to 10 Jul. 2013, 8 Aug. 2013 to 16 Aug. 2013, 16 Sep. 2013 to 22 Sep. 2013, 30 Sep. 2013 to 14 Oct. 2013, and 13 Dec. 2013 to 28 Dec. 2013. CUSUM displayed no upper limit period and all points were within average distribution.
A. Al-Rashed et al.
DOI: 10.4236/ijg.2019.103016 268 International Journal of Geosciences
Figure 19. EWMA chart of NO2 in Ali Subah Al-Salem 2015.
Figure 20. CUSUM chart of NO2 in Ali Subah Al-Salem 2015.
A. Al-Rashed et al.
DOI:10.4236/ijg.2019.103016 269 International Journal of Geosciences
Figure 22. CUSUM chart of NO2 in Ali Subah Al-Salem 2016.
Figure 23. EWMA chart of NO2 in Ali Subah Al-Salem 2017.
A. Al-Rashed et al.
DOI: 10.4236/ijg.2019.103016 270 International Journal of Geosciences
Figure 25. EWMA chart of NO2 in Ali Subah Al-Salem 2013-2017.
Figure 26. CUSUM chart of NO2 in Ali Subah Al-Salem 2013-2017.
A. Al-Rashed et al.
DOI:10.4236/ijg.2019.103016 271 International Journal of Geosciences
Figure 28. CUSUM chart of SO2 in Ali Subah Al-Salem 2013.
Figure 29. EWMA chart of SO2 in Ali Subah Al-Salem 2014.
A. Al-Rashed et al.
DOI: 10.4236/ijg.2019.103016 272 International Journal of Geosciences
from 12 Jan. 2014 to 2 Feb. 2014, 12 Apr. 2014, 10 Jun. 2014 to 18 Jun. 2014, 27 Jun 2014 to 4 Jul. 2014, 19 Jul. 2014 to 24 Jul. 2014, 9 Nov. 2014 to 14 Nov. 2014, and 2 Dec. 2014 to 15 Dec. 2014. EMWA gives clear view that the last two pe-riods recognized a very high jump in gas concentration level especially in days 12 Nov. 2014 and 8 Dec. 2014. However, CUSUM chart showed within average distribution for the gas concentration during this year except the period from points 14 Dec. 2014 to 19 Dec. 2014.
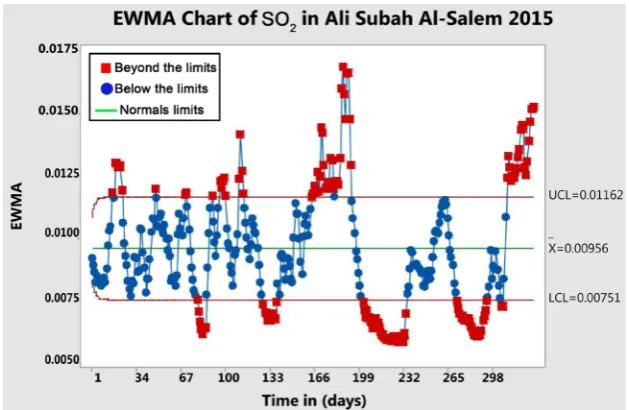
[image:19.595.216.531.263.468.2]From Figure 31 and Figure 32, EMWA viewed the alarming points 16 Jan. 2015 to 23 Jan. 2016, 17 Feb. 2015, 11 Mar. 2015 to 12 Mar. 2015, 31 Mar. 2015, 6 Apr. 2015 to 10 Apr. 2015, 20 Apr. 2015 to 23 Apr. 2015, 15 Jun. 2015 to 15 Jul. 2015, and 11 Dec. 2015 to 31 Dec. 2015. However, the CUSUM showed normal distribution within the year average.
Figure 31. EWMA chart of SO2 in Ali Subah Al-Salem 2015.
[image:19.595.217.531.500.706.2]A. Al-Rashed et al.
DOI:10.4236/ijg.2019.103016 273 International Journal of Geosciences
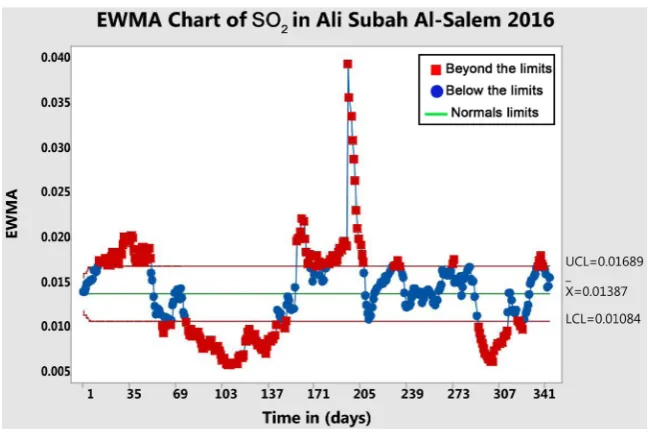
From Figure 33 and Figure 34, it can be observed that EMWA showed alarming periods 13 Jan. 2016 to 19 Feb. 2016, 6 Jun. 2016 to 23 Jun. 2016, 29 Jun. 2016 to 25 Jul. 2016, 17 Aug. 2016 to 23 Aug. 2016, 6 Oct. 2016 to 7 Oct. 2016, and 21 Dec. 2016 to 26 Dec. 2016.EWMA showed a maximum out of con-trol value in day 14 Jul. 2016. CUSUM showed the increasing distribution of SO2 concentration above the average level from point 9 Oct. 2016 to 2 Nov. 2016.
[image:20.595.211.537.246.462.2]From Figure 35 and Figure 36, EMWA viewed the alarming points 1 Jan. 2017 to 2 Jan. 2017, 10 Jan. 2017 to 7 Feb. 2017, 9 Mar. 2017 to 10 Mar. 2017, 23 Apr. 2017 to 5 May 2017, 29 May 2017 to 30 Jun. 2017, and 26 Oct. 2017 to 12 Nov. 2017. The CUSUM draw one out-of-control region which is period from 28 May 2017 to 29 Aug. 2017.
Figure 33. EWMA chart of SO2 in Ali Subah Al-Salem 2016.
[image:20.595.210.537.491.710.2]A. Al-Rashed et al.
[image:21.595.209.539.67.290.2]DOI: 10.4236/ijg.2019.103016 274 International Journal of Geosciences
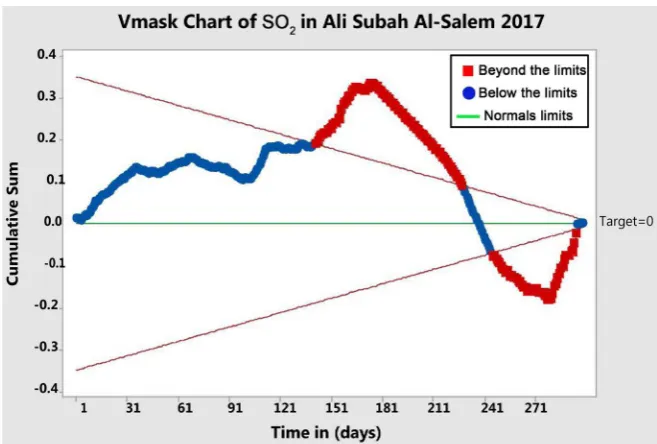
Figure 35. EWMA chart of SO2 in Ali Subah Al-Salem 2017.
Figure 36. CUSUM chart of SO2 in Ali Subah Al-Salem 2017.
From Figure 37 and Figure 38, it can be observed that EMWA showed many intervals that exceed the standard level of SO2 during the 5 years. The highest concentration point is shown in point 14 Jul. 2016. CUSUM showed only one period of out-of-control distribution from points 6 Feb. 2017 to 9 Sep. 2017.
[image:21.595.208.537.320.542.2]A. Al-Rashed et al.
DOI:10.4236/ijg.2019.103016 275 International Journal of Geosciences
Figure 37. EWMA chart of SO2 in Ali Subah Al-Salem 2013-2017.
Figure 38. CUSUM chart of SO2 in Ali Subah Al-Salem 2013-2017.
A. Al-Rashed et al.
DOI: 10.4236/ijg.2019.103016 276 International Journal of Geosciences
Figure 40. CUSUM chart of PM10 in Ali Subah Al-Salem 2013.
From Figure 41 and Figure 42, it can be observed that EMWA displayed alarms at the time period from 30 Mar. 2014 to 3 Apr. 2014, 30 Apr. 2014 to 13 May 2014, 12 Jun. 2014 to 26 Jun. 2014, 14 Jul. 2014 to 20 Jul. 2014, 28 Jul. 2014 to 29 Jul. 2014, 18 Aug. 2014 to 27 Aug. 2014, 29 Aug. 2014 to 6 Sep. 2014, 13 Oct. 2014 to 14 Oct. 2014, and 20 Oct. 2014 to 23 Oct. 2014. EMWA gives clear view that the period from 30 Apr. 2014 until 13 May 2014 had recognized a very high jump in gas concentration level specially in day 1 May 2014. However, CUSUM chart showed the only out of control period 13 Oct. 2014 to 23 Dec. 2014 while all other points were within average distribution for the gas concen-tration during this year.
From Figure 43 and Figure 44, it can be observed that periods 12 Feb. 2015 to 15 Feb. 2015, 17 Apr. 2015 to 27 Apr. 2015, 9 May 2015 to 10 May 2015, 23 May 2015 to 24 May 2015, 31 May 2015, 8 Jul. 2015 to 25 Jul. 2015, 1 Oct. 2015 to 12 Oct 2015, 22 Oct. 2015 to 25 Oct. 2015, and 2 Dec. 2015 showed increasing con-centration upon the normal average, while the CUSUM showed one abnormal period points 18 Oct. 2015 to 24 Dec. 2015 that exceed the average distribution within the year.
From Figure 45 and Figure 46, it can be observed that EMWA showed 4 alarming periods 5 May 2016 to 16 May 2016, 15 Jun. 2016 to 6 Jul. 2016, 10 Jul. 2016 to 29 Jul. 2016, and 1 Oct. 2016 to 4 Oct. 2016. CUSUM showed the in-creasing distribution of CO concentration above the average level from point 30 Sep. 2016 to 17 Oct. 2016.
A. Al-Rashed et al.
DOI:10.4236/ijg.2019.103016 277 International Journal of Geosciences
Figure 41. EWMA chart of PM10 in Ali Subah Al-Salem 2014.
Figure 42. CUSUM chart of PM10 in Ali Subah Al-Salem 2014.
A. Al-Rashed et al.
DOI: 10.4236/ijg.2019.103016 278 International Journal of Geosciences
Figure 44. CUSUM chart of PM10 in Ali Subah Al-Salem 2015.
Figure 45. EWMA chart of PM10 in Ali Subah Al-Salem 2016.
A. Al-Rashed et al.
DOI:10.4236/ijg.2019.103016 279 International Journal of Geosciences
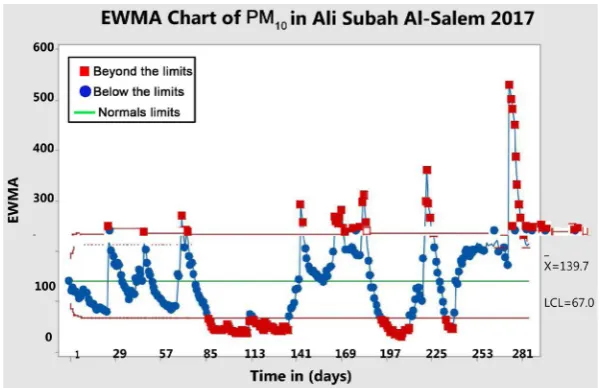
[image:26.595.223.524.69.264.2]Figure 47. EWMA chart of PM10 in Ali Subah Al-Salem 2017.
Figure 48. CUSUM chart of PM10 in Ali Subah Al-Salem 2017.
From Figure 49 and Figure 50, it can be observed that EMWA showed many intervals that exceed the standard level of CO during the 5 years. The highest concentration points occur in days 9 Jun. 2013 and 11 Jul. 2015. CUSUM showed only one period of out-of-control distribution from period 9 Jul. 2016 to 1 May 2017.
From Figure 51 and Figure 52, it can be observed that EWMA showed alarms at the points from 7 Aug. 2013 to 26 Nov. 2013 and 30 Nov. 2013 to 30 Dec. 2013. CUSUM showed no upper limit period and all the points act within aver-age distribution.
A. Al-Rashed et al.
[image:27.595.228.524.66.258.2]DOI: 10.4236/ijg.2019.103016 280 International Journal of Geosciences
[image:27.595.224.521.288.483.2]Figure 49. CUSUM chart of PM10 in Ali Subah Al-Salem 2013-2017.
Figure 50. CUSUM chart of PM10 in Ali Subah Al-Salem 2013-2017.
[image:27.595.225.521.514.708.2]A. Al-Rashed et al.
[image:28.595.226.523.70.262.2]DOI:10.4236/ijg.2019.103016 281 International Journal of Geosciences
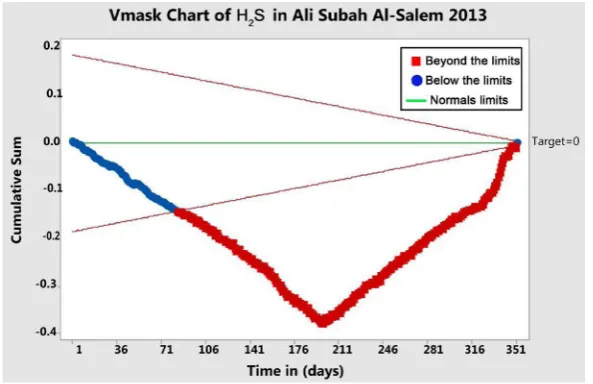
[image:28.595.226.521.291.484.2]Figure 52. CUSUM chart of H2S in Ali Subah Al-Salem 2013.
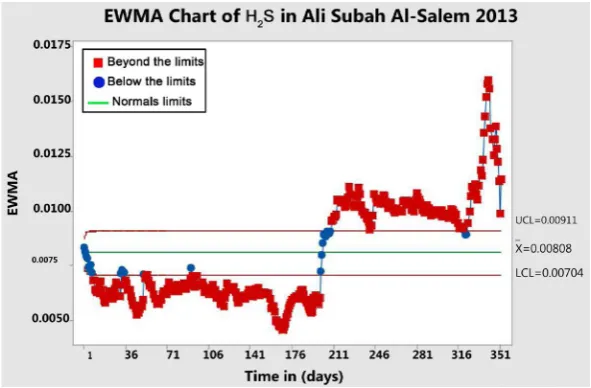
Figure 53. EWMA chart of H2S in Ali Subah Al-Salem 2014.
[image:28.595.225.521.515.706.2]A. Al-Rashed et al.
DOI: 10.4236/ijg.2019.103016 282 International Journal of Geosciences
Dec. 2014 had recognized a very high jump in gas concentration level specially in point 26 Nov. 2014. However, CUSUM chart showed within average distribu-tion for the gas concentradistribu-tion during this year.
From Figure 55 and Figure 56, it can be observed that periods 19 Jan. 2015 to 22 Jan. 2015, 1 Apr. 2015, 14 Jul. 2015 to 23 Jul. 2015, 5 Sep. 2015 to 23 Sep. 2015, and 16 Dec. 2015 to 31 Dec. 2015 showed increasing concentration upon the normal average, while the CUSUM showed normal distribution within the year average.
[image:29.595.224.522.279.474.2]From Figure 57 and Figure 58, it can be observed that EMWA showed alarming periods 7 Jan. 2016 to 16 Jan. 2016, 21 Jan 2016 to 27 Jan 2016, 14 Jul. 2016 to 28 Jul. 2016, 6 Aug. 2016 to 25 Aug. 2016, 18 Sep. 2016 to 7 Oct. 2016, 11 Oct. 2016 to 20 Oct. 2016, and 20 Dec. 2016 to 30 Dec. 2016. CUSUM showed no increasing distribution of CO concentration above the average level.
Figure 55. EWMA chart of H2S in Ali Subah Al-Salem 2015.
[image:29.595.224.524.506.707.2]A. Al-Rashed et al.
[image:30.595.217.533.68.275.2]DOI:10.4236/ijg.2019.103016 283 International Journal of Geosciences
Figure 57. EWMA chart of H2S in Ali Subah Al-Salem 2016.
Figure 58. CUSUM chart of H2S in Ali Subah Al-Salem 2016.
From Figure 59 and Figure 60, it can be conluded that EMWA viewed one alarming period from 20 Apr. 2017 to from 18 May 2017. The CUSUM draw out-of-control region from 28 Apr. 2017 to 28 Jul. 2017.
[image:30.595.215.530.309.514.2]A. Al-Rashed et al.
DOI: 10.4236/ijg.2019.103016 284 International Journal of Geosciences
Figure 59. EWMA chart of H2S in Ali Subah Al-Salem 2017.
Figure 60. CUSUM chart of H2S in Ali Subah Al-Salem 2017.
A. Al-Rashed et al.
[image:32.595.227.525.67.269.2]DOI:10.4236/ijg.2019.103016 285 International Journal of Geosciences
Figure 62. CUSUM chart of H2S in Ali Subah Al-Salem 2013-2017.
From Figure 63 and Figure 64, it can be observed that EWMA showed alarms at the days 2 Jan. 2013, 7 Jan. 2013 to 8 Jan. 2013, 11 Aug. 2013 to 24 Sep. 2013, 2 Oct. 2013 to 8 Oct. 2013, 28 Oct. 2013 to 17 Nov. 2013, 9 Dec. 2013, and 27 Dec. 2013 to 31 Dec. 2013. CUSUM showed no upper limit period and the point lo-cate within average distribution.
From Figure 65 and Figure 66, it can be concluded that EMWA displayed alarms at the time period from 3 Jan. 2014 to 4 Jan. 2014, 9 Jan. 2014 to 11 Jan. 2014, 15 Jan. 2014 to 16 Jan. 2014, 17 Aug. 2014 to 12 Sep. 2014, 26 Sep. 2014 to 8 Oct. 2014, 10 Oct. 2014 to 17 Oct. 2014, 24 Oct. 2014 to 3 Nov. 2014, 12 Nov. 2014 to 14 Nov. 2014, 7 Dec. 2014 to 13 Dec. 2014, and 27 Dec. 2014. However, CUSUM chart showed no exceed concentration values and all points were with-in average distribution for the gas concentration durwith-ing this year.
From Figure 67 and Figure 68, it can be observed that periods 31 Mar. 2015 to 2 Apr. 2015, 4 Apr. 2015 to 10 May 2015, 12 May 2015 to 13 May 2015, 17 May 2015 to 1 Jun. 2015, 25 Jul. 2015 to 1 Aug. 2015, 30 Aug. 2015, 5 Nov. 2015, and 6 Dec. 2015 to 7 Dec. 2015 showed increasing concentration upon the nor-mal average, while the CUSUM showed only one out of control region from 30 Oct. 2015 to 30 Dec. 2015. Otherwise, points were within the year average.
From Figure 69 and Figure 70, it can be observed that EMWA showed alarming periods 6 Mar. 2016 to 24 Mar. 2016, 31 Mar. 2016, and 3 Apr. 2016. However, CUSUM showed no abnormal increasing in distribution of CO con-centration above the average level.
From Figure 71 and Figure 72, it can be observed that EMWA viewed the alarming points 14 Apr. 2017 to 28 Apr. 2017. The CUSUM chart had no out-of-control region.
A. Al-Rashed et al.
DOI: 10.4236/ijg.2019.103016 286 International Journal of Geosciences
Figure 63. EWMA chart of NMHC in Ali Subah Al-Salem 2013.
Figure 64. CUSUM chart of NMHC in Ali Subah Al-Salem 2013.
A. Al-Rashed et al.
DOI:10.4236/ijg.2019.103016 287 International Journal of Geosciences
Figure 66. CUSUM chart of NMHC in Ali Subah Al-Salem 2014.
Figure 67. EWMA chart of NMHC in Ali Subah Al-Salem 2015.
A. Al-Rashed et al.
[image:35.595.226.520.292.483.2]DOI: 10.4236/ijg.2019.103016 288 International Journal of Geosciences
Figure 69. EWMA chart of NMHC in Ali Subah Al-Salem 2016.
Figure 70. CUSUM chart of NMHC in Ali Subah Al-Salem 2016.
[image:35.595.227.520.511.707.2]A. Al-Rashed et al.
DOI:10.4236/ijg.2019.103016 289 International Journal of Geosciences
[image:36.595.227.523.68.262.2]Figure 72. CUSUM chart of NMHC in Ali Subah Al-Salem 2017.
Figure 73. EWMA chart of NMHC in Ali Subah Al-Salem 2013-2017.
[image:36.595.226.520.291.483.2]A. Al-Rashed et al.
DOI: 10.4236/ijg.2019.103016 290 International Journal of Geosciences
2013 and 17 Apr. 2015. CUSUM showed only one period of out-of-control dis-tribution from points 24 Sep. 2015 to 26 Jul. 2017.
Trend analysis Results
The Minitab results for each pollutants trends are presented in this chapter. The results will be investigated for each pollutant exceeding the average for each area in the study by calculating the percentage difference either percentage in-crease or percentage dein-crease. In addition, the major change in concentration levels are described in the tables.
The CUSUM results can be summarized in the following Tables 1-6 for each
pollutants.
5. Conclusions
[image:37.595.205.539.360.736.2]The EWMA method provides first alarm for uncontrolled behavior of pollutants level. The results showed a trend average for CO and NMHC in the three study areas which exceed the standard concentration level in Kuwait and WHO (CO = 1.208, NMHC = 0.580). However, remaining pollutants (NO2, SO2, PM10, H2S) displayed within average concentration according to KEPA standard levels.
Table 1. CUSUM for CO, Ali Subah Al-Salem, Al-Mutla and Al-Mansouriaya.
CO Seasons
Location Years (6Dec.-15 Feb.) Winter (16 Feb.-20 May) Spring (21 May-5 Dec.) Summer
Ali Subah Al-Salem 2013 +81.43% +64.01% −88.79%
2014 - - -
2015 +95.84% +27.83% −93.44%
2016 +56% - −78.77%
2017 +96.63% +67.25 −96.9 2013-2017 +97.54% - −99.26
Al-Mutla 2013 +13.63 - -
2014 +46.55 +89.36% −89.75
2015 −94.69 - +98.88
2016 −57.44 +73.25 −37.85
2017 - - -
2013-2017 +89.1 −70.27 −47.12 Al-Mansouriya 2013 −60.61 −35 +94.74
2014 +98.72 −76.46 -
2015 - - -
2016 - - -
A. Al-Rashed et al.
[image:38.595.207.539.89.381.2]DOI:10.4236/ijg.2019.103016 291 International Journal of Geosciences
Table 2. CUSUM for NO2, Ali Subah Al-Salem, Al-Mutla and Al-Mansouriaya.
NO2 Seasons
Location Years (6Dec.-15 Feb.) Winter (16 Feb.-20 May) Spring (21 May-5Dec.) Summer
Ali Subah Al-Salem 2013 +91.52% - +85.3%
2014 - - −95.67
2015 +54.45 - -
2016 +99.86 −35.4 −2%
2017 - - -
2013-2017 −26.46 −95.73 99.5
Al-Mutla 2013 - 31.6 -
2014 95.45 96.86 −96.46
2015 97.5 37.8 −99.2
2016 94.5 61.33 −97.28
2017 - - -
2013-2017 - - -
Al-Mansouriya 2013 49.45 72.19 −85.6
2014 - - -
2015 68.37 52.81 −77.04
2016 - 15.5 −82.61
2013-2016 97.43 68.96 −40.98
Table 3. CUSUM for SO2, Ali Subah Al-Salem, Al-Mutla and Al-Mansouriaya.
SO2 Seasons
Location Years (6Dec.-15 Feb.) Winter (16 Feb.-20 May) Spring (21 May-5 Dec.) Summer
Ali Subah Al Salem 2013 - - -
2014 90.14 −98.43 −76.47 2015 57.21 −71.88 −97.54
2016 99.5 −99.02 −18.9
2017 91.34 30.5 −96.81
2013-2017 59.5 - −88.63
Al-Mutla 2013 - - -
2014 - - -
2015 - - −20
2016 76.41 27.75 −78.89
2017 97.94 55.61 −99.87
2013-2017 89.6 72.57 −36.96 Al-Mansouriya 2013 96.52 −76.6 −94.94
2014 67.15 −5.99 −68.89
2015 - 90.87 −94.86
[image:38.595.209.539.414.728.2]A. Al-Rashed et al.
[image:39.595.207.539.88.392.2]DOI: 10.4236/ijg.2019.103016 292 International Journal of Geosciences
Table 4. CUSUM for PM10, Ali Subah Al-Salem, Al-Mutla and Al-Mansouriaya.
PM10 Seasons
Location Years (6Dec.-15 Feb.) Winter (16 Feb.-20 May) Spring (21 May-5 Dec.) Summer
Ali Subah Al-Salem 2013 −96.03 - −71.36
2014 −85.71 - 62.03
2015 −93.79 - 99.47
2016 - - 68.35
2017 - - -
2013-2017 −31.48 −17.4 87.06
Al-Mutla 2013 - - −48.79
2014 −73.16 - −67.7
2015 - - −87.13
2016 - - -
2017 - - −92.86
2013-2017 −15.17 −31.91 −88.73
Al-Mansouriya 2013 −90.76 - −85.4
2014 −99.07 - -
2015 −30.21 78.82 −55.09
2016 - - -
2017 −84.57 - −71.14
2013-2017 −94.01 - −65.37
Table 5. CUSUM for H2S, Ali Subah Al-Salem, Al-Mutla and Al-Mansouriaya.
H2S Seasons
Location Years (6 Dec.-15 Feb.) Winter (16 Feb.-20 May) Spring (21 May-5 Dec.) Summer
Ali Subah Al-Salem 2013 - - -
2014 93.04 −87.03 -
2015 −93.07 - −74.25
2016 94.5 −92.04 -
2017 - 99.17 −98.03
2013-2017 64.63 58.42 −76.96
Al-Mutla 2013 - - -
2014 - 91.45 −97.997
2015 - - -
2016 85.39 24.05 −87.65
2017 95.47 −13.7 −93.96
2013-2017 68.71 9.39 66.5 Al-Mansouriya 2013 −8.35 71.72 −68.09
2014 −60.2 −19.23 -
2015 - - 75.68
2016 98.3 −62.17 −95.83
[image:39.595.211.537.422.737.2]A. Al-Rashed et al.
[image:40.595.207.539.88.410.2]DOI:10.4236/ijg.2019.103016 293 International Journal of Geosciences
Table 6. CUSUM for NMHC, Ali Subah Al-Salem, Al-Mutla and Al-Mansouriaya.
NMHC Seasons
Location Years (6 Dec.-15 Feb.) Winter (16 Feb.-20 May) Spring (21 May-5 Dec.) Summer
Ali Subah Al-Salem 2013 - - -
2014 70.93 −59.65 -
2015 - - 93.75
2016 - - -
2017 - 82.98 −84.87
2013-2017 −40.3 86.05 −86.67
Al-Mutla 2013 - - -
2014 91.73 −86.09 -
2015 - - -
2016 97.5 62.7 −96.94
2013-2016 - 97.5 −97.5
Al-Mansouriya 2013 - - −21.43
2014 - - -
2015 −41.12 75.86
2016 89.24 54.5 −98.00
2013-2016 32.32 35.71 −16.52
A. Al-Rashed et al.
DOI: 10.4236/ijg.2019.103016 294 International Journal of Geosciences
with the time to compare the trends between pollutants.
Conflicts of Interest
The authors declare no conflicts of interest regarding the publication of this pa-per.
References
[1] Regenstein, L. (1982) America the Poisoned. Acropolis Books Ltd., Washington DC. [2] Al-Bassam, E. and Khan, A. (2004) Air pollution and Road Traffic in Kuwait. WIT
Transactions on the Built Environment, 75, 10.
[3] Al-Rashed, A. (2015) Mineralogical, Micromorphologlcal and Elemental Composi-tion of Particles at Atmospheric Kuwait Dust. Egyptian Journal of Geology, 59, 113-131.
[4] Al-Rukaibi, F., Al-Mutairi, N. and Al-Rashed, A. (2018) Concentration of Air Pol-lutants in an Urban Parking Garage in Kuwait. World Review of Science,
Technol-ogy and Sustainable Development, 14.
[5] Al-Kandari, M.H.M. (1994) Evaluation of the Effect of Air Pollution on Human Health in Kuwait. Doctoral Dissertation, London School of Hygiene & Tropical Medicine, London.
[6] Schoon, N. (1990) Pollution Is Blamed for the Warmest Year on Record. Guardian, II/01/90.
[7] Santos, S. (1987) Risk Assessment. Environmental Science and Technology, 21, 239-240. https://doi.org/10.1021/es00157a602
[8] Wetherington, L. (2010) Evaluation of CUSUM and EWMA Control Charts to Detect Changes in Underlying Demand Trends of Naval Aviation Spares. Thesis, School of Monterey, California.
[9] Page, E.S. (1954) Continuous Inspection Schemes. Biometrika,41, 100-115. https://doi.org/10.1093/biomet/41.1-2.100
[10] Lucas, J.M. (1982) Combined Shewhart—CUSUM Quality Control Schemes.
Jour-nal of Quality Control, 14, 51-59.https://doi.org/10.1080/00224065.1982.11978790
[11] Carslaw, D.C., Ropkins, K. and Bell, M.C. (2006) Change-Point Detection of Ga-seous and Particulate Traffic-Related Pollutants at a Roadside Location.
Environ-mental Science Technology,40, 6912-6918.https://doi.org/10.1021/es060543u
[12] Biswas, R.K., Masud, M.S. and Kabir, E. (2016) Shewhart Control Chart for Indi-vidual Measurement: An Application in a Weaving Mil. Australasian Journal of
Business, Social Science and Information Technology, 2, 89-100.
[13] Barratt, B., Atkinson, R., Anderson, H.R., Beevers, S., Kelly, F., Mudway, I. and Wilkinson, P. (2007) Investigation into the Use of the CUSUM Technique in Iden-tifying Changes in Mean Air Pollution Levels Following Introduction of a Traffic Management Scheme. Atmospheric Environment, 41, 1784-1791.