J. Range Manage.
55:584-597 November 2002
Rangeland health attributes and indicators for qualitative assessment
DAVID A.
PYKE, JEFFREY
E.HERRICK, PATRICK SHAVER,
ANDMIKE PELLANT
Authors are Research Rangeland Ecologist, U.S. Department of the Interior, U.S. Geological Survey, Forest & Rangeland Ecosystem Science Center, Corvallis, Ore., 97331, david_a [email protected]; Research Scientist, U.S. Department of Agriculture, Agricultural Research Service, Jornada Experimental Range, Las Cruces, N.M. 88003, [email protected]; Rangeland Management Specialist, U.S. Department of Agriculture, Natural Resources Conservation Service, Grazing Land Technology Institute, Department of Rangeland Resources, Oregon State University, Corvallis, Ore. 97331, [email protected]; and Rangeland Ecologist, U.S. Department of the Interior, Bureau of Land Management, Idaho State Office, Boise, Ida. 83709,
Abstract
Panels of experts from the Society for Range Management and the National Research Council proposed
that
status of rangeland ecosystems could be ascertained by evaluating an ecological site's potential to conserve soil resources and by a series of indicators for ecosystem processes and site stability. Using these recommen- dations as astarting
point, we developed arapid, qualitative method for
assessing a moment-in-timestatus
ofrangelands.
Evaluators rate
17 indicators to assess 3 ecosystemattributes
(soil and site stability, hydrologic function, and biotic integrity) for a given location. Indicators include rills, water flow patterns, pedestals and terracettes, bare ground, gullies, wind scour and depositional areas, litter movement, soil resistance to erosion, soil surface loss or degradation, plant composition relative to infiltra- tion, soil compaction,
plant functional/structural
groups,plant
mortality, litter amount, annual production, invasive plants, and reproductive capability. In this paper, we detail the development and evolution of the technique and introduce a modified ecologi- cal reference worksheetthat
documents the expected presence and amount of each indicator on the ecological site. In addition, we review the intended applications for this technique and clarify the differences between assessment and monitoringthat
lead us to recommend this technique be used for moment-in-time assess- ments and not be used for temporal monitoring of rangeland sta- tus. Lastly, we propose a mechanism for adapting and modifyingthis technique
toreflect improvements
inunderstanding
of ecosystem processes. We support the need for quantitative mea- sures for monitoring rangeland health and propose some mea- suresthat
we believe may address some of the 17 indicators.Key Words: Soil stability, hydrologic function, biological integri- ty, ecosystem status, erosion, infiltration, inventory
Resumen
Un panel de expertos de la "Society for Range Management" y el "National Research Council" propusieron que el estado de los ecosistemas de los agostaderos podria ser determinado evaluando el potencial que un sitio ecologico tiene
para
conservar recursos del suelo, y por una serie de indicadores de procesos ecologicos yestabilidad
del sitio. Utilizando estas recomendaciones como punto departida,
desarrollamos un rapido metodo cualitativopara
evaluar el estado de agostaderos en un punto especifico en el tiempo. Se evaluaron 17 indicadorespara
asesorar 3 atributos del ecosistema (suelo y estabilidad del sitio, funcion hidrologica, eintegridad
biotica)para
un sitio especifico. Estos indicadores incluyenriachuelos (canalillos), patrones
deescurrimiento,
pedestales yterracetas,
suelo desnudo,quebradas
(carcavas), erosion eolica yareas
de deposicion, movimiento de mantillo, resistencia del suelo a la erosion, degradacion operdida
de la superficie del suelo, composicion vegetal con relacion a la infil- tracion, compactacion del suelo, grupos vegetales funcionales y estructurales, mortalidad vegetal, cantidad de mantillo, produc- cion anual, plantas invasivas, y capacidad de reproduccion. En este informe, detallamos el desarrollo y evolution de esta tecnica.Tambien introducimos una tabla de datos de referencia ecologica modificada que documenta la presencia esperada y la cantidad de cada indicador en el sitio ecologico. En adicion, repasamos las aplicaciones apropiadas
para
esta tecnica y clarificamos las difer- encias entre evaluacion y monitoreo que nos llevaron a recomen-dar
que esta tecnica debera ser utilizadapara
evaluacion de un punto en el tiempo, y nopara
un monitoreo temporal de el estado de agostaderos. Por ultimo, recomendamos un mecanismopara adaptar
y modificar esta tecnicapara
reflejar mejoramientos yentendimiento
de los procesos de ecosistemas. Soportamos la necesidad de medidas cuantitativaspara
el monitoreo de salud de los agostaderos,por
to cual proponemos algunas medidas que creemos que pueden tomarse en cuentapara
algunos de los 17indicadores.
BLM, NRCS, USGS and ARS jointly funded this project. Authors wish to thank Drs. B. Bestelmeyer, J. Alexander, L. Eddleman, M. Karl, W.C. Krueger, M. Kothmann, W. Laycock, M. Miller, P. Sims, E.L. Smith, T. Stohlgren, S.
Swanson, G. Tanner, T. Thurow, J. Trlica, various BLM and NRCS staff, the Association of Rangeland Consultants, Western Coordinating Committee on Rangeland Ecological Research & Assessment for helpful input that improved this technique; G. Frasier and three anonymous reviewers for their critical com- ments that improved this manuscript; D. Toledo and A. Melgoza for drafting the Spanish version of the abstract.
Manuscript accepted 6 Mar. 2002.
Rangeland assessments in the United States over the past centu- ry have relied heavily on the Clementsian view of plant succes- sion that plant communities progress or regress along predictable courses of defined communities in response to changes in distur- bance or environmental regimes, including grazing and precipita- tion (Clements 1920, Dyksterhuis 1949). Rangeland scientists and managers have increasingly questioned the appropriateness
of this model for making 1 type of range-
land assessment, rangeland condition (Westoby
et al. 1989a, 1989b,Friedel
1991, Laycock 1991, Svejcar and Brown 1991). Two panelsof experts, National Research Council
(NRC 1994) and theSociety for Range Management Task Group
onUnity
inConcepts and Terminology Committee (SRM Task Group 1995), suggested alternative
approaches for evaluating rangeland status that relied on factors other than the tradi- tional rangeland condition classification and on similarity of plant species compo- sition to a single climax community. The NRC (1994) experts advocated the evalua- tion of multiple indicators to assess a site's
degree of
soilstability
andwatershed
function, integrity of nutrient cycles and energy flow, and presence of functioningrecovery mechanisms.
The SRMTask Group (1995) recommended that
new assessments focus primarily on the soil stability of a site. The Task Group recom- mended and the SRM adopted the follow- ing: (1) that evaluations of a site be based on the expected capability for that land unit (the ecological site) to support a nat- ural range of potential plant communities;(2) that each potential plant community be evaluated for its ability to protect the site from
accelerated erosion;
and (3)that
managers develop objectives for land uses and manage the land to achieve or main- tain a desired plant community that pro- tects the site against accelerated erosion.The U. S.
Department of
theInterior (USDI), Bureau of Land Management (BLM) and the
U. S.Department of
Agriculture (USDA), Natural Resources Conservation Service (NRCS) expressed a need for a rapid technique that provides aninitial assessment of rangeland health
based on a workable set of criteria from a combination of the NRC (1994) and SRM Task Group (1995) reports. These agen- cies were not seeking a monitoring tech-nique (as defined
by SRMGlossary
Update Task Group 1998) to determine if their management objectives had been met over time or
if
significant progress had been made toward meeting these objec- tives. Rather, they sought a moment-in- timeassessment that would
beequally
effective in estimating the status of most rangeland communities (i.e., from tropical grasslands and coastal marshes to desert and tundra ecosystems) within the United States.We address 4 objectives in this paper.
First, we provide an overview of a tech- nique that satisfies the NRCS/BLM crite-
ria (Pellant et
al.2000). Second,
wedescribe the approach used to develop this technique and introduce an improved tech- nique for developing reference conditions for ecological sites. Third, we define the intended applications of the technique and explain the why we believe this technique may be used to provide a moment-in-time assessment of rangeland health, but not to temporally monitor rangelands. Fourth, we
describe
amechanism for adapting
the technique for different ecosystems and for ensuring that the technique will continue to reflect improvements in understanding of ecosystem processes.Rangeland Health
We have chosen to use a definition of rangeland health developed by an ad hoc
interagency committee
(USDA, NRCS 1997). Rangeland health is the degree to which the integrity of the soil, vegetation, water and air as well as theecological
processes of the rangeland ecosystem arebalanced and sustained. Integrity
is defined as the maintenanceof
the func- tional attributes characteristic of a locale,including normal variability. Although
there are a number of problems associated with applying the term "health " to natur- al ecosystems (Wicklum and Davies 1995, Lackey 1998, Rapport et al. 1998, Smith 1999), we elected to retain it. The NRC (1994) report used the term in the title of its publication. Concurrently, the public has begun to accept this term and to asso- ciate it with the status of ecological sys- tems. With Rangeland Reform in 1994, the BLM began developing standards for rangeland health and guidelines for live- stock grazing management on BLM range-lands with
theassistance of Resource
Advisory Councils (USDI, BLM 1994).Although these standards and guidelines differ for each state, they all incorporate language that relates to ecosystem health and have become the BLM
policy for assessing public land health and for
obtaining or maintaining ecological struc- ture and function on BLM-managed lands (USDI, BLM 2001). Similarly, the NRCS has incorporated the term rangeland health into their latest addition of the National Range and Pasture Handbook and into the inventory phase of the conservation plan- ning process that they conduct with pri- vate landowners (USDA, NRCS 1997). By retaining and defining rangeland health, wemaintain
aconnection
to the NRC report, to BLM's standards and guidelines for managing rangelands, and to NRCS National Range and Pasture Handbook.Historical Development
Background. In the mid 1990's, several groups simultaneously advocated that all U.S. governmental agencies with responsi- bility for managing or reporting rangeland status should coordinate a national assess- ment of rangelands using common tech- niques and designs (West et al. 1994, NRC 1994, SRM Task Group 1995). Two of
these reports
(NRC 1994, SRMTask
Group 1995) recommended the develop- ment of quantitative techniques for assess- ing ecosystem status, but both also noted that researchers would need to develop new and efficient techniques to measure many indicators of ecosystem status.The NRC (1994) and SRM Task Group
(1995) also recommended that assess-
ments be used toclassify
and compare similar combinations of soils and climate that have the capacity to support ecosys- tems with similar plant communities and production (e.g., ecological sites). Newecological site descriptions (USDA,
NRCS 1997), which are in the process of being developed, recognize and portray the multiplicity of vegetation states and transitions among states that are expected with natural or human-induced changes (Westoby et al. 1989a, 1989b, Stringham et al. 2001). These descriptions also use the threshold concept to describe unidirec- tional changes in ecosystem structure andecosystem functional processes.
When these thresholds are crossed, recovery tooriginal ecosystem states
isdifficult
(Laycock 1991, Friedel 1991, SRM Task Group 1995). When possible, ecosystem assessments should strive to incorporate these concepts as research results refine our understanding of states, transitions and thresholds.In 1997, agency leaders for the BLM,
NRCS, and the USDA Forest Service
signed a Memorandum of Understanding (interagency MOU group) that formed a committee responsible for overseeing the development of a common national range- land assessment technique. This commit- tee is pursuing the development of quanti- tative assessment indicators and protocols.While quantitative national assessment techniques are being developed, the BLM and NRCS identified a need for a rapid assessment technique that could provide a
preliminary assessment of rangeland
health at the management unit or lower level. Additionally, the technique could provide a communication tool with stake- holders regarding the status of ecosystem properties and processes.Approach used
todevelop the tech- nique.
In 1995,the NRCS and
BLM began developmentof qualitative
tech- niques for theassessment of rangeland health
using the NRC (1994) and SRM Task Group (1995) recommendations as a starting point. These efforts resulted in the development of 2 similar protocols. Thefirst
2versions of this technique were
developed separately by the BLM (Pellant 1996) and NRCS (USDA, NRCS 1997).These versions were similar, but not iden- tical. In 1997, we integrated these versions and began a coordinated effort to evaluate each indicator based on the scientific liter- ature and field tests in rangeland ecosys-
tems throughout the United States.
Indicators that were not supported by the literature, that could not be consistently applied or
interpreted,
or that were not sensitive to changes in ecosystem structureor function across
awide variety of
ecosystems, were modified, replaced ordiscarded. For example, repeatability
among observers varied using the BLM version that contained only 3 rating cate- gories (properly functioning, functioning at risk, and non-functioning) for 18 indica- tors divided among a biotic and a physicalattribute (Rasmussen et
al. 1999). In response, we adjusted the rating categories to 5, the level used in the NRCS version of the technique.This iterative process involved approxi- mately 500 people participating in over 16 training or testing sessions in 10 states covering 9 of the 36 ecosystem provinces of the humid, temperate and dry domains in the 48 contiguous states in the United States (Bailey et al. 1994).
Participants
included scientists (federal and universi- ty), federal, state, and tribal land man- agers, ranchers and members of conserva- tion organizations. Over 20 scientists, 25 BLM and NRCS resource specialists, 35consultants from the Association of
Rangeland Consultants, and members of the Western Coordinating Committee onRangeland Ecological Research and
Assessment (WCC-40) reviewed and criti- cized the final draft of the technique. The technique and the document (Pellant et al.2000) were
improved
byincorporating
modifications suggested by these peers.For example, training participants found it difficult to provide a single assessment of rangeland health for an evaluation area and that they wanted to be able to generate information relevant to specific attributes.
In response, we modified the technique to provide separate ratings for each of the 3
attributes and to eliminate any reference to a single rating of overall status.
Description of the Technique (Methods)
Overview. The technique involves eval- uating all locations using the same mini- mum set of 17 qualitative indicators rela- tive to their potential within an ecological
site.
Weuse the Society for Range
Management (SRM Glossary Update Task Group 1998) definition of an ecological site being "a kind of land with specific physical characteristics which differs from other kinds of land in its ability to produce distinctive kinds and amounts of vegeta- tion and in its response to management."Site potential for each indicator is defined by that indicator's presence and range of
amount
inresistant
andresilient plant
community phases that maximize reten- tion of soil. These may be determined by examining a range of reference areas thatdescribe these phases
or they may be defined in or inferred from the ecological site description. Ecological site descrip- tions describe soil associations (as defined by the Soil Science Societyof
America 1997) and their physical, hydrological and biological characteristics that produce dis- tinctive kinds and amounts of vegetation.The amount
of information
included in ecological site descriptions varies depend- ing on when the description was written.Early descriptions, originally called range site descriptions, contained basic descrip- tions of soils and vegetation. Ecological site descriptions written or revised since 1997 contain additional detail on the vari- ation in plant composition, cover and pro- duction for the dynamic set of vegetation states and on hydrologic and soil stability characteristics of the ecological site. The NRCS has
committed
to aprogram of
revising all previously written range site and ecological site descriptions into this newformat (Pers.
Comm. G.Peacock, NRCS Grazing Lands Technology
Institute, Fort Worth Tex.). All currently approved ecological site descriptions are available at local NRCS offices. In addi- tion, they will be available on the Internet atthe PLANTS database homepage (USDA, NRCS 2001) under the Ecological Site Information System
(ESIS) heading. If neither reference areas nor an ecological site description exist, then agroup of
soil andplant experts
should define and document their expecta- tions for eachof
these indicators using their knowledge and data about similarsoils and plant communities.
Three overlapping subsets of indicators are used to assess 3 attributes of the site:
soil and site stability, hydrologic function,
and biotic integrity.
We use the term attribute to describe an ecosystem compo- nent that cannot be directly measured, but can be approximated by a set of observ- ableindicators of
thecomponent.
The assessment of these 3 attributes is the final product of the technique. In the remainder of this section, we describe attributes andindicators, outline
the technique that is used to evaluate each indicator relative toits potential for
aparticular site.
We include a new method for documenting reference conditions for each indicator and define how the 3 attributes are evaluated based on a combination of indicators to arrive at an assessment of the status of each attribute.Attributes. Both the SRM Task Group (1995) and the NRC (1994) reports sug- gested a single rating for the site assess-
ment. The
SRMTask Group (1995) emphasized soil conservation
intheir
hypothetical quantitative approach. Theyproposed the development of
aSite
Conservation Rating (SCR), "an assess- ment of the protection afforded a site bythe current vegetation against loss of
potential." They also proposed that a Site Conservation Threshold (SCT), "the kind, amount, and/or pattern of vegetation need- ed as a minimum on a given site to preventaccelerated erosion," would provide
a mechanism for categorizing a site as "sat- isfactory or sustainable" or "unsatisfactory orunsustainable." Although this Task
Groupproposed
this new approach for evaluating lands, they clearly stated that criteria for evaluating the SCR and SCTshould
beobjective and quantitative
enough to serve as monitoring parameters
for assessing the trend
inthe
SCR.However, these criteria "will have to be worked out by research and professional judgment for each ecological site" (SRM Task Group 1995). To our knowledge, few studies have attempted to develop or test quantitative criteria for a SCR (Watters et al. 1996) whereas some development has begun for some indicators of forest and
rangeland health
orsustainability
(de Soyza et al. 1997, 2000, Weltz et al. 2000, Woodley et al. 2000, Herrick et al. 2002).The NRC (1994) suggested classifying lands into 3 categories using soil and eco- logical processes as basic elements of site production: (1) those lands that remain above an early warning line where the land produces at its
potential for
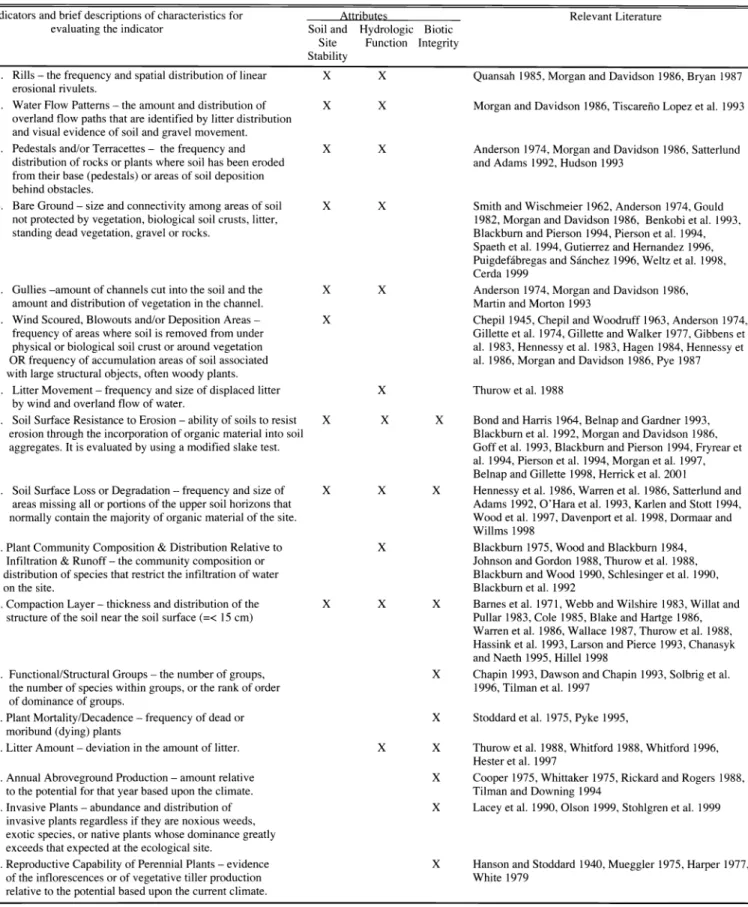
com- modities and other values; (2) those that fall below this early warning line and have a reduced ability to produce commodities and support other values, but where this reduction can be reversed through man-Table 1. Standard indicators included in the rangeland health protocol, attributes to which each indicator applies, and publications used to develop the descriptors and interpretations for each indicator.
Indicators and brief descriptions of characteristics for evaluating the indicator
1. Rills
-
the frequency and spatial distribution of linear erosional rivulets.2. Water Flow Patterns
-
the amount and distribution of overland flow paths that are identified by litter distribution and visual evidence of soil and gravel movement.3. Pedestals and/or Terracettes
-
the frequency and distribution of rocks or plants where soil has been eroded from their base (pedestals) or areas of soil deposition behind obstacles.4. Bare Ground
-
size and connectivity among areas of soil not protected by vegetation, biological soil crusts, litter, standing dead vegetation, gravel or rocks.5. Gullies -amount of channels cut into the soil and the amount and distribution of vegetation in the channel.
6. Wind Scoured, Blowouts and/or Deposition Areas
-
frequency of areas where soil is removed from under physical or biological soil crust or around vegetation OR frequency of accumulation areas of soil associated with large structural objects, often woody plants.
7. Litter Movement
-
frequency and size of displaced litter by wind and overland flow of water.8. Soil Surface Resistance to Erosion
-
ability of soils to resist erosion through the incorporation of organic material into soil aggregates. It is evaluated by using a modified slake test.9. Soil Surface Loss or Degradation
-
frequency and size of areas missing all or portions of the upper soil horizons that normally contain the majority of organic material of the site.10. Plant Community Composition & Distribution Relative to Infiltration & Runoff
-
the community composition or distribution of species that restrict the infiltration of water on the site.11. Compaction Layer
-
thickness and distribution of the structure of the soil near the soil surface (=< 15 cm)12. Functional/Structural Groups
-
the number of groups, the number of species within groups, or the rank of order of dominance of groups.13. Plant Mortality/Decadence
-
frequency of dead ormoribund (dying) plants
14. Litter Amount
-
deviation in the amount of litter.15. Annual Abroveground Production
-
amount relative to the potential for that year based upon the climate.16. Invasive Plants
-
abundance and distribution of invasive plants regardless if they are noxious weeds, exotic species, or native plants whose dominance greatly exceeds that expected at the ecological site.17. Reproductive Capability of Perennial Plants
-
evidenceof the inflorescences or of vegetative tiller production relative to the potential based upon the current climate.
Soil and Site Stability
Biotic Function Integrity
X X Quansah 1985, Morgan and Davidson 1986, Bryan 1987
X X Morgan and Davidson 1986, Tiscareno Lopez et al. 1993
X X Anderson 1974, Morgan and Davidson 1986, Satterlund and Adams 1992, Hudson 1993
X X Smith and Wischmeier 1962, Anderson 1974, Gould 1982, Morgan and Davidson 1986, Benkobi et al. 1993, Blackburn and Pierson 1994, Pierson et al. 1994, Spaeth et al. 1994, Gutierrez and Hernandez 1996, Puigdefabregas and Sanchez 1996, Weltz et al. 1998, Cerda 1999
X X Anderson 1974, Morgan and Davidson 1986,
Martin and Morton 1993
X Chepil 1945, Chepil and Woodruff 1963, Anderson 1974, Gillette et al. 1974, Gillette and Walker 1977, Gibbens et al. 1983, Hennessy et al. 1983, Hagen 1984, Hennessy et al. 1986, Morgan and Davidson 1986, Pye 1987
X Thurow et al. 1988
X X X and Harris 1964, Belnap and Gardner 1993, Blackburn et al. 1992, Morgan and Davidson 1986, Goff et al. 1993, Blackburn and Pierson 1994, Fryrear et al. 1994, Pierson et al. 1994, Morgan et al. 1997, Belnap and Gillette 1998, Herrick et al. 2001
X X X et al. 1986, Warren et al. 1986, Satterlund and
Adams 1992, O' Hara et al. 1993, Karlen and Stott 1994, Wood et al. 1997, Davenport et al. 1998, Dormaar and Willms 1998
X Blackburn 1975, Wood and Blackburn 1984, Johnson and Gordon 1988, Thurow et al. 1988, Blackburn and Wood 1990, Schlesinger et al. 1990, Blackburn et al. 1992
X X X et al. 1971, Webb and Wilshire 1983, Willat and
Pullar 1983, Cole 1985, Blake and Hartge 1986, Warren et al. 1986, Wallace 1987, Thurow et al. 1988, Hassink et al. 1993, Larson and Pierce 1993, Chanasyk and Naeth 1995, Hillel 1998
X Chapin 1993, Dawson and Chapin 1993, Solbrig et al.
1996, Tilman et al. 1997
X Stoddard et al. 1975, Pyke 1995,
X
x
Thurow et al. 1988, Whitford 1988, Whitford 1996, Hester et al. 1997X Cooper 1975, Whittaker 1975, Rickard and Rogers 1988, Tilman and Downing 1994
X Lacey et al. 1990, Olson 1999, Stohlgren et al. 1999
X Hanson and Stoddard 1940, Mueggler 1975, Harper 1977, White 1979
Relevant Literature
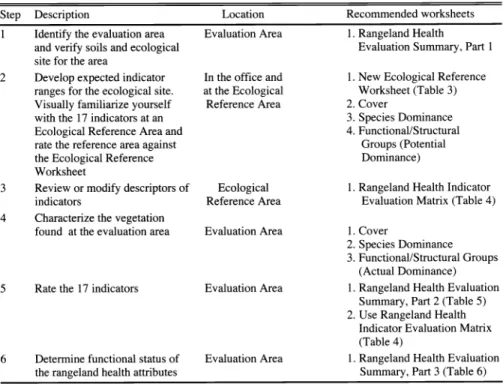
Table 2. The 6 steps of the Interpreting Indicators of Rangeland Health (Pellant et al. 2000) are summarized along with the location (evaluation or reference area) where the step is completed, and the recommended worksheets (found in Pellant et al. 2000) that are used when completing each step.
Step Description
1 Identify the evaluation area and verify soils and ecological site for the area
2 Develop expected indicator ranges for the ecological site.
Visually familiarize yourself with the 17 indicators at an Ecological Reference Area and rate the reference area against the Ecological Reference Worksheet
3 Review or modify descriptors of indicators
4 Characterize the vegetation found at the evaluation area
5 Rate the 17 indicators
Location Evaluation Area
In the office and at the Ecological Reference Area
Ecological Reference Area
Evaluation Area
Recommended worksheets
1. Rangeland Health Evaluation Summary, Part 1
1. New Ecological Reference Worksheet (Table 3) 2. Cover
3. Species Dominance 4. Functional/Structural
Groups (Potential Dominance)
1. Rangeland Health Indicator Evaluation Matrix (Table 4)
1. Cover
2. Species Dominance 3. Functional/Structural Groups
(Actual Dominance) Evaluation Area 1. Rangeland Health Evaluation
Summary, Part 2 (Table 5) 2. Use Rangeland Health
Indicator Evaluation Matrix (Table 4)
6 Determine functional status of Evaluation Area 1. Rangeland Health Evaluation the rangeland health attributes
agement changes; and (3) those sites with substantial reductions in commodities and values where management changes are not likely to reverse this reduction. They pro- posed that criteria for rangeland health be
defined using multiple indicators
in 3major areas: (1) soil stability and water- shed function; (2) the integrity of nutrient cycles and energy flow; and (3) the pres- ence of functioning recovery mechanisms.
Although they proposed these criteria, they recognized the lack of quantitative proce- dures that could be used efficiently and
economically
inassessments of large
amounts of rangelands. They advocated the need for research to develop such quantita- tive approaches, but in lieu of such tech- niques, they suggested a series of indica- tors that could be qualitatively evaluated.Although a single rating of a site's sta- tus is intuitively appealing, we discovered early in the development process of this current approach that some sites might have attributes
of ecosystem
status that were operating properly while other attrib- utes were not. Initially, we began to look for indicators of nutrient cycling, energyflow and recovery mechanisms that
observers could evaluate, but direct link- ages between observable quantitative or qualitative measuresof
these processes were not easy to determine. By blendingthe NRC and the
SRMTask Group
Summary, Part 3 (Table 6)
approaches and
byusing
aniterative
process of field tests and peer reviews by land managers and scientists, we identified 3 attributes of ecosystem status that can be evaluated using multiple indicators:
Soil
or
SiteStability -
The capacityof
the site to limit redistribution and loss of soil resources (including nutri- ents and organic matter) by wind or water;Hydrologic Function -
The capacity of the site to capture, store and safely release water from rainfall, run-on and snowmelt (where relevant), to resist a reduction in this capacity and to recov- er this capacity following degradation;Integrity
of the BioticCommunity -
The
capacity of
the site tosupport
characteristic functional and structural communities in the context of normalvariability
and toresist
lossof
this function and structure caused by dis-turbance,
and torecover following
each disturbance.Indicators. We have selected indicators to represent components of attributes that are difficult to measure directly. This use
of indicators
issimilar
to the approach used by others in selecting forest or range- land indicators (Breckenridge et al. 1995, de Soyza et al. 1997, 2000, Whitford et al.1998, Woodley et al. 2000). We define indicators as observable components of an
ecosystem that are related to 1 or more attributes, are easily evaluated, and used in combination with other indicators as an index of the status of that attribute. Each indicator at an evaluation area is assigned to 1 of 5 categories based on its departure from what is expected for that ecological site. The expectation for the ecological site should be derived from the soil survey, the
ecological
sitedescription
or, as a last resort, from expert opinion. Evaluators rate a site using 5 categories that describe a gradient for each indicator associated with each attribute. Indicators were select- ed if we could provide affirmative answers to 2 successive questions. (1) Did peer-reviewed literature exist
to support theassociation of this indicator with its attribute?
(2)Could experienced land
managers understand and consistently pro- vide a visual assessment of this indicator?Currently, we have included 17 indica- tors for rating the 3 attributes (Table 1).
Additional information on the scientific basis for each indicator is included in an interagency technical reference (Pellant et al. 2000).
Indicators
can beassociated
with single attributes, such as litter move- ment's association with hydrologic func- tion and invasive plants' association with biological integrity. Other indicators are associated with 2 or all 3 attributes (Table 1). We recognize that some of these indi- cators might be related to additional attrib- utes, but we believe the associations that we have selected are the strongest or the best supported by the literature.Procedure. To rate the 3 attributes at an evaluation area, an evaluator must com- plete a 6-step process (Pellant et al. 2000, Table 2). Step 1 requires that evaluators visit an evaluation area to verify the soil
and the ecological site of the area.
Evaluation areas may be specific sites of concern within a management unit (e.g., a pasture, watershed, allotment or manage- ment area) or they may be a representative subsample of strata within a larger man- agement unit (see Intended Applications).
Evaluation areas should be within a spe- cific landscape position, include the natur- al
variability of
the ecological site, but remain sufficiently small (approximately 0.4 to 2.0 ha or 1 to 5 ac), so that evalua- tors can easily walk throughout the area andobserve
thevariation
in theplant
species composition and soil surface fea- tures. Since assessments will be made rel- ative to the ecological site description orecological reference
areas on the same ecological site, evaluators must be certain of the evaluation area's landscape position and soils (same ecological site). The eco-Table 3. Example of an Ecological Reference Worksheet developed for the Limy Ecological Site Description (italics) in the Southern Desert 4 subarea of Southern Desertic Basins, Plains and Mountains Major Land Resource Area (MLRA 42) in New Mexico. This example is based on the Natural Resources Conservation Service Ecological Site Description, unpublished data, and collective knowledge of J. Christensen, B. Call, B. Bestelmeyer, R. Placker, D. Trujillo, L. Hauser, D. Coalson, P. Smith, and J. Herrick.
Indicators. For each indicator, describe the potential for the site. Where possible, (1) use numbers, (2) include expected range of values for poor-good years, when appropriate & (3) cite data. Continue descriptions on separate sheet.
1. Number and extent of rills: None.
2. Presence of water flow patterns: None, except following extremely high intensity storms, when short (less than 1 m) flow patterns may appear.
3. Number and height of erosional pedestals or terracettes: None.
4. Bare ground from Ecological Site Description or other studies (rock, litter, lichen, moss, plant canopy are not bare ground): 20
-
30 % bare ground;bare patches should be less than 8-10 inch diameter; occasional 12 inch patches associated with shrubs. Larger bare patches also associated with ant mounds and rodent disturbances.
5. Number of gullies and erosion associated with gullies: None.
6. Extent of wind scoured, blowouts and/or depositional areas: None.
7. Amount of litter movement (describe size and distance expected to travel): Minimal and short, associated with water flow patterns following extremely high intensity storms. Litter also may be moved during intense wind storms.
8. Soil surface (top few mm) resistance to erosion (stability values are averages
-
most sites will show a range of values): Stability class (Herrick et al.2001) anticipated to be 5-6 at surface and subsurface under vegetation and 4-5 at surface and subsurface in the interspaces. These values need verification at reference sites.
9. Soil surface structure and SOM content (include type and strength of structure, and A-horizon color and thickness): 2-4 inch dark brown A horizon with medium granular structure (Otero County Armesa series description refers to platy structure; probably not from a true reference site).
10. Effect of plant community composition (relative proportion of different functional groups) & spatial distribution on infiltration & runoff: High grass canopy and basal cover and small gaps between plants should reduce raindrop impact and slow overland flow, providing increased time for infiltra- tion to occur. High root density of blue grama can limit infiltration. The more herbaceous vegetation on this site will result in less rain necessary to sustain this site because more water is retained.
11. Presence and thickness of compaction layer (usually none; describe soil profile features which may be mistaken for compaction on this site): None 12. Functional/Structural Groups (list in order of descending dominance by above-ground weight using symbols:
»,
>, = to indicate much greaterthan, greater than, and equal to): Blue grama > Black grama > warm season bunchgrasses > Yucca = shrubs >> sub-shrubs = succulents; Forbs 0
-
8% depending on the year.
13. Amount of plant mortality and decadence (include which functional groups are expected to show mortality or decadence): Grasses will nearly always show some mortality and decadence.
14. Average percent litter cover ( %) and depth ( inches). 20
-
25 % litter cover and 0.25 inch depth.15. Expected annual production (this is TOTAL above-ground production, not just forage production)
pounds/acre or tons/ha (choose one): 650 to 1200 pounds/acre based on ecological site description. Could be even higher on particularly good years.
16. Potential invasive (including noxious) species (native and non-native). List species which characterize degraded states and which, after a threshold is crossed, "can and often do continue to increase regardless of the management of the site and may eventually dominate the site": Possibly cre- osote bush which is an invader on similar ecological sites; snakeweed is cyclical, so not regarded as an invasive plant on this ecological site.
17. Perennial plant reproductive capability: all species should be capable of reproducing.
logical site will encompass the normal range of variation of successional commu- nities (community phases) with reversible transitions (community pathways) within an
ecological state (as defined
by Stringham et al. 2001). Since some evalu- ation areas have crossed thresholds (irre- versible transitions) to another ecological state, evaluators must recognize that soils, not plant communities, will be the best aid in identifying the ecological site.To document soils at evaluation and ref-
erence areas, evaluators document
the presence and depthsof
theappropriate
diagnostic soil horizons found in each area and provide the corresponding information from the soil survey orecological
sitedescription
inthe first portion of the
Rangeland Health Evaluation Summary (Pellant et al. 2000) and the EcologicalReference Worksheets (Table
3).Evaluators also document the area's loca- tion, parent material, slope gradient and topographic position on these same work- sheets. Recent weather
conditions
andcycles should be reported along with dis- turbances or off-area influences that might affect the assessment.
The objective of the next 2 steps is to define the expected status of each indica- tor on a healthy site. This process involves examination, and in some cases modifica- tion, of the descriptor narratives for the 5
categories for
each indicator. We have prepared several worksheets to assist in this process (Table 2).During Step
2,each indicator
is described on a new portion of the ecologi- cal reference worksheet (Table 3) devel- oped after the publication of Version 3.0 (Pellant et al. 2000). We have found that the most effective way to develop thesereference worksheets
is toassemble
adiverse group of experts regarding
theecological site. Individuals should
be included who have extensive, long-term knowledge of the ecological site, in addi- tion to rangeland professionals who under- stand general soil-climate-vegetation rela- tionships and the relevant literature. Theseindividuals should use all available
sources of information, particularly eco-logical
sitedescriptions
and data from potential reference sites. The process is extremely useful for identifying knowl- edge gaps that require additional research and for helping diverse groups to improve their collective understanding of relation-ships between soils, vegetation and
hydrology. This worksheet is valuable for 3 reasons. First, it is more convenient and therefore more likely to be referred to in the field than a complete ecological site description. Second, the completed refer- ence worksheet can be used to facilitate the development of consensus about eachindicator's presence
and amount on an ecological site, particularly when no eco- logical site description is available. Third, and most important, it can increase theconsistency with which the method
is applied by clarifying the standard that is used to evaluate each indicator. A related use is to compare the description to the"None-Slight" default descriptor in Pellant
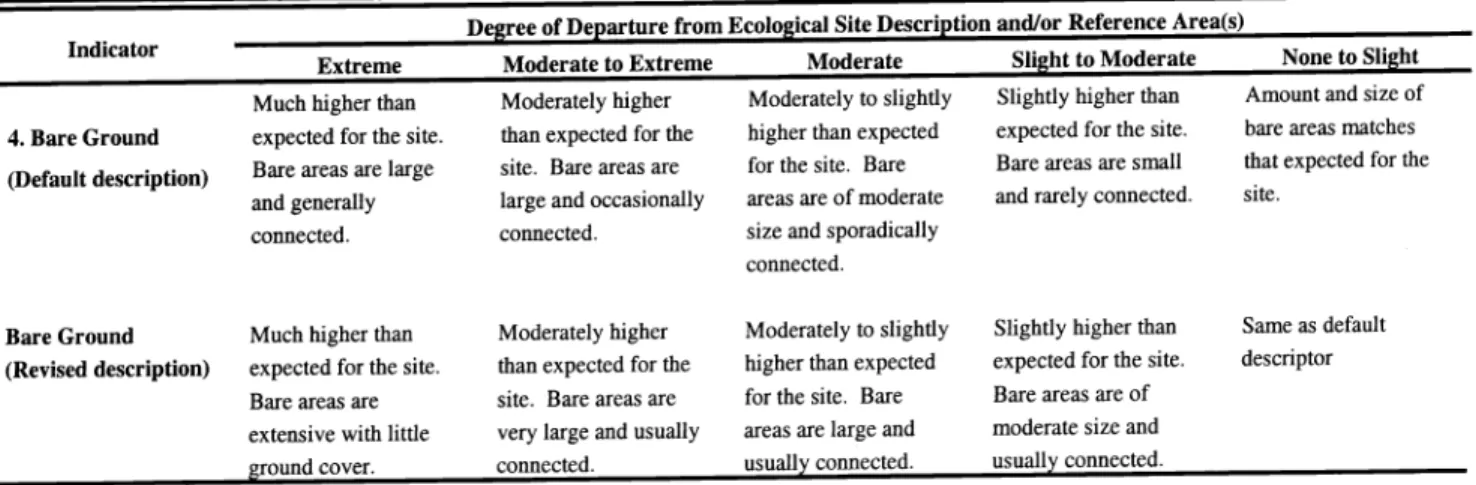
Table 4. An example of a series of default descriptions for the bare ground indicator and a hypothetical revision of the descriptions for an ecological site (from Pellant et al. 2000).
Indicator
Extreme Much higher than 4. Bare Ground expected for the site.
(Default description) Bare areas are large and generally connected.
Bare Ground Much higher than (Revised description) expected for the site.
Bare areas are extensive with little ground cover.
Degree of Departure from Ecological Site Description and/or Reference Area(s) Moderate to Extreme
Moderately higher than expected for the site. Bare areas are large and occasionally connected.
Moderate Slight to Moderate Moderately to slightly Slightly higher than higher than expected expected for the site.
for the site. Bare Bare areas are small areas are of moderate and rarely connected.
size and sporadically connected.
None to Slight Amount and size of bare areas matches that expected for the site.
Moderately higher Moderately to slightly Slightly higher than Same as default than expected for the higher than expected expected for the site. descriptor site. Bare areas are for the site. Bare Bare areas are of
very large and usually areas are large and moderate size and connected. usually connected. usually connected.
including differences within a single soil series. These differences can also affect the resistance of the site to degradation and recovery.
Evaluators should check
texture, depth and topographic position, particularly in landscapes where signifi- cant runoff or run-on occurs.To assist evaluators in identification of appropriate ERAs and comparisons with the evaluation area(s), we prepared anoth- er set of worksheets (Table 2) to lead them through the process of observation, cate-
gorization and documentation of the
appropriate information. In the canopy and ground cover worksheet, evaluators esti- mate broad cover classes for vegetation life forms and ground cover parameters.Species dominance based on cover or bio- mass is estimated for each major life form group and for the whole site. In the struc-
tural
andfunctional
groups worksheet, species are placed into structural and func- tional groups and each group is placed into a dominance class based on the groups rel- ative production or cover. These work- sheets assist evaluators to visualize plant species, soil, and hydrological indicators under current weather conditions in this locale. Information from eachof
these worksheets is used together with addition- al observations to verify that an ecological reference area agrees with the ecological reference worksheet where soils and the ecological site are verified and where the presence and status of each of the 17 indi- cators is documented. Photographs, and if possible quantitative data,of
ecological reference areas are also recommended to aid in subsequent assessments of similar landscape units.In some locations and ecological sites, finding an ERA that fits within the range of variation of the ecological site descrip- et al. (2000) in order to highlight those
indicators that are likely
torequire
descriptor revisions.
Once the reference worksheet is devel- oped, evaluators should attempt to locate
and visit ecological reference areas
(ERA). TheERA's
arelandscape units
that provide visual representations of the characteristics and variability in the eco- logical site description. These areas do not need to bepristine, historically unused
lands (e.g., climax plant communities or relict areas). This concept is similar to thatproposed
bythe Western Regional
Coordinating Committee-40 on Rangeland Ecological Research and Assessmentof using well-managed rangelands and
appropriate relict areas as benchmarks forassessments (West
et al. 1994).Since revised ecological
site descriptions will include the range of vegetation communi- ties that may exist on an ecological site, the ERA shouldrepresent
the expected state that would result from natural distur- bances such as fire or drought. A singlereference area
willrepresent
1spatial
point and temporal moment of this range of variation for that ecological site. Thus, an ERA will represent a single community phase within the ecological state for that ecological site. Evaluators should recog- nize that vegetation composition within anecological
state maychange over time
through reversible transitions and should account for this in their interpretation of the ecological site (Stringham et al. 2001).It is also important to avoid areas that are more productive than anticipated based on the site description, particularly where there is no current or historical explana-
tion for the high productivity.
Significantly higher productivity is often due to soil or
topographic differences,
tion may be difficult because of site degra-
dation.
Inthose cases, evaluators
mayelect
toonly use the ecological site
description as the standard of comparison or may elect to use a site as an ERA with limitations. It is still useful, however, to complete worksheets based on the ecologi- cal site descriptions and knowledge from local experts.In
Step 3, evaluators compare the series of default narrative descriptions for ratingeach indicator
tothe ecological site
description and the ERA to determine ifdefault descriptions
areadequate for
describing the indicator in the ecological site or if a modified description should be written. Each of the 17 indicators has a separate default set of narrative descrip- tions similar to the default description for bare ground shown in Table 4. All of the narrative descriptors rate indicators at the evaluation area based on thatlocation's
degree of departure from ecological site description. Below each default narrative, a blank space is provided for evaluators to write a revised description. These reviseddescriptions can
bewritten
and used immediately, provided that the change is clearly documented in reports or recom-mendations
made based on the assess- ment, and that consistency can be main- tained among assessments made in a par-ticular
area or for aparticular project.
When revised descriptions are necessary, they should be submitted to the NRCS State Rangeland Management Specialist.
Each ecological site will have one set of descriptions. This person along with other interested people will discuss and consider the
inclusion of
theproposed narrative
revision in updated ecological site descrip- tions using accepted NRCS protocols for revisions. Eventually, we hope that eachTable 5. A hypothetical example of a completed Rangeland Health Evaluation Summary Worksheet, part 2 used in the rangeland health assessment for a site. Letters S, W and B under the Attribute column refer to Soil, Water, and Biology and indicate association of the indicator with the respective attributes, Soil or Site Stability, Hydrologic Function, or Biological Integrity. The comments section is used to help evaluators document their rationale for the specific rating of selected indicators.
Departure from Ecological Site Description/Reference Area(s)
Attribute Indicators Extreme Moderate to Moderate Slight to None to Slight
Moderate S,W 1. Rills
Comments
S,W 2. Water Flow Patterns Comments
S,W 3. Pedestals and/or Terracettes
Comments
-
Several plants alongf
towpaths have roots exposed, but site is not prone to frost heaving S,WComments S,W
4. Bare Ground
5. Gullies
comments
-
One gully visible, vegetation in bottom and on sides; no evidence of headcutsS
Comments W Comments S,B,W
6. Wind Scoured, Blowouts and/or Deposition Areas
7. Litter Movement
8. Soil Surface Resistance to Erosion
Comments
-
The majority of soil samples from under canopies of plants tending to fall apart when placed in water S,B,W 9. Soil Surface Loss or DegradationComments
-
A-horizon missing in interspaces; present under shrubs or larger grasses WComments S,B,W
10. Plant Community Composition & Distribution Relative to Infiltration & Runoff
11. Compaction Layer
Comments
-
Interspaces with platy structure at 2-3 cm depth & roots tending to grow horizontally at this point; No evidence under shrubs B 12. Functional/Structural GroupsComments
-
Tall and short C4 grasses not present; Midgrass C3 grasses restricted to one species; Forb component not present; Shrubs dominate B 13. Plant Mortality/DecadenceComments
-
Many shrubs have died recently B,W 14. Litter AmountComments
-
Only associated with shrubs; no litter around C3 mid grasses B 15. Annual ProductionComments
-
Site should support 1800 kg/ha, but estimate less than 300 kg/ha BComments B Comments
16. Invasive Plants
17. Reproductive Capability of Perennial Plants
ecological site description will include a series of accepted narratives for indicators and attributes.
During this step, evaluators may consid- er adding
indicators that they believe should
beincluded
in theassessment.
Those indicators might include parameters that may not be important nationally, but may have regional importance. An exam-
ple of this might be the inclusion of a bio- logical soil crust indicator for specific eco- logical sites in the Colorado Plateau where these crusts are important for soil stabi-
lization (Belnap and Gardner 1993,
Johansen 1993, Warren 2001). Similar to the revised narrative, if an evaluator uses an additional indicator, then they should submit the indicator, the narrative descrip-tions and the attribute(s) to which it relates along with relevant scientific literature that provide evidence of this relationship to the NRCS