GoWvis: a web application for Graph-of-Words-based text visualization
and summarization
Antoine J.-P. Tixier, Konstantinos Skianis, and Michalis Vazirgiannis
Computer Science Laboratory ´Ecole Polytechnique, France
Abstract
We introduceGoWvis1, an interactive web
application that represents any piece of text inputted by the user as a graph-of-words and leverages graph degeneracy and community detection to generate an ex-tractive summary (keyphrases and sen-tences) of the inputted text in an un-supervised fashion. The entire analysis can be fully customized via the tuning of many text preprocessing, graph building, and graph mining parameters. Our sys-tem is thus well suited to educational pur-poses, exploration and early research ex-periments. The new summarization strat-egy we propose also shows promise.
1 Introduction
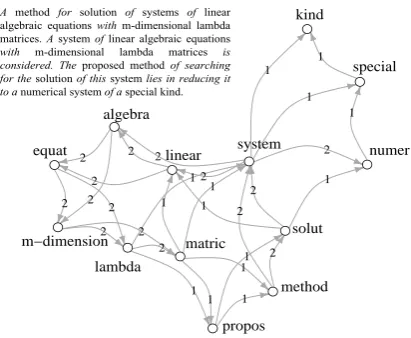
The term independence assumption made by the traditional Bag-of-Words (BoW) representation of text comes with many limitations. One approach that challenges this assumption is the Graph-of-Words model (GoW). As shown in Figure 1, it rep-resents a textual document as a graph whose ver-tices are unique terms in the document and whose edges capture term co-occurrence within a win-dow of predetermined, fixed size, that is slided over the entire document from start to finish.
This approach is statistical, as terms are linked based on local context of co-occurrence only, re-gardless of any semantic or syntactic information (Distributional Hypothesis). Unlike BoW, GoW encodes term dependency and term order (via di-rected edges). The strength of the dependence be-tween two words can also be captured by assigning a weight to the edge that links them. While other definitions can be used, we consider here edge
1https://safetyapp.shinyapps.io/
GoWvis/
2 2
2 1 2 2 2
2 2
2
2 2
2 2
2 1
1 1
1 1
1
1 1
1 2
1 1 1
1
● ● ● ●
●
●
●
● ●
●
● ● ●
method solut system linear
algebra
equat
m−dimension lambda
matric
propos
numer special kind
A method for solution of systems of linear algebraic equations with m-dimensional lambda matrices. A system of linear algebraic equations
[image:1.595.313.519.223.392.2]with m-dimensional lambda matrices is considered.The proposed method of searching for the solution of this system lies in reducing it to a numerical system of a special kind.
Figure 1: Graph-of-Words representation with POS-based screening, and directed, weighted edges. Non-(nouns and adjectives) initalic.
weights to be integers matching co-occurrence counts.
GoW can be tracked back to the works of (Mi-halcea and Tarau, 2004) and (Erkan and Radev, 2004) who applied it to the tasks of unsupervised keyword extraction and extractive single docu-ment summarization. Notably, the former effort ranked nodes based on a modified version of the PageRank algorithm.
Recently, (Rousseau and Vazirgiannis, 2015) showed that degeneracy-based approaches (i.e., extracting dense, cohesive subgraphs) could out-perform PageRank for unsupervised keyword ex-traction. We will show in subsection 3.4 how com-bining this strategy with graph clustering may im-prove summarization performance for multitopic documents. Other NLP tasks on which GoW-based approaches have reached new state-of-the-art include ad-hoc information retrieval (Rousseau and Vazirgiannis, 2013) and document classifica-tion (Rousseau et al., 2015; Malliaros and Skianis, 2015). The high success, promising potential and visual nature of the GoW representation was the
impetus for the development ofGoWvis.
The remainder of this paper is organized as fol-lows: Section 2 provides some background on graph degeneracy and community detection, Sec-tion 3 presents our system, and finally, SecSec-tion 4 concludes and discusses future work.
2 Graph mining 2.1 Graph degeneracy
k-core. A core of orderk(ork-core) of a graphG
is a maximal connected subgraph of G in which
every vertex v has at least degree k (Seidman,
1983). It is a relaxation of a clique: a k-core
with k + 1 members is a subgraph where every
two nodes are adjacent, that is, a clique (Luce and Perry, 1949). In the classical unweighted case, edge weights are not taken into account and thus
the degree of a nodevis simply equal to the
num-ber of its neighbors. In the weighted (or
general-ized) case, the degree of a vertexv is the sum of
the weights of its incident edges.
k-core decomposition. Thek-core
decomposi-tion of a graphGis the list of all its cores from 0
(G itself) to kmax (its main core). It forms a
hi-erarchy of subgraphs that are recursively included in one another and whose cohesiveness and size
respectively increases and decreases withk
(Seid-man, 1983). A linear (resp. linearithmic) time
al-gorithm fork-core decomposition can be found in
(Batagelj and Zaverˇsnik, 2002) for the unweighted (resp. weighted) case. Both algorithms implement a pruning process that removes the lowest degree node at each step.
The core number of a node is the highest or-der of a core that contains this node. Nodes with high core numbers have the desirable property of not only being central (like nodes with high de-gree centrality) but also part of cohesive subgraphs with other central nodes (i.e., the other members of the upper cores). For this reason, they make, among other things, influential spreaders (Kitsak et al., 2010) and good keywords (Rousseau and Vazirgiannis, 2015).
The main core of a graph yields a fast (but rough) approximation of its densest subgraph. In-deed, it may contain in some cases a very large portion of the nodes of the graph. As
(Seid-man, 1983) puts it,k-cores should be regarded as
seedbedswithin which it is possible to find more cohesive subgraphs.
k-truss. A triangle-based extension of k-core
that yields densest subgraphs is k-truss (Cohen,
2008). More precisely, the k-truss of a graphG
is the largest subgraph ofGin which every edge
belongs to at leastk−2cycle subgraphs of length
3 (i.e., triangles). Put differently, every edge in the
k-truss joins two vertices that have at leastk−2
common neighbors.
k-truss decomposition. Thek-truss
decompo-sition of a graph G is the set of all itsk-trusses
fromk−2tokmax. Thek-trusses correspond to
densely connectedsubsetsof thek-cores that can
be viewed as their essential parts (Malliaros et al.,
2016). The maximalk-truss thus yields a smaller
and denser subgraph ofGthat better approximates
its densest subgraph. Nevertheless, the finer
reso-lution of the k-truss decomposition comes at the
cost of a greater complexity, polynomial in the number of edges (Wang and Cheng, 2012).
By analogy with k-core, thetruss number of
anedgeis the highest order of a truss the edge
be-longs to. By extension, we define the truss number
of anodeas the maximum truss number of its
in-cident edges, like in (Malliaros et al., 2016). We wrote our own implementation of weighted
k-core in R (R Core Team, 2015). For unweighted
k-core, we used theigraph package (Csardi and
Nepusz, 2006), and for k-truss, the C++
imple-mentation offered by (Wang and Cheng, 2012).
2.2 Community detection
While thek-core andk-truss decomposition
algo-rithms converge towards theuniquemost cohesive
subgraph of a graph, the task of community
de-tection consists in clustering a graph into
multi-plegroups within which connections are dense and
between which they are sparse (Fortunato, 2010). Many community detection algorithms have been proposed, of which some of the most
pop-ular are listed below. The fundamentalModularity
function used by the first three algorithms mea-sures the strength of the partition of a graph by comparing the number of within-group edges to the expected such number in a null model (New-man and Girvan, 2004).
Thefast greedyalgorithm (Clauset et al., 2004) merges at each step the pair of nodes that yields the largest gain in modularity until a single com-munity remains. The best partition is the one as-sociated with the greatest modularity value.
modu-larity is maximized. Then, the groupings obtained at the first step are turned into nodes, yielding a new graph. This two-step process iterates until a peak in modularity is attained and no more change occurs.
The walktrap algorithm (Pons and Latapy, 2005) uses agglomerative hierarchical clustering with a random walk-based distance between ver-tices to obtain a set of subdivisions of the graph. The optimal clustering is given by the level of the hierarchy that maximizes modularity.
Finally, the infomap algorithm (Rosvall and
Bergstrom, 2008) optimizes the map equation to find an optimal compression of a description of information flow in the graph. Unlike other
afore-mentioned algorithms,infomapworks for directed
networks.
We used the R wrappers of the igraph C
im-plementations of the algorithms presented above.
Note that alligraphimplementations can
(option-ally) take edge weights into account. Unless men-tioned, all other parameters remained at their de-fault values.
3 GoWvis
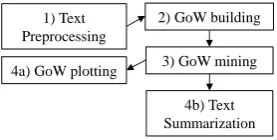
Our system was developed in R Shiny (Chang et al., 2015), and can be broken down into the four modules shown in Figure 2. The steps are sequen-tial except the last two which are performed in parallel. In what follows, we present the tuning parameters involved at each step and discuss their individual impact (all other parameters being held constant).
1) Text Preprocessing
2) GoW building
3) GoW mining 4a) GoW plotting
[image:3.595.112.251.528.598.2]4b) Text Summarization
Figure 2: System architecture
3.1 Text preprocessing
The first module cleans the inputted text by (1) removing special characters, punctuation marks except the ones indicative of sentence boundary (used by the second module, see subsection 3.2) and intra-word dashes, (2) removing numbers ex-cept dates (like “2016”), and (3) tokenizing. In
addition to R built-in functions, thestringr
pack-age (Wickham, 2015) is used here. Also, text is
split into sentences using the implementation of the Apache OpenNLP Maxent sentence detector
offered by theopenNLPR package (Hornik, 2015).
The list of sentences is eventually passed to the fourth module (see subsection 3.4). Additionally, the user is provided with the following tuning pa-rameters:
Keep only nouns and adjectives? Boolean,
de-faults to TRUE. Uses openNLP’s implementation
of the Apache OpenNLP Maxent POS tagger to perform part-of-speech (POS) tagging. Then, fol-lowing (Mihalcea and Tarau, 2004), only nouns and adjectives are kept.
Stopwords removal. Boolean, defaults to TRUE. Only actionable if no POS-based screen-ing is performed. Removes common English
stop-words2 from the SMART information retrieval
system.
Stemming. Boolean, defaults to TRUE. Re-tains only the stem of each term by
implement-ing Porter’s stemmer with the RSnowballC
pack-age (Bouchet-Valat, 2014). For instance, when
stemming is performed,winandwinningare both
collapsed to win. Stemming thus tends to yield
smaller and denser graphs.
The unique words that passed the aforelisted preprocessing steps are then used as the nodes of the graph-of-words.
3.2 Graph-of-Words building
The graph-of-words is constructed by adding
edges between the n nodes previously obtained.
Complexity isO(nW)whereW is window size.
The module offers the following tuning parame-ters:
Window size. Integer between 2 and 12, de-faults to 3. Specifies the size of the window slided over the document. Values around 3 and 4 have been reported to work well (Mihalcea and Tarau, 2004; Malliaros and Skianis, 2015). Note that the larger the window, the denser the graph, since more edges are created while the number of nodes remains constant.
Build on processed text? Boolean, defaults to TRUE. Whether the window should be slided over the (1) processed or the (2) unprocessed text. May yield very different results, depending on the pre-processing steps that have been applied. Indeed,
2http://jmlr.org/papers/volume5/
two words that are initially very distant in the
orig-inal, unprocessed text and whose co-occurence
would therefore not be captured may end up close
to each other in theprocessedtext if many words
between them (e.g., stopwords) were removed as a result of preprocessing. Consequently, build-ing the graph from the processed text tends to link more distant words and produce denser graphs than when using the unprocessed text.
Overspan sentences? Boolean, defaults to TRUE. If FALSE, an edge between two co-occurring words is only created (or if the edge al-ready exists, its weight is only incremented) if the two words belong to the same sentence. The punc-tuation marks “.”, “;”, “!”, “?”, and “...” are used here as sentence boundaries.
Color. List, defaults to heat. A set of five built-in R palettes to color the nodes of the graph,
including the color-blind-friendly gray.colors.
Node colors match their core (or truss) number
(also indicated in a legend) and go darker ask
in-creases.
3.3 Graph-of-Words mining
This module analyzes the graph-of-words returned at the previous step using graph degeneracy and community detection. The user can tweak the fol-lowing parameters to customize the analysis:
Degeneracy. List, defaults to “weighted k -core”. Choice of the graph decomposition method,
among “k-core”, “weighted k-core”, and “k
-truss”. If “weightedk-core” is selected, the edge
weights appear as edge labels in the plot.
Directed?Boolean, defaults to TRUE. Whether edge direction should be taken into account in computing node degree. Only actionable if a degree-based degeneracy algorithm has been
se-lected (i.e., any but “k-truss”). When TRUE,
edges in the plot feature arrows indicating their di-rection.
Mode. List, defaults to “all”. Which of the
in-cident edges of a node should be taken into ac-count in computing its degree, between “all” (all edges), “in” (incoming edges only), or “out” (out-going edges only). Only actionable if edge direc-tion is taken into account, and only impacts the
output of thek-core algorithms. Note that the
de-fault value “all” gives the same results as when edge direction is ignored, but generates a plot with arrow edges.
Community detection? List, defaults to “none”.
Choice of the graph clustering algorithm, among “fast greedy”, “louvain”, “walktrap”, “infomap”, and “none”. If not “none”, each main community (seesize thresholdparameter below) is separately degenerated. If “walktrap”, the user can select
the length of the random walks between2 and8
(defaults to4). If “infomap”, the user can
spec-ify whether edge direction should be taken into account. Clustering increases coverage for mul-titopic documents.
Weighted? Boolean, defaults to FALSE. Whether edge weights should be used by the com-munity detection algorithm. Only actionable if the community detection parameter is not “none”. If TRUE, the edge weights appear as edge labels in the plot.
Size threshold. Numeric (from 0.4 to 1.0, by
0.1), defaults to0.8. Only actionable if the
com-munity detection parameter is not “none”. Per-centile size threshold used to determine which
communities should be considered to be main
ones. For instance, the default value of0.8retains
as main communities the ones whose sizes (i.e.,
number of nodes) exceed that of 80% of all
de-tected communities. As will be further illustrated in subsection 3.4, this parameter enables the user to chose whether the summary should cover only the major or also the subtle topics of the
docu-ment. Nonetheless, diminishingsize threshold
in-creases the risk of including irrelevant (or noise) topics in the summary.
3.4 Text summarization
The fourth module uses the results from the previ-ous step (graph mining) to (1) extract keyphrases from and (2) select a subset of the original sen-tences in the document inputted by the user in an unsupervised manner. It is performed in paral-lel with the graph plotting module (see subsection 3.5).
1. Keyphrase extraction. The terms whose
core (or truss) number is exactly equal tokmax−
p are used as seeds from which keyphrases (n
-grams) are reconstructed. pis an integer
parame-ter between0and10that lets the user navigate the
core (or truss) hierarchy up and down. If p = 0
(the default), the main core is used. Whenever
kmax ≤ p, the user is informed that their
selec-tion is empty. In practice, one would want to re-tain all the words whose core (or truss) number is
of the (kmax −p)-core (or truss), and this is in-deed what we do for sentence selection (see “Sen-tence selection” paragraph below). Here though, we only use a single slice of the hierarchy (called ashell) to make it clear for the user how the pro-cess of keyword extraction and keyphrase recon-struction works.
Reconciliation is then performed by pasting to-gether the seeds that are found adjacent in the orig-inal, unprocessed text. For example, if “algebra” and “linear” both belong to the selected shell and “linear algebra” is present in the text, the two seeds are collapsed and added to the set of candidate keyphrases. Duplicates and keyphrases included in higher order keyphrases are then discarded.
When community detection is used, as already explained, each main community is separately de-generated. The entire process of keyterm extrac-tion and keyphrase reconstrucextrac-tion is then run for each main community, ensuring that keyphrases cover the main topics in the document.
Example. We created a two-topic 925-word
document3 by drawing and intertwining an equal
number of sentences from two Wikipedia articles,
one about the website Stack Overflow (SO) and
one aboutpizza. With all default parameters, the
keyphrases extracted are all about SO:stack
over-flow,user,answer question... However, still with all default parameters, by simply enabling com-munity detection (e.g., with “fast greedy”), the
two topics are detected (answer question, pizza
margherita,queen margherita).
Related work. Similarly, (Bougouin et al., 2013) have used clustering and graph mining for keyphrase extraction, but the other way around. They first group candidate keyphrases into topics via hierarchical clustering (with a word overlap distance), and then apply PageRank on a complete graph with topic nodes and edge weights based on keyphrase offset positions. Closer to our approach is that of (Grineva et al., 2009). Like us, they also observe that terms tend to cluster based on topic and that the largest communities correspond to the main themes in the document. However, they use a complete graph where edges are weighted based on Wikipedia-based semantic relatedness.
Addi-tionally, they selectallthe terms in the top-ranked
communities whereas we extract only a highly co-hesive subgraph from each main group.
3https://github.com/Tixierae/examples/
blob/master/sopz.txt
2. Sentence selection. Unlike for keyphrase
extraction, the entirekmax −p core (or truss) is
used here as seedbed. Representative members are drawn from the list of sentences extracted from the original document (in subsection 3.1) follow-ing a three-step process: (1) sentences that do not contain any term belonging to the selected core (or truss) are pruned out, (2) the remaining sen-tences are ranked in decreasing order according
to how many differentcentral terms they feature,
and finally, (3) sentences are selected one at a time
from the top until a certain summary length has
been reached. If two or more sentences have the same rank, the longest and least redundant is se-lected, where length is the number of words in the sentence and redundancy is computed in terms of word overlap with the current summary (stem-ming and stopword removal are performed based
on user selection). Thesummary lengthtuning
pa-rameter is a decimal number (between 0.01 and
0.51, by0.05, defaults to0.01) indicating the per-centage of total candidate sentences (from step 2 above) to include in the summary. Again, if com-munity detection is performed, the process is run separately for each community, enabling coverage of the main topics in the document. In the pre-vious example, using community detection gener-ates a 11:1 compression ratio summary covering both themes (not shown here due to space limita-tions).
3.5 Graph plotting
Done in parallel with text summarization. Plots an interactive, dynamic browser-based
represen-tation of the graph-of-words using igraph and
the visNetwork R package (Almende B.V. and
Thieurmel, 2016).
4 Conclusion and next steps
We have presented GoWvis, a freely accessible
exper-iments to quantify how it compares to the
state-of-the-art. When p > 0, taking into account the
core (or truss) numbers of terms could yield better sentence ranking.
References
Almende B.V. and Benoit Thieurmel, 2016. visNet-work: Network Visualization using ’vis.js’ Library. R package version 0.2.1.
Vladimir Batagelj and Matjaˇz Zaverˇsnik. 2002. Gen-eralized cores. arXiv preprint cs/0202039.
Vincent D Blondel, Jean-Loup Guillaume, Renaud Lambiotte, and Etienne Lefebvre. 2008. Fast un-folding of communities in large networks. Jour-nal of statistical mechanics: theory and experiment, 2008(10):P10008.
Milan Bouchet-Valat, 2014. SnowballC: Snowball stemmers based on the C libstemmer UTF-8 library. R package version 0.5.1.
Adrien Bougouin, Florian Boudin, and B´eatrice Daille. 2013. Topicrank: Graph-based topic ranking for keyphrase extraction. In International Joint Con-ference on Natural Language Processing (IJCNLP), pages 543–551.
Winston Chang, Joe Cheng, JJ Allaire, Yihui Xie, and Jonathan McPherson, 2015. shiny: Web Application Framework for R. R package version 0.12.2. Aaron Clauset, Mark EJ Newman, and Cristopher
Moore. 2004. Finding community structure in very large networks.Physical review E, 70(6):066111. Jonathan Cohen. 2008. Trusses: Cohesive
sub-graphs for social network analysis. National Secu-rity Agency Technical Report, page 16.
Gabor Csardi and Tamas Nepusz. 2006. The igraph software package for complex network research. In-terJournal, Complex Systems:1695.
G¨unes Erkan and Dragomir R Radev. 2004. Lexrank: Graph-based lexical centrality as salience in text summarization. Journal of Artificial Intelligence Research, pages 457–479.
Santo Fortunato. 2010. Community detection in graphs.Physics reports, 486(3):75–174.
Christos Giatsidis, Dimitrios M Thilikos, and Michalis Vazirgiannis. 2011. D-cores: Measuring collabo-ration of directed graphs based on degeneracy. In Data Mining (ICDM), 2011 IEEE 11th International Conference on, pages 201–210. IEEE.
Maria Grineva, Maxim Grinev, and Dmitry Lizorkin. 2009. Extracting key terms from noisy and multi-theme documents. InProceedings of the 18th inter-national conference on World wide web, pages 661– 670. ACM.
Kurt Hornik, 2015.openNLP: Apache OpenNLP Tools Interface. R package version 0.2-5.
Maksim Kitsak, Lazaros K Gallos, Shlomo Havlin, Fredrik Liljeros, Lev Muchnik, H Eugene Stanley,
and Hern´an A Makse. 2010. Identification of in-fluential spreaders in complex networks. Nature physics, 6(11):888–893.
R Duncan Luce and Albert D Perry. 1949. A method of matrix analysis of group structure. Psychome-trika, 14(2):95–116.
Fragkiskos D Malliaros and Konstantinos Skianis. 2015. Graph-based term weighting for text catego-rization. InProceedings of the 2015 IEEE/ACM In-ternational Conference on Advances in Social Net-works Analysis and Mining 2015, pages 1473–1479. ACM.
Fragkiskos D Malliaros, Maria-Evgenia G Rossi, and Michalis Vazirgiannis. 2016. Locating influen-tial nodes in complex networks. Scientific reports, 6:19307.
Rada Mihalcea and Paul Tarau. 2004. Textrank: Bringing order into texts. Association for Compu-tational Linguistics.
Mark EJ Newman and Michelle Girvan. 2004. Find-ing and evaluatFind-ing community structure in networks. Physical review E, 69(2):026113.
Pascal Pons and Matthieu Latapy. 2005. Computing communities in large networks using random walks. InComputer and Information Sciences-ISCIS 2005, pages 284–293. Springer.
R Core Team, 2015. R: A Language and Environment for Statistical Computing. R Foundation for Statis-tical Computing, Vienna, Austria.
Martin Rosvall and Carl T Bergstrom. 2008. Maps of random walks on complex networks reveal commu-nity structure. Proceedings of the National Academy of Sciences, 105(4):1118–1123.
Franc¸ois Rousseau and Michalis Vazirgiannis. 2013. Graph-of-word and tw-idf: new approach to ad hoc ir. In Proceedings of the 22nd ACM international conference on Conference on information & knowl-edge management, pages 59–68. ACM.
Franc¸ois Rousseau and Michalis Vazirgiannis. 2015. Main core retention on graph-of-words for single-document keyword extraction. In Advances in In-formation Retrieval, pages 382–393. Springer. Franc¸ois Rousseau, Emmanouil Kiagias, and Michalis
Vazirgiannis. 2015. Text categorization as a graph classification problem. In ACL, volume 15, page 107.
Stephen B Seidman. 1983. Network structure and min-imum degree. Social networks, 5(3):269–287. Jia Wang and James Cheng. 2012. Truss
decomposi-tion in massive networks. Proceedings of the VLDB Endowment, 5(9):812–823.