1372
Automatic Metric Validation for Grammatical Error Correction
Leshem Choshen1 and Omri Abend1,2
1School of Computer Science and Engineering,2Department of Cognitive Sciences
The Hebrew University of Jerusalem
[email protected], [email protected]
Abstract
Metric validation in Grammatical Error Correction (GEC) is currently done by observing the correlation between hu-man and metric-induced rankings. How-ever, such correlation studies are costly, methodologically troublesome, and suffer from low inter-rater agreement. We pro-pose MAEGE, an automatic methodology for GEC metric validation, that overcomes many of the difficulties with existing prac-tices. Experiments with MAEGE shed a new light on metric quality, showing for example that the standardM2metric fares poorly on corpus-level ranking. Moreover, we useMAEGEto perform a detailed anal-ysis of metric behavior, showing that cor-recting some types of errors is consistently penalized by existing metrics.
1 Introduction
Much recent effort has been devoted to auto-matic evaluation, both within GEC (Napoles et al.,
2015;Felice and Briscoe, 2015;Ng et al., 2014;
Dahlmeier and Ng,2012, see §2), and more gen-erally in text-to-text generation tasks. Within Ma-chine Translation (MT), an annual shared task is devoted to automatic metric development, accom-panied by an extensive analysis of metric behav-ior (Bojar et al., 2017). Metric validation is also raising interest in GEC, with several recent works on the subject (Grundkiewicz et al.,2015;Napoles et al.,2015,2016b;Sakaguchi et al.,2016), all us-ing correlation with human rankus-ings (henceforth, CHR) as their methodology.
Human rankings are often considered as ground truth in text-to-text generation, but using them re-liably can be challenging. Other than the costs of compiling a sizable validation set, human
rank-ings are known to yield poor inter-rater agree-ment in MT (Bojar et al.,2011;Lopez,2012; Gra-ham et al., 2012), and to introduce a number of methodological problems that are difficult to over-come, notably the treatment of ties in the rankings and uncomparable sentences (see §3). These dif-ficulties have motivated several proposals to alter the MT metric validation protocol (Koehn,2012;
Dras, 2015), leading to a recent abandoning of evaluation by human rankings due to its unreli-ability (Graham et al., 2015; Bojar et al., 2016). These conclusions have not yet been implemented in GEC, despite their relevance. In §3 we show that human rankings in GEC also suffer from low inter-rater agreement, motivating the development of alternative methodologies.
The main contribution of this paper is an auto-matic methodology for metric validation in GEC calledMAEGE(Methodology for Automatic Eval-uation of GEC EvalEval-uation), which addresses these difficulties. MAEGE requires no human rankings, and instead uses a corpus with gold standard GEC annotation to generate lattices of corrections with similar meanings but varying degrees of grammat-icality. For each such lattice,MAEGEgenerates a partial order of correction quality, a quality score for each correction, and the number and types of edits required to fully correct each. It then com-putes the correlation of the induced partial order with the metric-induced rankings.
MAEGE addresses many of the problems with existing methodology:
• CHR uses system outputs to obtain human rankings, which may be misleading, as sys-tems may share similar biases, thus neglect-ing to evaluate some types of valid correc-tions (§7). MAEGE addresses this issue by systematically traversing an inclusive space of corrections.
• The difficulty in handling ties is addressed by only evaluating correction pairs where one contains a sub-set of the errors of the other, and is therefore clearly better.
• MAEGE uses established statistical tests for determining the significance of its results, thereby avoiding ad-hoc methodologies used in CHR to tackle potential biases in human rankings (§5, §6).
In experiments on the standard NUCLE test set (Dahlmeier et al.,2013), we find thatMAEGEoften disagrees with CHR as to the quality of existing metrics. For example, we find that the standard GEC metric, M2, is a poor predictor of corpus-level ranking, but a good predictor of sentence-level pair-wise rankings. The best predictor of corpus-level quality by MAEGE is the reference-less LT metric (Miłkowski, 2010; Napoles et al.,
2016b), while of the reference-based metrics, GLEU (Napoles et al.,2015) fares best.
In addition to measuring metric reliability, MAEGE can also be used to analyze the sensitivi-ties of the metrics to corrections of different types, which to our knowledge is a novel contribution of this work. Specifically, we find that not only are valid edits of some error types better rewarded than others, but that correcting certain error types is consistently penalized by existing metrics (Sec-tion7). The importance of interpretability and de-tail in evaluation practices (as opposed to just pro-viding bottom-line figures), has also been stressed in MT evaluation (e.g.,Birch et al.,2016).
2 Examined Metrics
We turn to presenting the metrics we experiment with. The standard practice in GEC evaluation is to define differences between the source and a cor-rection (or a reference) as a set of edits (Dale et al.,
2012). An edit is a contiguous span of tokens to be edited, a substitute string, and the corrected error type. For example: “I want book” might have an edit (2-3, “a book”, ArtOrDet); applying the edit
results in “I want a book”. Edits are defined (by the annotation guidelines) to be maximally inde-pendent, so that each edit can be applied indepen-dently of the others. We denote the examined set of metrics with METRICS.
BLEU. BLEU (Papineni et al., 2002) is a reference-based metric that averages the output-reference n-gram overlap precision values over different ns. While commonly used in MT and other text generation tasks (Sennrich et al.,2017;
Krishna et al.,2017;Yu et al., 2017), BLEU was shown to be a problematic metric in monolingual translation tasks, in which much of the source sen-tence should remain unchanged (Xu et al.,2016). We use the NLTK implementation of BLEU, using smoothing method 3 byChen and Cherry(2014).
GLEU. GLEU (Napoles et al., 2015) is a reference-based GEC metric inspired by BLEU. Recently, it was updated to better address multi-ple references (Napoles et al.,2016a). GLEU re-wards n-gram overlap of the correction with the reference and penalizes unchangedn-grams in the correction that are changed in the reference.
iBLEU. iBLEU (Sun and Zhou, 2012) was in-troduced to monolingual translation in order to balance BLEU, by averaging it with the BLEU score of the source and the output. This yields a metric that rewards similarity to the source, and not only overlap with the reference:
iBLEU(S, R, O) =αBLEU(O, R)−(1−α)BLEU(O, S)
We setα= 0.8as suggested by Sun and Zhou.
F-Score computes the overlap of edits to the source in the reference, and in the output. As system edits can be constructed in multiple ways, the standardM2scorer (Dahlmeier and Ng,2012) computes the set of edits that yields the maximum
F-score. AsM2requires edits from the source to
the reference, and asMAEGEgenerates new source sentences, we use an established protocol to auto-matically construct edits from pairs of strings ( Fe-lice et al.,2016;Bryant et al.,2017). The protocol was shown to produce similarM2scores to those produced with manual edits. Following common practice, we use the Precision-orientedF0.5.
SARI averages three scores, measuring the ex-tent to which n-grams are correctly added to the source, deleted from it and retained in it. Where multiple references are present, SARI’s score is determined not as the maximum single-reference score, but some averaging over them. As this may lead to an unintuitive case, where a correction which is identical to the output gets a score of less than 1, we experiment with an additional metric, MAX-SARI, which coincides with SARI for a sin-gle reference, and computes the maximum sinsin-gle- single-reference SARI score for multiple-single-references.
Levenshtein Distance. We use the Levenshtein distance (Kruskal and Sankoff, 1983), i.e., the number of character edits needed to convert one string to another, between the correction and its closest reference (M inLDO→R). To enrich the discussion, we also report results with a measure of conservatism, LDS→O, i.e., the Levenshtein
distance between the correction and the source. Both distances are normalized by the number of characters in the second string (R, Orespectively). In order to convert these distance measures into measures of similarity, we report1−LDlen(c(1c,c1)2).
Grammaticality is a reference-less metric, which uses grammatical error detection tools to assess the grammaticality of GEC system outputs. We use LT (Miłkowski,2010), the best performing non-proprietary grammaticality metric (Napoles et al., 2016b). The detection tool at the base of LT can be much improved. Indeed,Napoles et al.
(2016b) reported that the proprietary tool they used detected 15 times more errors than LT. A sentence’s score is defined to be1− ##tokenserrors. See (Asano et al., 2017;Choshen and Abend,2018b) for additional reference-less measures, published concurrently with this work.
I-Measure. I-Measure (Felice and Briscoe,
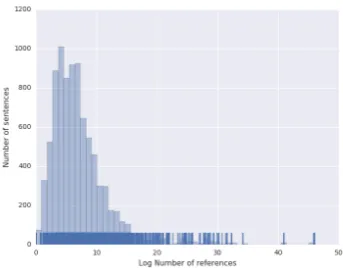
[image:3.595.314.486.73.207.2]2015) is a weighted accuracy metric over tokens. I-measure rank determines whether a correction is better than the source and to what extent. Unlike in this paper, I-measure assumes that every pair of intersecting edits (i.e., edits whose spans of tokens overlap) are alternating, and that non-intersecting edits are independent. Consequently, where multi-ple references are present, it extends the set of ref-erences, by generating every possible combination of independent edits. As the number of combina-tions is generally exponential in the number of ref-erences, the procedure can be severely inefficient.
Figure 1: Histogram and rug plot of the log number of ref-erences under I-measure assumptions, i.e. overlapping edits alternate as valid corrections of the same error. There are bil-lions of ways to combine 8 references on average.
Indeed, a sentence in the test set has 3.5 billion references on average, where the median is 512
(See Figure1). I-measure can also be run without generating new references, but despite paralleliza-tion efforts, this version did not terminate after 140 CPU days, while the cumulative CPU time of the rest of the metrics was less than 1.5 days.
3 Human Ranking Experiments
Correlation with human rankings (CHR) is the standard methodology for assessing the validity of GEC metrics. While informative, human rank-ings are costly to produce, present low inter-rater agreement (shown for MT evaluation in (Bojar et al.,2011;Dras,2015)), and introduce method-ological difficulties that are hard to overcome. We begin by showing that existing sets of human rank-ings produce inconsistent results with respect to the quality of different metrics, and proceed by proposing an improved protocol for computing this correlation in the future.
There are two existing sets of human rankings for GEC that were compiled concurrently: GJG15 by Grundkiewicz et al. (2015), and NSPT15 by
Napoles et al. (2015). Both sets are based on system outputs from the CoNLL 2014 (Ng et al., 2014) shared task, using sentences from the NUCLE test set. We compute CHR against each. System-level correlations are computed by TrueSkill (Sakaguchi et al., 2014), which adopts its methodology from MT.1
Table 1 shows CHR with Spearman ρ (Pear-son r shows similar trends). Results on the two datasets diverge considerably, despite their use of the same systems and corpus (albeit a different sub-set thereof). For example, BLEU receives a high positive correlation on GJG15, but a nega-tive one on NSPT15; GLEU receives a correlation of 0.51 against GJG15 and 0.76 against NSPT15; and M2 ranges between 0.4 (GJG15) and 0.7 (NSPT15). In fact, this variance is already appar-ent in the published correlations of GLEU, e.g.,
Napoles et al.(2015) reported aρof 0.56 against NSPT15 andNapoles et al. (2016b) reported a ρ
of 0.85 against GJG15.2 This variance in the met-rics’ scores is an example of the low agreement be-tween human rankings, echoing similar findings in MT (Bojar et al.,2011;Lopez,2012;Dras,2015). Another source of inconsistency in CHR is that the rankings are relative and sampled, so datasets rank different sets of outputs (Lopez, 2012). For example, if a system is judged against the best sys-tems more often then others, it may unjustly re-ceive a lower score. TrueSkill is the best known practice to tackle such issues (Bojar et al.,2014), but it produces a probabilistic corpus-level score, which can vary between runs (Sakaguchi et al.,
2016).3 This makes CHR more difficult to inter-pret, compared to classic correlation coefficients.
We conclude by proposing a practice for report-ing CHR in future work. First, we combine both sets of human judgments to arrive at the statis-tically most powerful test. Second, we compute the metrics’ corpus-level rankings according to the same subset of sentences used for human rankings. The current practice of allowing metrics to rank systems based on their output on the entire CoNLL test set (while human rankings are only collected for a sub-set thereof), may bias the results due to potential non-uniform system performance on the test set. We report CHR according to the proposed protocol in Table1(left column).
4 Constructing Lattices of Corrections
In the following sections we presentMAEGE an al-ternative methodology to CHR, which uses human corrections to induce more reliable and scalable rankings to compare metrics against. We begin our presentation by detailing the method MAEGE
2
The difference between our results and previously re-ported ones is probably due to a recent update in GLEU to better tackles multiple references (Napoles et al.,2016a).
3The standard deviation of the results is about 0.02.
Combined GJG15 NSPT15
ρ P-val ρ Rank ρ Rank
GLEU 0.771 0.001 0.512 1 0.758 1
LT 0.692 0.006 0.358 4 0.615 3
M2 0.626 0.017 0.398 3 0.703 2
SARI 0.596 0.025 0.323 6 0.599 4
MAX-SARI 0.552 0.041 0.292 7 0.577 5 M inLDO→R 0.191 0.513 0.350 5 -0.187 7
BLEU 0.143 0.626 0.455 2 -0.126 6
[image:4.595.308.526.72.181.2]iBLEU -0.059 0.840 0.226 8 -0.462 8 LDS→O -0.481 0.081 -0.178 -0.505
Table 1: Metrics correlation with human judgments. The
Combinedcolumn presents the Spearman correlation coef-ficient (ρ) according to the combined set of human rank-ings, with its associated P-value. The GJG15 and NSPT15 columns present the Spearman correlation according to the two sets of human rankings, as well as the rank of the metric according to this correlation. Measures are ordered by their rank in the combined human judgments. The discrepancy between theρvalues obtained against GJG15 and NSPT15 demonstrate low inter-rater agreement in human rankings.
R(1)1 · · · R(1)k
O1
R1(n) R(kn)
· · ·
· · ·
On
Figure 2: An illustration of the generated corrections lattices. TheOis are the original sentences, directed edges represent
an application of an edit andR(ji)is thej-th perfect correction ofOi(i.e., the perfect correction that result from applying all
the edits of thej-th annotation ofOi).
uses to generate source-correction pairs and a par-tial order between them. MAEGEoperates by us-ing a corpus with gold annotation, given as edits, to generate lattices of corrections, each defined by a sub-set of the edits. Within the lattice, every pair of sentences can be regarded as a potential source and a potential output. We create sentence chains, in an increasing order of quality, taking a source sentence and applying edits in some order one af-ter the other (see Figure2and3).
Formally, for each sentencesin the corpus and each annotation a, we have a set of typed edits
edits(s, a) = {e(1)s,a, . . . , e(s,ans,a)}of sizens,a. We call2edits(s,a)thecorrections lattice, and denote it withEs,a. We call,s, the correction correspond-ing to ∅ the original. We define a partial order relation between x, y ∈ Es,a such thatx < y if
x ⊂ y. This order relation is assumed to be the gold standard ranking between the corrections.
[image:4.595.314.519.305.382.2]Social media makes our life patten so fast and left us less time to think about our life.
Social media makes our life patten so fast andleaveus less time to think about our life.
Social mediamakeour life patten so fast and leave us less time to think about our life.
Social media make ourpace of lifeso fast and leave us less time to think about our life.
left leave makes make
[image:5.595.77.253.300.437.2]life patten pace of life
Figure 3: An example chain from a corrections lattice – each sentence is the result of applying a single edit to the sentence below it. The top sentence is a perfect correction, while the bottom is the original.
Figure 4: A scatter plot of the corpus-level correlation of metrics according to the different methodologies. The x-axis corresponds to the correlation according to human rankings (Combinedsetting), and the y-axis corresponds to the correla-tion according toMAEGE. While some get similar correlation (e.g., GLEU), other metrics change drastically (e.g., SARI).
references, produced byBryant and Ng(2015), are used as references for the reference-based metrics. Denote the set of references forswithRs.
Sentences which require no correction accord-ing to at least one of the two annotations are dis-carded. In 26 cases where two edit spans intersect in the same annotation (out of a total of about 40K edits), the edits are manually merged or split.
5 Corpus-level Analysis
We conduct a corpus-level analysis, namely test-ing the ability of metrics to determine which cor-pus of corrections is of better quality. In practice, this procedure is used to rank systems based on their outputs on the test corpus.
In order to compile corpora corresponding to systems of different quality levels, we define
sev-eral corpus models, each applying a different ex-pected number of edits to the original. Models are denoted with the expected number of edits they apply to the original which is a positive number
M ∈R+. Given a corpus modelM, we generate
a corpus of corrections by traversing the original sentences, and for each sentencesuniformly sam-ple an annotationa(i.e., a set of edits that results in a perfect correction), and the number of edits applied nedits, which is sampled from a clipped binomial probability with mean M and variance 0.9. Givennedits, we uniformly sample from the latticeEs,aa sub-set of edits of sizenedits, and ap-ply this set of edits tos. The corpus ofM = 0is the set of originals.
The corpus of source sentences, against which all other corpora are compared, is sampled by traversing the original sentences, and for each sen-tence s, uniformly sample an annotation a, and givens, a, uniformly sample a sentence fromEs,a. Given a metric m ∈ METRICS, we compute its score for each sampled corpus. Where corpus-level scores are not defined by the metrics them-selves, we use the average sentence score instead. We compare the rankings induced by the scores of
m and the ranking of systems according to their corpus model (i.e., systems that have a higherM
should be ranked higher), and report the correla-tion between these rankings.
5.1 Experiments
Setup. For each model, we sample one correc-tion per NUCLE sentence, noting that it is possi-ble to reduce the variance of the metrics’ corpus-level scores by sampling more. Corpus models of integer values between 0 and 10 are taken. We re-port Spearmanρ, commonly used for system-level rankings (Bojar et al.,2017).4
Results. Results, presented in Table2(left part), shows that LT correlates best with the rankings in-duced by MAEGE, where GLEU is second. M2’s correlation is only 0.06. We note that the LT re-quires a complementary metric to penalize gram-matical outputs that diverge in meaning from the source (Napoles et al.,2016b). See §8.
Comparing the metrics’ quality in corpus-level evaluation with their quality according to CHR (§3), we find they are often at odds. Figure4plots the Spearman correlation of the different metrics according to the two validation methodologies,
Corpus-level Sentence-level
ρ P-val r P-val τ P-val iBLEU 0.418 0.200 0.230 † 0.050 †
M2 0.060 0.853 -0.025 0.024 0.213 †
LT 0.973 † 0.167 † 0.222 †
BLEU 0.564 0.071 0.214 † 0.111 †
M inLDO→R -0.867 † 0.011 0.327 -0.183 †
GLEU 0.736 0.001 0.189 † -0.028 † MAX-SARI -0.809 0.003 0.027 0.015 -0.070 † SARI -0.545 0.080 0.061 † -0.039 †
[image:6.595.173.427.72.202.2]LDS→O -0.118 0.729 0.109 † 0.094 †
Table 2: Corpus-level Spearmanρ, sentence-level Pearsonrand Kendallτwith the metrics (left).†represents P-value<0.001. LT correlates best at the corpus level and has the highest sentence-levelτ, while iBLEU has the highest sentence-levelr.
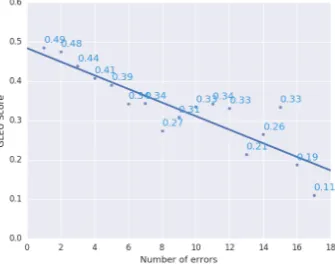
Figure 5: Average GLEU score of originals (y-axis), plotted against the number of errors they contain (x-axis). Their sub-stantial correlation indicates that GLEU is globally reliable.
showing correlations are slightly correlated, but disagreements as to metric quality are frequent and substantial (e.g., with iBLEU or SARI).
6 Sentence-level Analysis
We proceed by presenting a method for assessing the correlation between metric-induced scores of corrections of the same sentence, and the scores given to these corrections by MAEGE. Given a sentencesand an annotationa, we sample a ran-dom permutation over the edits inedits(s, a). We denote the permutation with σ ∈ Sns,a, where
Sns,ais the permutation group over{1,· · ·, ns,a}.
Givenσ, we define a monotonic chain inEi,jas:
chain(s, a, σ) =∅<{e(s,aσ(1))}<{e (σ(1)) s,a , e
(σ(2)) s,a }<
. . . < edits(s, a)
For each chain, we uniformly sample one of its el-ements, mark it as the source, and denote it with
src. In order to generate a set of chains,MAEGE
traverses the original sentences and annotations, and for each sentence-annotation pair, uniformly samplesnchchains without repetition. It then uni-formly samples a source sentence from each chain. If the number of chains inEs,ais smaller thannch, MAEGEselects all the chains.
Given a metric m ∈ METRICS, we compute its score for every correction in each sampled chain against the sampled source and available ref-erences. We compute the sentence-level correla-tion of the rankings induced by the scores of m
and the rankings induced by <. For computing rank correlation (such as Spearman ρ or Kendall
τ), such a relative ranking is sufficient.
We report Kendallτ, which is only sensitive to the relative ranking of correction pairs within the same chain. Kendall is minimalistic in its assump-tions, as it does not require numerical scores, but only assuming that<is well-motivated, i.e., that applying a set of valid edits is better in quality than applying only a subset of it.
As<is a partial order, and as Kendallτ is stan-dardly defined over total orders, some modifica-tion is required. τ is a function of the number of compared pairs and of discongruent pairs (ordered differently in the compared rankings):
τ = 1− 2|discongruent pairs| |all pairs| .
To compute these quantities, we extract all unique pairs of corrections that can be compared with< (i.e., one applies a sub-set of the edits of the other), and count the number of discongruent ones between the metric’s ranking and<. Signif-icance is modified accordingly.5 Spearman ρ is
5Code can be found in https://github.com/
[image:6.595.83.251.264.396.2]less applicable in this setting, as it compares total orders whereas here we compare partial orders.
To compute linear correlation with Pearson r, we make the simplifying assumption that all edits contribute equally to the overall quality. Specifi-cally, we assume that a perfect correction (i.e., the top of a chain) receives a score of 1. Each original sentences(the bottom of a chain), for which there exists annotationsa1, . . . , an, receives a score of
1−min
i
|edits(s, ai)|
|tokens(s)|.
The scores of partial (non-perfect) corrections in each chain are linearly spaced between the score of the perfect correction and that of the original. This scoring system is well-defined, as a partial correction receives the same score according to all chains it is in, as all paths between a partial cor-rection and the original have the same length.
6.1 Experiments
Setup. We experiment with nch = 1, yielding 7936 sentences in 1312 chains (same as the num-ber of original sentences in the NUCLE test set). We report the Pearson correlation over the scores of all sentences in all chains (r), and Kendall τ
over all pairs of corrections within the same chain.
Results. Results are presented in Table 2(right part). No metric scores very high, neither ac-cording to Pearsonr nor according to Kendallτ. iBLEU correlates best with<according tor, ob-taining a correlation of 0.23, whereas LT fares best according toτ, obtaining 0.222.
Results show a discrepancy between the low corpus-level and sentence-level r correlations of
M2 and its high sentence-level τ. It seems that
although M2 orders pairs of corrections well, its scores are not a linear function ofMAEGE’s scores. This may be due toM2’s assignment of the
min-imal possible score to the source, regardless of its quality. M2 thus seems to predict well the rela-tive quality of corrections of the same sentence, but to be less effective in yielding a globally co-herent score (cf.Felice and Briscoe(2015)).
GLEU shows the inverse behaviour, failing to correctly order pairs of corrections of the same sentence, while managing to produce globally co-herent scores. We test this hypothesis by comput-ing the average difference in GLEU score between all pairs in the sampled chains, and find it to be slightly negative (-0.00025), which is in line with
GLEU’s small negativeτ. On the other hand, plot-ting the GLEU scores of the originals grouped by the number of errors they contain, we find they correlate well (Figure 5), indicating that GLEU performs well in comparing the quality of correc-tions of different sentences. Four sentences with considerably more errors than the others were con-sidered outliers and removed.
7 Metric Sensitivity by Error Type
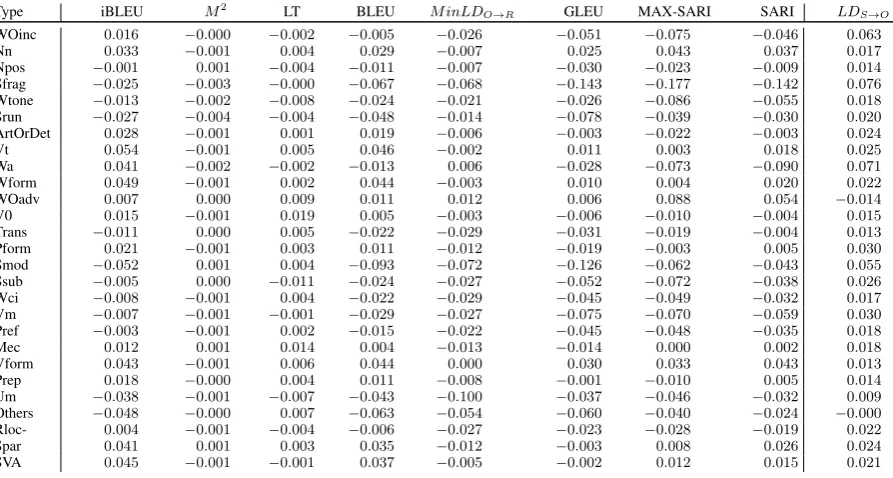
MAEGE’s lattice can be used to analyze how the examined metrics reward corrections of errors of different types. For each edit type t, we denote withStthe set of correction pairs from the lattice that only differ in an edit of typet. For each such pair(c, c0)and for each metricm, we compute the difference in the score assigned bymtocandc0. The average difference is denoted with∆m,t.
∆m,t=
1 |St|
X
(c,c0)∈S
t
m(src, c, R)−m(src, c0, R)
R is the corresponding reference set. A neg-ative (positive) ∆m,t indicates that m penalizes (awards) valid corrections of typet.
7.1 Experiments
Setup. We sample chains using the same sam-pling method as in §6, and uniformly sample a source from each chain. For each edit type t, we detect all pairs of corrections in the sampled chains that only differ in an edit of typet, and use them to compute∆m,t. We use the set of 27 edit types given in the NUCLE corpus.
Results. Table 3 presents the results, showing that under all metrics, some edits types are penal-ized and others rewarded. iBLEU and LT penalize the least edit types, and GLEU penalizes the most, providing another perspective on GLEU’s negative Kendallτ (§6). Certain types are penalized by al-most all metrics. One such type is Vm, wrong verb modality (e.g., “as they [∅ ; may] not want to know”). Another such type is Npos, a problem in noun possessive (e.g., “their [facebook’s; Face-book] page”). Other types, such as Mec, mechani-cal (e.g., “[real-life;real life]”), and V0, missing verb (e.g., “’Privacy’, this is the word that [∅;is] popular”), are often rewarded by the metrics.
Type iBLEU M2 LT BLEU M inLD
O→R GLEU MAX-SARI SARI LDS→O
WOinc 0.016 −0.000 −0.002 −0.005 −0.026 −0.051 −0.075 −0.046 0.063
Nn 0.033 −0.001 0.004 0.029 −0.007 0.025 0.043 0.037 0.017
Npos −0.001 0.001 −0.004 −0.011 −0.007 −0.030 −0.023 −0.009 0.014
Sfrag −0.025 −0.003 −0.000 −0.067 −0.068 −0.143 −0.177 −0.142 0.076
Wtone −0.013 −0.002 −0.008 −0.024 −0.021 −0.026 −0.086 −0.055 0.018
Srun −0.027 −0.004 −0.004 −0.048 −0.014 −0.078 −0.039 −0.030 0.020
ArtOrDet 0.028 −0.001 0.001 0.019 −0.006 −0.003 −0.022 −0.003 0.024
Vt 0.054 −0.001 0.005 0.046 −0.002 0.011 0.003 0.018 0.025
Wa 0.041 −0.002 −0.002 −0.013 0.006 −0.028 −0.073 −0.090 0.071
Wform 0.049 −0.001 0.002 0.044 −0.003 0.010 0.004 0.020 0.022
WOadv 0.007 0.000 0.009 0.011 0.012 0.006 0.088 0.054 −0.014
V0 0.015 −0.001 0.019 0.005 −0.003 −0.006 −0.010 −0.004 0.015
Trans −0.011 0.000 0.005 −0.022 −0.029 −0.031 −0.019 −0.004 0.013
Pform 0.021 −0.001 0.003 0.011 −0.012 −0.019 −0.003 0.005 0.030
Smod −0.052 0.001 0.004 −0.093 −0.072 −0.126 −0.062 −0.043 0.055
Ssub −0.005 0.000 −0.011 −0.024 −0.027 −0.052 −0.072 −0.038 0.026
Wci −0.008 −0.001 0.004 −0.022 −0.029 −0.045 −0.049 −0.032 0.017
Vm −0.007 −0.001 −0.001 −0.029 −0.027 −0.075 −0.070 −0.059 0.030
Pref −0.003 −0.001 0.002 −0.015 −0.022 −0.045 −0.048 −0.035 0.018
Mec 0.012 0.001 0.014 0.004 −0.013 −0.014 0.000 0.002 0.018
Vform 0.043 −0.001 0.006 0.044 0.000 0.030 0.033 0.043 0.013
Prep 0.018 −0.000 0.004 0.011 −0.008 −0.001 −0.010 0.005 0.014
Um −0.038 −0.001 −0.007 −0.043 −0.100 −0.037 −0.046 −0.032 0.009
Others −0.048 −0.000 0.007 −0.063 −0.054 −0.060 −0.040 −0.024 −0.000
Rloc- 0.004 −0.001 −0.004 −0.006 −0.027 −0.023 −0.028 −0.019 0.022
Spar 0.041 0.001 0.003 0.035 −0.012 −0.003 0.008 0.026 0.024
[image:8.595.75.522.71.310.2]SVA 0.045 −0.001 −0.001 0.037 −0.005 −0.002 0.012 0.015 0.021
Table 3: Average change in metric score by metric and edit types (∆m,t; see text). Rows correspond to edit types (abbreviations
inDahlmeier et al.(2013)); columns correspond to metrics. Some edit types are consistently penalized.
types are under-represented in available reference sets. Automatic evaluation of systems that per-form these edit types may, therefore, be unreliable. Moreover, not addressing these biases in the met-rics may hinder progress in GEC. Indeed,M2and GLEU, two of the most commonly used metrics, only award a small sub-set of edit types, thus of-fering no incentive for systems to improve perfor-mance on such types.6
8 Discussion
We revisit the argument that using system outputs to perform metric validation poses a methodolog-ical difficulty. Indeed, as GEC systems are de-veloped, trained and tested using available met-rics, and as metrics tend to reward some correc-tion types and penalize others (§7), it is possible that GEC development adjusts to the metrics, and neglects some error types. Resulting tendencies in GEC systems would then yield biased sets of outputs for human rankings, which in turn would result in biases in the validation process.
To make this concrete, GEC systems are often precision-oriented: trained to prefer not to cor-rect than to invalidly corcor-rect. Indeed,Choshen and
6LD
S→O tends to award valid corrections of almost all
types. As source sentences are randomized across chains, this indicates that on average, corrections with more applied ed-its tend to be more similar to comparable corrections on the lattice. This is also reflected by the slightly positive sentence-level correlation ofLDS→O(§6).
Abend(2018a) show that modern systems tend to be highly conservative, often performing an order of magnitude fewer changes to the source than ref-erences do. Validating metrics on their ability to rank conservative system outputs (as is de facto the common practice) may produce a different picture of metric quality than when considering a more in-clusive set of corrections.
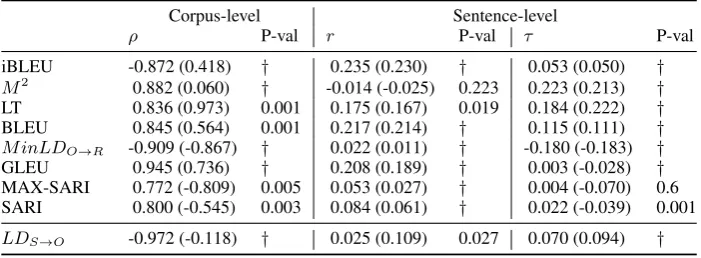
We use MAEGE to mimic a setting of ranking against precision-oriented outputs. To do so, we perform corpus-level and sentence-level analyses, but instead of randomly sampling a source, we in-variably take the original sentence as the source. We thereby create a setting where all edits applied are valid (but not all valid edits are applied).
Corpus-level Sentence-level
ρ P-val r P-val τ P-val
iBLEU -0.872 (0.418) † 0.235 (0.230) † 0.053 (0.050) †
M2 0.882 (0.060) † -0.014 (-0.025) 0.223 0.223 (0.213) †
LT 0.836 (0.973) 0.001 0.175 (0.167) 0.019 0.184 (0.222) † BLEU 0.845 (0.564) 0.001 0.217 (0.214) † 0.115 (0.111) †
M inLDO→R -0.909 (-0.867) † 0.022 (0.011) † -0.180 (-0.183) †
GLEU 0.945 (0.736) † 0.208 (0.189) † 0.003 (-0.028) † MAX-SARI 0.772 (-0.809) 0.005 0.053 (0.027) † 0.004 (-0.070) 0.6 SARI 0.800 (-0.545) 0.003 0.084 (0.061) † 0.022 (-0.039) 0.001
[image:9.595.124.475.73.202.2]LDS→O -0.972 (-0.118) † 0.025 (0.109) 0.027 0.070 (0.094) †
Table 4: Corpus-level Spearmanρ, sentence-level Pearsonr and Kendallτ correlations using origin as the source with the various metrics (left). Correlations using a random source are found in parenthesis.†representsP−value <0.001. LT is the best corpus correlated, and has the bestτwhile iBLEU has the bestr
from the latter’s use of precision-oriented outputs.
Drawbacks. Like any methodologyMAEGEhas its simplifying assumptions and drawbacks; we wish to make them explicit. First, any biases troduced in the generation of the test corpus are in-herited byMAEGE(e.g., that edits are contiguous and independent of each other). Second, MAEGE does not include errors that a human will not per-form but machines might, e.g., significantly al-tering the meaning of the source. This partially explains why LT, which measures grammaticality but not meaning preservation, excels in our ex-periments. Third, MAEGE’s scoring system (§6) assumes that all errors damage the score equally. While this assumption is made by GEC metrics, we believe it should be refined in future work by collecting user information.
9 Conclusion
In this paper, we show how to leverage existing annotation in GEC for performing validation re-liably. We propose a new automatic methodol-ogy,MAEGE, which overcomes many of the short-comings of the existing methodology. Experi-ments with MAEGE reveal a different picture of metric quality than previously reported. Our anal-ysis suggests that differences in observed metric quality are partly due to system outputs sharing consistent tendencies, notably their tendency to under-predict corrections. As existing methodol-ogy ranks system outputs, these shared tendencies bias the validation process. The difficulties in bas-ing validation on system outputs may be applica-ble to other text-to-text generation tasks, a ques-tion we will explore in future work.
Acknowledgments
This work was supported by the Israel Science Foundation (grant No. 929/17), and by the HUJI Cyber Security Research Center in conjunction with the Israel National Cyber Bureau in the Prime Minister’s Office. We thank Joel Tetreault and Courtney Napoles for helpful feedback and inspir-ing conversations.
References
Hiroki Asano, Tomoya Mizumoto, and Kentaro Inui. 2017. Reference-based metrics can be replaced with reference-less metrics in evaluating grammat-ical error correction systems. InProceedings of the Eighth International Joint Conference on Natural Language Processing (Volume 2: Short Papers), vol-ume 2, pages 343–348.
Alexandra Birch, Omri Abend, Ondˇrej Bojar, and Barry Haddow. 2016. Hume: Human ucca-based evaluation of machine translation. InProceedings of the 2016 Conference on Empirical Methods in Nat-ural Language Processing, pages 1264–1274.
Ondrej Bojar, Christian Buck, Christian Federmann, Barry Haddow, Philipp Koehn, Johannes Leveling, Christof Monz, Pavel Pecina, Matt Post, Herve Saint-Amand, et al. 2014. Findings of the 2014 workshop on statistical machine translation. In Pro-ceedings of the ninth workshop on statistical ma-chine translation, pages 12–58.
Ondˇrej Bojar, Rajen Chatterjee, Christian Federmann, Yvette Graham, Barry Haddow, Shujian Huang, Matthias Huck, Philipp Koehn, Qun Liu, Varvara Logacheva, et al. 2017. Findings of the 2017 confer-ence on machine translation (wmt17). In Proceed-ings of the Second Conference on Machine Transla-tion, pages 169–214.
manual evaluation. In Proceedings of the Sixth Workshop on Statistical Machine Translation, pages 1–11. Association for Computational Linguistics.
Ondˇrej Bojar, Yvette Graham, Amir Kamran, and Miloš Stanojevi´c. 2016. Results of the wmt16 metrics shared task. In Proceedings of the First Conference on Machine Translation, pages 199– 231, Berlin, Germany. Association for Computa-tional Linguistics.
Christopher Bryant, Mariano Felice, and Ted Briscoe. 2017. Automatic annotation and evaluation of error types for grammatical error correction. In Proceed-ings of the 55th Annual Meeting of the Association for Computational Linguistics (Volume 1: Long Pa-pers), pages 793–805, Vancouver, Canada. Associa-tion for ComputaAssocia-tional Linguistics.
Christopher Bryant and Hwee Tou Ng. 2015. How far are we from fully automatic high quality grammati-cal error correction? InACL (1), pages 697–707.
Boxing Chen and Colin Cherry. 2014. A systematic comparison of smoothing techniques for sentence-level bleu. InProceedings of the Ninth Workshop on Statistical Machine Translation, pages 362–367.
Leshem Choshen and Omri Abend. 2018a. Inherent bi-ases in reference-based evaluation for grammatical error correction and text simplification. In Proceed-ings of the 56th Annual Meeting of the Association for Computational Linguistics (Volume 1: Long Pa-pers).
Leshem Choshen and Omri Abend. 2018b. Reference-less measure of faithfulness for grammatical error correction. InProceedings of the 2018 Conference of the North American Chapter of the Association for Computational Linguistics: Human Language Technologies.
Daniel Dahlmeier and Hwee Tou Ng. 2012. Better evaluation for grammatical error correction. In Pro-ceedings of the 2012 Conference of the North Amer-ican Chapter of the Association for Computational Linguistics: Human Language Technologies, pages 568–572. Association for Computational Linguis-tics.
Daniel Dahlmeier, Hwee Tou Ng, and Siew Mei Wu. 2013. Building a large annotated corpus of learner english: The nus corpus of learner english. In Proceedings of the Eighth Workshop on Innovative Use of NLP for Building Educational Applications, pages 22–31.
Robert Dale, Ilya Anisimoff, and George Narroway. 2012. Hoo 2012: A report on the preposition and determiner error correction shared task. In Proceed-ings of the Seventh Workshop on Building Educa-tional Applications Using NLP, pages 54–62. Asso-ciation for Computational Linguistics.
Mark Dras. 2015. Evaluating human pairwise pref-erence judgments. Computational Linguistics, 41(2):337–345.
Mariano Felice and Ted Briscoe. 2015. Towards a stan-dard evaluation method for grammatical error detec-tion and correcdetec-tion. In HLT-NAACL, pages 578– 587.
Mariano Felice, Christopher Bryant, and Ted Briscoe. 2016. Automatic extraction of learner errors in esl sentences using linguistically enhanced alignments. In Proceedings of COLING 2016, the 26th Inter-national Conference on Computational Linguistics: Technical Papers, pages 825–835, Osaka, Japan. The COLING 2016 Organizing Committee.
Yvette Graham, Timothy Baldwin, Aaron Harwood, Alistair Moffat, and Justin Zobel. 2012. Measure-ment of progress in machine translation. In Pro-ceedings of the Australasian Language Technology Association Workshop 2012, pages 70–78.
Yvette Graham, Timothy Baldwin, and Nitika Mathur. 2015. Accurate evaluation of segment-level ma-chine translation metrics. In Proceedings of the 2015 Conference of the North American Chapter of the Association for Computational Linguistics: Hu-man Language Technologies, pages 1183–1191.
Roman Grundkiewicz, Marcin Junczys-Dowmunt, Ed-ward Gillian, et al. 2015. Human evaluation of grammatical error correction systems. In EMNLP, pages 461–470.
Philipp Koehn. 2012. Simulating human judgment in machine translation evaluation campaigns. In Inter-national Workshop on Spoken Language Translation (IWSLT) 2012.
Ranjay Krishna, Yuke Zhu, Oliver Groth, Justin John-son, Kenji Hata, Joshua Kravitz, Stephanie Chen, Yannis Kalantidis, Li-Jia Li, David A Shamma, et al. 2017. Visual genome: Connecting language and vision using crowdsourced dense image anno-tations. International Journal of Computer Vision, 1(123):32–73.
Joseph B Kruskal and David Sankoff. 1983. Time Warps, String Edits, and Macromolecules: The Theory and Practice of Sequence Comparison. Addison-Wesley.
Adam Lopez. 2012. Putting human assessments of machine translation systems in order. In Proceed-ings of the Seventh Workshop on Statistical Machine Translation, pages 1–9. Association for Computa-tional Linguistics.
Marcin Miłkowski. 2010. Developing an open-source, rule-based proofreading tool. Software: Practice and Experience, 40(7):543–566.
Courtney Napoles, Keisuke Sakaguchi, Matt Post, and Joel Tetreault. 2016a. GLEU without tuning. eprint arXiv:1605.02592 [cs.CL].
Courtney Napoles, Keisuke Sakaguchi, and Joel Tetreault. 2016b. There’s no comparison: Reference-less evaluation metrics in grammati-cal error correction. In Proceedings of the 2016 Conference on Empirical Methods in Natural Lan-guage Processing, pages 2109–2115. Association for Computational Linguistics.
Hwee Tou Ng, Siew Mei Wu, Ted Briscoe, Christian Hadiwinoto, Raymond Hendy Susanto, and Christo-pher Bryant. 2014. The conll-2014 shared task on grammatical error correction. In CoNLL Shared Task, pages 1–14.
Kishore Papineni, Salim Roukos, Todd Ward, and Wei-Jing Zhu. 2002. Bleu: a method for automatic eval-uation of machine translation. In Proceedings of the 40th annual meeting on association for compu-tational linguistics, pages 311–318. Association for Computational Linguistics.
Keisuke Sakaguchi, Courtney Napoles, Matt Post, and Joel Tetreault. 2016. Reassessing the goals of matical error correction: Fluency instead of gram-maticality.Transactions of the Association for Com-putational Linguistics, 4:169–182.
Keisuke Sakaguchi, Matt Post, and Benjamin Van Durme. 2014. Efficient elicitation of annota-tions for human evaluation of machine translation. InProceedings of the Ninth Workshop on Statistical Machine Translation, pages 1–11.
Rico Sennrich, Orhan Firat, Kyunghyun Cho, Alexan-dra Birch, Barry Haddow, Julian Hitschler, Marcin Junczys-Dowmunt, Samuel Läubli, Antonio Vale-rio Miceli Barone, Jozef Mokry, et al. 2017. Nema-tus: a toolkit for neural machine translation. arXiv preprint arXiv:1703.04357.
Hong Sun and Ming Zhou. 2012. Joint learning of a dual smt system for paraphrase generation. In Pro-ceedings of the 50th Annual Meeting of the Associ-ation for ComputAssoci-ational Linguistics: Short Papers-Volume 2, pages 38–42. Association for Computa-tional Linguistics.
Wei Xu, Courtney Napoles, Ellie Pavlick, Quanze Chen, and Chris Callison-Burch. 2016. Optimizing statistical machine translation for text simplification. Transactions of the Association for Computational Linguistics, 4:401–415.