Nanotechnology14(2003) 123–127 PII: S0957-4484(03)53824-7
Frequency-dependent electrical
characteristics of DNA using molecular
dynamics simulation
Makoto Ikeda
1,3, Kazuo Nakazato
2, Hiroshi Mizuta
2,
Martin Green
1, David Hasko
1and Haroon Ahmed
11Microelectronics Research Centre, Cavendish Laboratory, University of Cambridge, Madingley Road, Cambridge CB3 0HE, UK
2Hitachi Cambridge Laboratory, Hitachi Europe Ltd., Madingley Road, Cambridge CB3 0HE, UK
E-mail: [email protected]
Received 17 September 2002, in final form 2 December 2002 Published 10 January 2003
Online at stacks.iop.org/Nano/14/123
Abstract
Research on DNA has been widely carried out as a promising material for nanoelectronics, medicine development and disease diagnosis, using experiment, simulation and theory. We have carried out molecular dynamics simulation coupled with the linear response theory, based on the
time-correlation function of an observable, in order to extract the frequency-dependent electrical characteristics of DNA. We observe a dielectric relaxation at around 50 MHz in the case of octamers-DNA, which corresponds to a delta-relaxation. We also observe dielectric relaxation in the case of mixtures of DNA, water molecules and ions, given by the superposition of the individual dielectric relaxations of the DNA and the bulk-like water, at frequencies of about 50 MHz and 10 GHz, respectively.
1. Introduction
Research on DNA has been widely carried out as a promising material for nanoelectronics, medicine development and disease diagnosis, using experiment, simulation and theory. With the completion of the human genome project, a new era of opportunity is brought to molecular biology and genetics. New detection methods for DNA are required, in order to enable devices to collect data at high throughput and in real time. For this purpose, several new techniques have been proposed, such as using cantilevers for the detection of steric forces caused by the hybridization of target DNA with probe DNA immobilized onto a surface [1–15]. For label-free detection, it is essential to know the precise electrical characteristics of DNA. Many experimental results and theoretical calculations on the conductivity of DNA have been published, showing a wide variety of behaviour, from insulating to metallic conduction. Despite this, the conductivity of DNA remains a matter for investigation [16–36].
3Address for correspondence: VLSI Design and Education Centre,University of Tokyo, 7-3-1 Hongo, Bunkyo-ku, Tokyo 113-8656, Japan.
In this paper, we describe a technique to calculate the electrical characteristics of DNA, which can be applied to label-free DNA detection. We have employed linear response theory in a molecular dynamics simulation, to extract the frequency-dependent electrical characteristics.
In the next section, we describe the linear response theory. In section 3, we describe the molecular dynamics simulation and the simulated systems. In section 4, we describe the results for the frequency-dependent electrical characteristics of DNA.
2. Linear response theory
Linear response theory defines a linear relationship between the macroscopic characteristics and the microscopic observ-ables, in quasi-equilibrated and uniform systems [37–40].
For the explanation of dielectric phenomena, linear response theory deals with the response of a macroscopic system to an applied external electric field. On the macroscopic level, linear response theory assumes a linear relationship between the applied external field E0(ω)and the ensemble
average of an observableO(ω):
200 300 400 500 600 700 800
Ti
me c
o
rr
el
ation
fu
nc
tion
(a
rb
unit
s)
Time (ps)
[image:2.595.68.266.64.236.2]2000 4000 6000
Figure 1.The simulated time-correlation functionM(0)M(t)of a DNA molecule (crosses) and linear-type (dashed line) and
exponential-type (continuous curve) approximation curves.
χO P(ω) is the complex generalized susceptibility, which describes the coupling of the observable O(t) to the polarizationP(t)of the system. According to linear response theory, the generalized susceptibility for an observableO(t)is defined as
χO P(ω)=1/3kT[O(0)M(0) −jωO(0)M(t)ω +O(0)J(t)ω]
whereM(t)=qiri(t)is the dipole moment due to charges
qi and displacement ri(t); and J(t) = qivi(t) is the ion current due to charges qi moving with velocity vi(t).
A(0)B(t)denotes a correlation function of the time-dependent quantitiesA(t)andB(t), andA(0)B(t)ωdenotes a Laplace transform of the time-correlation function. The above equations use a general observable O(t), which can be specified as the polarization of the molecules P(t) = 1/VM(t) or as the current density of the ions I(t) = 1/VJ(t), whereV is the simulation volume, giving
P(ω) =χP P(ω)E0(ω)
with
χP P(ω)=1/3V kT[M(0)M(0) −jωM(0)M(t)ω +M(0)J(t)ω]
and
I(ω) =χi P(ω)E0(ω)
with
χi P(ω)=1/3V kT[−jωJ(0)M(t)ω+J(0)J(t)ω]. The phenomenological equations of matter,P(ω)=(ε(ω)−
1)E(ω)/4π and I(ω) = σ(ω)E(ω), define the dielectric constant ε(ω)and the conductivityσ(ω). Both involve the Maxwell fieldE(ω), which is the electric field acting inside a macroscopic piece of matter. In the case of the ideal Ewald summation, where the cut-off radiusrcand decay parameterη are both infinite, the Maxwell field is equal to the externally applied electric fieldE0(ω), and the dielectric constant and
conductivity can be expressed asε(ω)=1 + 4πχP P(ω)and
σ(ω)=χi P(ω). Note that the conductivityσ(ω), in this case, is independent of the dielectric constant, represented by the susceptibilityχP P(ω).
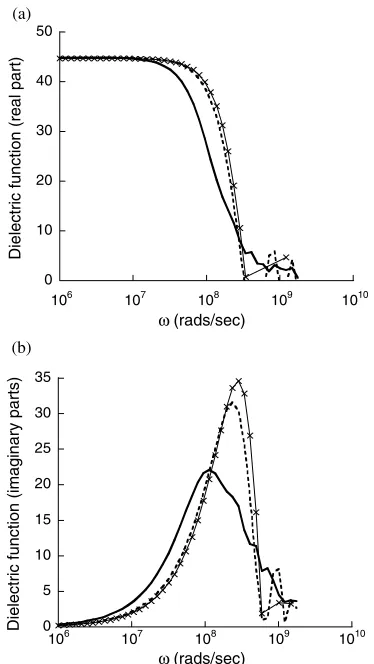
0 10 20 30 40 50
106 107 108 109 1010
0 5 10 15 20 25 30 35
106 107 108 109 1010
(a)
(b)
Dielectric function (imaginary parts)
Dielectric function (real part)
ω (rads/sec)
[image:2.595.317.504.69.401.2]ω (rads/sec)
Figure 2.The frequency-dependent dielectric function: (a) real part and (b) imaginary part and linear-type (dashed curve) and
exponential-type (continuous curve) approximation curves.
3. Molecular dynamics simulation
Molecular dynamics simulation has been widely used for studying molecular structures. In this work, we use TINKER from Washington University, which employs a smooth particle-mesh Ewald summation method.
We used octamer randomly generated ds/ss-DNA d[GTAGCAAA] in this simulation. The simulation system size corresponds to a DNA surface density of 9.6 molecules nm−2, and a few layers of water molecules occupy the gaps between adjacent DNA molecules. Each DNA backbone requires 14 Na+counter-ions, and two Na+ions with two Cl−ions corresponding to a 0.1 M saline solution, similar to many DNA buffer solutions. A summary of the simulation is listed in table 1.
4. Simulation results
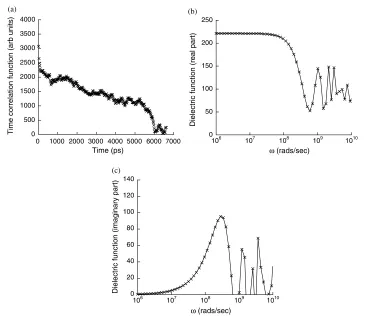
Figure 1 shows the time-correlation function of a DNA molecule. A linear-type approximation describes the behaviour well, Flin(ω) =C0l+Cl1exp(−τ1tl)+C2lt, as does an exponential-type approximation,Fexp(ω)=C0eexp(−τ1te)+
0 500 1000 1500 2000 2500 3000 3500 4000
0 1000 2000 3000 4000 5000 6000 7000
0 50 100 150 200 250
106 107 108 109 1010
0 20 40 60 80 100 120 140
106 107 108 109 1010
(c)
(a) (b)
Time correlation function (arb units)
Time (ps) ω (rads/sec)
ω (rads/sec)
Dielectric function (real part)
[image:3.595.106.485.66.382.2]Dielectric function (imaginary part)
[image:3.595.59.273.435.558.2]Figure 3.(a) The simulated time-correlation functionM(0)M(t)and (b), (c) the real and imaginary parts of the dielectric function for a mixture of DNA and water molecules.
Table 1.Simulation set-up.
Lennard-Jones 12–6 potential Force field (amber 94 parameter set)
System size 3.107×3.107×4.350 nm3 Molecules Octamer random sequence ds-DNA,
1239 water molecules, 16 Na+, 2 Cl−, total 4244 atoms
Temperature 298 K Time step 1 fs
Cut-offs Lennard-Jones, 0.9 nm; Ewald, 0.9 nm Simulation period 600 ps for equilibrium, 7.3 ns for
correlation function
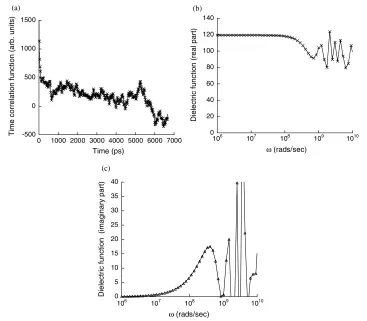
and the dielectric behaviour for a mixture of DNA and water molecules. Figure 4 shows the time-correlation function and the dielectric behaviour for water molecules only.
Figure 3 shows that the characteristic frequency of the DNA is between 18 and 27 MHz, which is consistent with the
δ-relaxation expected in the range 1 MHz–1 GHz, due to the orientational change of strongly bound water, or due to short scale relaxations of the DNA chain. On the other hand, the characteristic frequency of water molecules, as seen in figure 4, is nearly the same as that of bulk water, which means that the few layers of water molecules present still demonstrate bulklike characteristics. The characteristic frequency of the molecule mixture seems to be a superposition of those due to DNA and water individually.
It has been reported that there are at least three kinds of relaxation for DNA [41].
(1) α-relaxation. Less than a few kHz. A large dielectric increment whose characteristic frequency is dependent on the size of the DNA molecule. Relaxation seems to reflect the migrations of counter-ions along the entire length of the DNA molecule.
(2) δ-relaxation. 1 MHz–1 GHz. A smaller molecular weight independent dielectric increment. This has been attributed to orientational change of strongly bound water, or the short scale relaxations of the DNA chain.
(3) γ-relaxation. 1 GHz or above. Reorientation of dipolar water molecules.
Recently published DNA measurements using a 35-mer of poly-T and poly-G DNA in nanogap junctions demon-strate similar dielectric decay characteristics to those simulated here [42]. The characteristic frequency from these experimen-tal results differs markedly from the simulated results. Such a difference may be caused by the length and surface density of the DNA used or differences in the geometry, in the extent of the simulated region and time or in the relaxation mechanism.
5. Conclusions
-500 0 500 1000 1500
0 1000 2000 3000 4000 5000 6000 7000
0 20 40 60 80 100 120 140
106 107 108 109 1010
0 5 10 15 20 25 30 35 40
106 107 108 109 1010
(c)
(b) (a)
Time (ps) ω (rads/sec)
ω (rads/sec)
Dielectric function (imaginary part)
Dielectric function (real part)
[image:4.595.105.472.67.388.2]Time correlation function (arb. units)
Figure 4.(a) The simulated time-correlation functionM(0)M(t)and (b), (c) the real and imaginary parts of the dielectric function for water molecules only.
The simulation system in this work is not large enough to obtain precise characteristics; however, some agreement with experimental results is obtained.
References
[1] Ihara T, Maruo Y, Takenaka S and Takagi M 1996Nucl. Acids Res.244273
[2] Arlinghaus H F and Kwoka M N 1997Anal. Chem.693747 [3] Sosnowski R G, Tu E, Butler W F, O’Connell J P and
Heller M J 1997Proc. Natl Acad. Sci. USA941119 [4] Yang M, McGovern M E and Thompson M 1997Anal. Chim.
Acta346259
[5] O’Donnell M J, Tang K, Koster H, Smith C L and Cantor C R 1997Anal. Chem.692438
[6] Lang H P, Berger R, Andreoli C, Brugger J, Despont M, Vettiger P, Gerber Ch, Gimzewski J K, Ramseyer J P, Meyer E and Guntherodt H J 1998Appl. Phys. Lett.72383 [7] Cheng J, Sheldon E L, Wu L, Uribe A, Gerrue L O, Carrino J, Heller M J and O’Connell J P 1998Nat. Biotechnol.16541 [8] Steel A B, Herme T M and Tarlov M J 1998Anal. Chem.70
4670
[9] Shlyakhtenko L S, Gall A A, Weimer J J, Hawn D D and Lybchenko Y L 1999Biophys. J.77568
[10] Schmalzing D, Koutny L, Salas-Solano O, Adourian A, Matsudaira P and Ehrlich D 1999Electrophoresis203066 [11] Berggren C, Stalhandske P, Brundell J and Johansson G 1999
Electroanalysis11156
[12] Takenaka S, Yamashita K, Takagi M, Uto Y and Kondo H 2000Anal. Chem.721334
[13] Fritz J, Baller M K, Lang H P, Rothuizen H, Vettiger P, Mayer E, Guntherodt H J, Gerber Ch and Gimzewski J K 2000Science288316
[14] Salas-Solano O, Schmalzing D, Koutny L, Buonocore S, Adourian A, Matsudaira P and Ehrlich D 2000Anal. Chem.
723129
[15] Koutny L, Schmalzing D, Salas-Solano O, El-Difrawy S, Adourian A, Buonocore S, Abbey K, McEwan P and Ehrlich D 2000Anal. Chem.723388
[16] Lindsay S M, Li Y, Pan J, Thundat T, Nagahara L A, Oden P, DeRose J A and Knipping U 1991J. Vac. Sci. Technol.B9 1096
[17] Murphy C J, Arkin M R, Jenkins Y, Ghatlia N D, Bossmann S H, Turro N J and Barton J K 1993Science2621025 [18] Warman J M, de Haas M P and Rupprecht A 1996Chem.
Phys. Lett.249319
[19] Armitage B, Ly D, Koch T, Frydenlund H, Orum H, Batz H G and Schuster G B 1997Proc. Natl Acad. Sci. USA9412320 [20] Meggers E, Michel-Beyerle M E and Giese B 1998J. Am.
Chem. Soc.12012950
[21] Jortner J, Bixon M, Langenbacher T and Michl-Beyerle M E 1998Proc. Natl Acad. Sci. USA9512759
[22] Fiebig T, Wan C, Kelley S O, Barton J K and Zewail A H 1999
Proc. Natl Acad. Sci. USA961187
[23] Giese B, Wessely S, Spormann M, Lindemann U, Meggers E and Michel-Beyerle M E 1999Angew. Chem., Int. Edn. Engl.38996
[24] Kelley S O, Jackson N M, Hill M G and Barton J K 1999
Angew. Chem., Int. Edn. Engl.38941
[25] Henderson P T, Jones D, Hampikian G, Kan Y and Schuster G B 1999Proc. Natl Acad. Sci. USA968353 [26] Harriman A 1999Angew. Chem., Int. Edn. Engl.38945 [27] Messer A, Carpenter K, Forzley K, Buchanan J, Yang S, Razskazovskii Y, Cai Z and Sevilla M D 2000J. Phys. Chem.B1041128
[28] Tavernier H L and Fayer M D 2000J. Phys. Chem.10411541 [29] Voityuk A A, Rosch N, Bixon M and Jortner J 2000J. Phys.
[30] Segal D, Nitzan A, Davis W B, Wasielewski M R and Ratner M A 2000J. Phys. Chem.1043817
[31] de Pablo P J, Colchero J, Gomez-Herrero J, Martinez M T and Baro A M 2000TNT2000
[32] Porath D, Bezryadin A, de Vries S and Dekker C 2000Nature
403635
[33] Fink H-W and Schonenberger C 1999Nature398407 [34] Grozema F C, Berlin Y A and Siebbeles L D A 2000J. Am.
Chem. Soc.12210903
[35] Berlin Y A, Burin A L and Ratner M A 2000Superlatt. Microstruct.28241
[36] Wan C, Fiebig T, Schiemann O, Barton J K and Zewail A H 2000Proc. Natl Acad. Sci. USA9714052
[37] Allnatt A R and Allnatt E L 1991Phil. Mag. Lett.64393 [38] Chandra A, Wei D and Patey G N 1993J. Chem. Phys.98
4959
[39] Chandra A and Bagchi B 2000J. Chem. Phys.1121876 [40] Chandra A and Bagchi B 2000J. Phys. Chem.B1049067 [41] Saif B, Mohr R K, Montrose C J and Litovitz T A 1991
Biopolymers311171