Benefit of Selecting Number of Active Mesh Routers in
Disaster Oriented Wireless Mesh Network
Panu Avakul1, Hiroki Nishiyama1, Nei Kato1, Yoshitaka Shimizu2, Tomoaki Kumagai2
1Graduate School of Information Sciences, Tohoku University, Sendai, Japan; 2NTT Network Innovation Laboratories, NTT Corpo-ration, Yokosuka, Japan.
Email: [email protected], [email protected], [email protected], [email protected], [email protected]
Received 2012
ABSTRACT
Communications is one of the most critical factors in disaster recovery process. However, after a major disaster, exist-ing communications infrastructures may be heavily damaged or even completely unusable. It is necessary that commu-nicationsare to be promptly restored to the disaster area, which is the goal of our national project. The project aims to build three tiers wireless mesh network from remaining wireless access points in order to provide communications ser-vices to the disaster area. This work introduces a unique multiple tiers wireless mesh network project. In addition, this work also illustrates merits in optimizing the number of mesh routersin order to achieve the optimum performance by presenting both theoretical and simulation results of a specific scenario of multiple tiers wireless mesh network.
Keywords: Wireless Mesh Network; Throughput; Interference; Collision; WiFi
1. Introduction
Following the 2011 Tohoku earthquake and tsunami, the field of emergency network deployment has gainedmuch attention from research institutions all over Japan. This is because drastic disaster such as earthquake or tsunami-will incapacitate the existing communications infrastruc-ture. Therefore, it is important to be able to restore communications in the disaster area using whatever means necessary. In addition, it ismentioned by [1] that it is more complicated to deploy a new communications system where the previous system still exists. An ongo-ing national project aims to restore communications within the disaster area using the remaining resources, namely the remaining wireless access points, to con-structs a wireless mesh backbone and to provide commu-nications to users in the affected area who are referred to as Mesh Client (MC).
Wireless Mesh Network (WMN) is a type of infra-structure where each participating node or a Mesh Router (MR) both sends and relays information similar to an ad-hoc network with the exception that MR does not usually have power constraint or mobility problem. In addition, many MRs are also likely to act as wireless Access Point (AP) and provide communications service to MCs within its area similar to that of an ordinary wireless AP. WMN has been gaining attention from re-search communities due to the low-cost and rapid
de-ployment, whichare suitable properties for an emergency network role. In addition, it also inherits many other valuable characteristics from ad-hoc network such de-centralized design and distributed communications[2].
In addition to being able to relay information between MRs, MR is also usually equipped with an addition radio interface to acts as a wireless AP andto provide commu-nications services to users within its area. This implies that the MCs will be able to connect to a network like connecting to WiFi hot spot, but the communication is relayed through the wireless mesh backbone instead of the traditional wired connection.Due to this unique char-acteristic of this multiple tiers WMN, the number of ac-tive MRs plays a significant role in determining the per-formance of the whole network.
It was mentioned that our project relies extensively on the remaining wireless APs that are already deployed in an uncontrolled manner,and number of active MRs can affect the performance in multiple-tiers of the pro-ject.Therefore, in order to deploy the project successfully with the optimum performance, we need to optimize the number of MRs.This work briefly introduces the national project and investigates the effect of using the optimum number of MRs in a unique WMN project. We introduce a theoretical performance of a specific scenario of multi-ple-tier WMN, which is backed up by simulation results.
dis-cusses the structure of the project. Section 3shows theo-retical discussion of the scenario. Section 4 presents the simulation results and discussion. Finally, Section 5 pre-sents the conclusion.
2. Background
2.1. Related Works
Reference [3]presents Extreme Networking System (ENS) architechture, which is a three tiers network that is very similar to our project’s architechture. According to the article, ENS was experimentally deployed on November 2005, at San Diego and many useful emergency response statistics, such as traffic statistic, andperformance of the architechture, was collected. The authors also present many challenges in deploying wireless mesh network in the case of emergency response. One of the major dif-ference of ENS and our project is that our project plans to rely on existing inflastruture such as remaining wire-less APs. A more detail explaination regarding our pro-ject will be given in Section 2.2.
In addition to ENS presented by [3], authors of [4] also present another similar network architechture to our pro-ject called the hybrid WMN. Hybrid WMN aims to en-hances the performance of metapolian WMN with the addition of wired APs. While hybrid WMN is not in-tended for usage in an emergency response situation, it is a great idea which may also help increase the overall performance of emergency response WMN. Since in an ideal situation, some remaining wireless APs may still have wired connection available.
Reference[5] investigates the impact of inter-cell in-terference on WLAN performance. The authors’ testbed experiment shows that inter-cell inteference can greatly reduce the WLAN performance under the TCP domi-nated common office traffic pattern.
Reference [6] presents a novel gateway selection method for multiple tiers WMN that focuses on deploy-ment in disaster area. The method presented ultilize the concept of Collision Domain (CD) to choose the most suitable MR to act as Mesh Gateway (MG)in order to have the best overall system throughput.
Reference [7] presents a deployment evaluation of the Roofnet wireless mesh network, which is an unplanned WMN. The author suggests that having a denser MR may help improve the average throughput of the network due to the posibility of chosing shorter high quality links with the cost of having a higher average hop-count. However, the author also shows that the performance suffers from multi-hops transmission due to inter-hop interference. In addtition, [8]shows that in a multi-hop WMN there is fairness problem where MRs that has a higher hop-count to the gateway achieve much lower throughput than those with lower hop-count.
2.2. Project Structure and Characteristics
2.2.1. Three Tiers Network
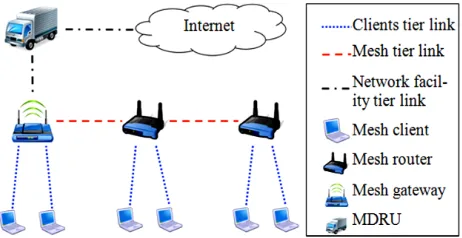
As shown in Figure 1, the project is composed of several
components. The Moveable and Deployable Resource Units (MDRU) acts as a gateway that provides connec-tions from the system to outside network such as internet. The MR is an ordinary wireless AP which is configured to act as wireless mesh backbone in order to provide communications service to the MCs. MG is a specific MR that communicates directly with the MDRU. The overall project can be partitions into three separated tiers: network facility tier, mesh tier, and clients tier.
The network facility tier covers the communication between the MDRU(s) and MGs, which is done in a spe-cial 25GHz band. The mesh tier is the wireless mesh backbone level where the MGs and MRs form a wireless mesh backbone network using the 5GHz band. The MGs act as mesh portal to bridge the communication between the network facility tier and the mesh tier. Finally, the clients tier is the level, which each MG and MR provide communications service to MCs within its vicinity over the 2.4GHz band. Since the links at the network facility tier are assumed to be high performance links, this work focus on the performance in mesh tier and clients tier.
2.2.2. Unique Deployment
A scenario of how the project will be deployed is the MDRU will be deploy to the disaster area prior to disas-ter. The MDRUis capable of carrying a certain number of MGs in order to have some control over the topology of the system. After arrival, the MDRU will configure any remaining wireless APs in the area into MRs or MGs and restore communications service to MCs in the area.
2.2.3. Uncontrolled MRs Placement
[image:2.595.309.540.601.720.2]Another major characteristic of the project is that since MRs are just commonly deployed wireless APs, and it is pointed out by [9] that common 802.11 APs are usually deployed in an unplanned or random fashion. Therefore, there is a good chance that the deployment will not be optimized, and thus causing the drop in performance.
3. Effect of Number of MRs
3.1. Effect of Number of MRs
[image:3.595.309.536.474.690.2] [image:3.595.59.287.582.706.2]CD is an important concept that can be used to estimate the capacity of WMN as shown in [10]. Since wireless links share the same medium, it is necessary that only one device within the same interfering range should be transmitting at any given time to have a successful transmission. In another word, if a certain link n is active, any other link within the same interfering range of link n must be inactive in order for transmission at link n to be successful. A CD is defined by [10] to be a set of links that have to be inactive for a transmission at a certain link to be successful including the transmitting link itself.
Figure 2 illustrates a chain topology of a two tiers WMN
where there are six MRs, which can only transmit to an adjacent MR. The rightmost device is the MG that is as-sumed to be the sink of all traffic. Each MR has to transmit G amount of traffic from its own clients tier and any other amount of traffic forwarded by its upstream MR(s). For example, MR2 has to forward G amount of traffic from its clients tier plus what MR1 forwarded which is another G to the total of 2G amount of traffic. It is assumed that the interfering range is two times the transmission range; therefore, the CD of link between MR4 and MR5 is a set of {(MR2, MR3),(MR3, MR4),(MR4, MR5),(MR5, MR6),(MR6, MG)}.
The bottleneck collision domain (BCD) is defined by [10] to be the CD that has to forward the most traffic. For instance, the CD of link MR4 and MR5 has to forward all traffic forwarded by each link within the set of its CD. Therefore, CD of link MR4 and MR5 has to forward total of 2G+3G+4G+5G+6G = 20G. The same calculation can also be done on CD of other links, but in the case of sce-nario in Figure 2,CD of link MR4 and MR5 has to
for-ward the most traffic. Hence, it is the BCD of this chain topology. According to the previous calculation, CD of link between MR4 and MR5 has to forward 20G amount of traffic. However, the capacity is bound by the MAC layer capacity C, thus can be represent by
Figure 2. A chain topology where each MR sends the same amount of traffic to the MG.
20G C. (1) By solving inequality in Equation (1), we can see that the maximum throughput available to each MR or Gmax is
max 20
C
G (2)
From the analysis above, we can see that the more general case of Equation (2) is
max
C G
AMT
(3)
whereAMT is the total amount of traffic forwarded by BCD divided by G, which will be 20 in the case of CD of link MR4 and MR5.
3.2. Considered Scenario
In order to show the effect of number of MRs, we con-sider following scenario illustrates in Figure 3(a) where
there are one MG, three MRs and six MCs. Some proper-ties of the scenario are as following:
● All MCs can connect to any available MRs.(All MCs are within the communication range of any MRs.)
● Each MR operates in different channel in a way that they do not have inter-cell interference introduced in [5].
● The mesh tier links operate in one common channel.
● Each MRs will always have the same number of MCs within its cell.
In addition, this scenario can be narrow down to three sub-scenarios as follow:
1) Only MR1 is active and all MCs are associated with MR1 as illustrated in Figure 3(b).
2) Either MR1 and MR2, or MR1 and MR3 are active. In this sub-scenario, each MR will have to serve three MCs as illustrated in Figure 3(c).
3) All MRs are active and each has to serve two MCs as illustrated in Figure 3(d).
It is possible to use the concept of BCD to estimate the maximum throughput in both the mesh tier and the cli-ents tier in each of these sub-scenarios so that we can see the effect of number of MRs in this scenario.
3.3. Sub-scenario 1
In the clients tier, MR1 serves all six MCs as wireless AP. Since all devices used only one channel within a given cell, we can easily concluded that the CD of each link is the same set that contain all links; thus all links are BCD (all links need to transmitted same amount of traffic.)By using Equation (3) whereCis the MAC layer capacity of the clients tier or Cc and AMTequals to 6, because there are six MC each offering 1G traffic.We can concluded that Gmax (throughput available to each MC) of clients tier or Cc is
6 c c
C
G (4)
In the mesh tier, there is only MR1 and the MG. However, the performance should be calculated based on throughput available to each MC rather than throughput available to each MR. Therefore, the Gmax of mesh tier-should be divided by number of MCs served by each MR or 6 in this case to formulate Gm of
6 m m
C
G (5)
where Gm the MAC layer capacity of mesh tier.
3.4. Sub-scenario 2
In this sub-scenario, each MR has toserve three MC. Therefore, using Equation (3) and AMT equal to 3 results in Cc of
GcCc
3 (6) However, in the mesh tier there are two operating MR. We can clearly see from Figure 3(c) that CD of both
links in the sub-scenario are BCN and each CD has to carry 1G + 2G = 3G amount of traffic. By using Equation (3) and AMT equals to 3 and the fact that each MR serves three MCs, the resulting Gm is
9 m m
C
G (7)
3.5. Sub-scenario 3
The clients tier of this sub-scenario has three total active APs and each has to serve two MCs. Using similar analysis to sub-scenario 1 and sub-scenario 2 in previous sections, we can see that AMT is 2 thus resulting with
2
c c
C
G (8) In the mesh tier, similar to sub-scenario 2, we can see from Figure 3(d) that CD of any link includes all links,
and thus are BCNs. In this sub-scenario any BCNs has to carry 1G+1G+3G=5G (AMT=5) amount of traffic and that each MR serves 2 MCs, hence, resulting with
10 m m
C
G (9)
3.6. Scenario Discussion
Since our project is a multiple tiers WMN, the perform-ance of the project will be restricted by the tier with lower performance. We can clearly see from Table 1 or Figure 4 that the performance in the mesh tier decreases
with increasing number of MR. This is because of the interference modeled by BCD concepts. On the other hand, the performance in the clients tier benefits from the extra capacity of additional MR operating in nonoverlap-ping channel. Therefore, it is important to optimize this trade off, which results from the number of activating MRsin the area, in order to provide the best maximum throughput to each MC.
All metrics are summarized in Table 1 whileFigure 4
shows plots of Gm and Cc with different value of Gm for different 802.11a data rates (Gm-54 for 54Mbps, Gm-24 for 24Mbp, and Gm-12 for 12Mbps). Each value of Cfor both Cc and Gm are experimentally deter-mined by simulations for each data rate. According to
Figure 4, the maximum throughput available to each MC
is bounded by either Gm or Cc. Since Gm and Cc rely on each other, the lower value of the two will be the upper bound of the maximum throughput. Therefore, by using this concept, it is possible to estimate the optimum number of MRs that will give the maximum average throughput to each MC. We can easily see from Figure 4
Table 1. Summary of all values of this section.
Metrics Sub-scenario
Gm Gc
1 Cm
6
Cc
6
2 Cm
9
Cc
3
3 Cm
10
Cc
Figure 4. Theoretical value of Gm and Gc for different data
rate.
that the optimum value of MR used for 802.11a with 54Mbps data rate is three MRs.This is because the capac-ity in the mesh tier is large enough to accommodate the extra capacity in the clients tier, which results from hav-ing three APs operate in nonoverlapphav-ing channel.
4. Simulation Results and Discussion
Simulations are conducted to confirm this effect dis-cussed in section 3. The simulation scenarios are set up in Qualnet 5.1 with topologies similar to that of Figure 3(b), (c) and (d). Each MR is set up to operate as AP in
different nonoverlappingchannel in the clients tier;thus, interference between each MR will not exist within the clients tier. In additional to clients tier interface, each MR also has another interface for communicating in the mesh tier. In mesh tier, all MRs operate in one common channel, which means the collision domains contain all links. Each MC sends CBR traffic to MG and thus all traffic only originate from MCs and flow to MG.
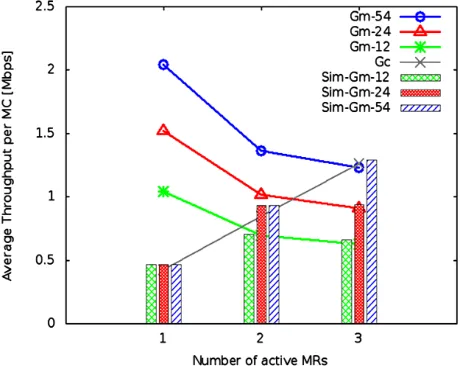
Figure 5 shows results of the simulation scenarios
where the line graphs are the theoretical results from
Figure 4,and the bar graphs show the simulation results
of each mesh tier’s data rate (54 Mbps in blue, 24 Mbps in redand 12 Mbps in green.) In the single MR scenario, the simulated results represent the fact that the average throughputs are bounded by Cc, which has lower value than all Gm of all data rate. The results of two operating MRs scenario differ from that of the single operating MR scenario in that the average throughput per MC of 12Mbps case should now be bounded by Gm with data rate of 12Mbps (in green).This is because the result of
m
G with data rate of 12Mbps is now lower than that of c
C as shown in Figure 5. However, since the average
throughput per MC of Cc is still lower than those of m
G of 24Mbps and 54Mbps, the throughput per MC of those two cases are still bounded by Cc. Finally, in the
Figure 5. Simulation results and theoretical results for dif-ferent data rate.
case of 3 active MRs, the theoretical results show that the simulation results should be bounded by Gm of each case. As shown in Figure 5, the simulation results clearly
follow those of the theoretical results. This shows that the theoretical results are accurate, and we can concluded that we can determine the number of active MR(s), which would yield optimum number of MRs for each
m
G (of different data rate). From Figure 5, we can
de-duct that the most optimized number of MRs in Gm equals to 54Mbps, 24Mbps, and 12Mbps are 3 MRs, 2 or 3 MRs, and 2 MR respectively. This is because these combinations give the best per MC performance.
5. Conclusion
Previous sections show that in order for the project to achieves the optimum performance, the set of active MRs will need to be determined to give the best possible per-formance. In the future, we aim to apply this idea into a more general case of multiple tiers WMN. In addition, many other important factors such as channel assignment in the mesh tier, and inter-cell interference present in [5] should also be considered when deciding optimum set of active MRs.
[image:5.595.308.538.86.269.2]6. Acknowledgements
This work was conducted under the national project, “The R&D on the reconfigurable communication re-source unit for disaster recovery”, supported by the Min-istry of Internal Affairs and Communications (MIC), Japan.
REFERENCES
[1] B.S. Manoj and Alexandra Hubenko Baker, “Communi-cation challenges in emergency response,” Communica-tions of the ACM – Emergency response information sys-tems: emerging trends and technologies, Vol. 50, No. 3, 2007, pp. 51-53. doi:10.1145/1226736.1226765
[2] P. H. Pathak and R. Dutta, “A Survey of Network Design Problems and Joint Design Approaches in Wireless Mesh Networks,” IEEE Communications Surveys & Tutorials, Vol. 13, No. 3, 2010, pp. 396-428.
doi:10.1109/SURV.2011.060710.00062
[3] B. Braunstein, T. Trimble, R. Mishra, B. S. Manoj, L. Lenert and R. R. Rao, “Challenges in Using of Distrib-uted Wireless Mesh Networks,”Proceedings of the 3rd
In-ternational ISCRAM Conference, Newark, NJ, May 2006 [4] W. Fu and D. P. Agrawal, “Capacity of Hybrid Wireless
Mesh Network with Random APs,”IEEE Transactions on Mobile Computing, Vol. 10, No. 12, 2011.
doi:10.1109/TMC.2011.247
[5] M. A.Ergin, K. Ramachandran and M.Gruteser, “Under-standing the effect of access point density on wireless
LAN performance,”Proceedings of the 13th
annual ACM international conference on Mobile computing and net-working MobiCom, Montreal, 9-14 September 2007, pp. 350-353. doi:10.1145/1287853.1287902
[6] W. Liu, H. Nishiyama, N. Kato, Y. Shimizu and T. Ku-magai, “A Novel Gateway Selection Method to Maximize the System Throughput of Wireless Mesh Network De-ployed in Disaster Areas,”23rd
IEEE International Sym-posium on Personal, Indoor and Mobile Radio Commu-nication PIMRC, Sydney, 9-12 September 2012. [7] J. Bicket, D. Aguayo, S. Biswas and R. Morris,
“Archi-tecture and evaluation of an unplanned 802.11b mesh network,”MobiCom Proceeding of the 11th
annual inter-national conference on Mobile computing and networking, Cologne, August 28- September 2 2005. pp. 31-42. doi:10.1145/1080829.1080833
[8] J. Camp, J. Robinson, C. Steger and E. Knightly, “Meas-urement Driven Deployment of a Two-Tier Urban Mesh Access Network,”MobiSys Proceeding of the 4th
interna-tional conference on Mobile systems, applications and services, Uppsala, 19-22 June 2006. pp. 96-109.
doi:10.1145/1134680.1134691
[9] A. Akella, G. Judd, S. Seshan and P. Steenkiste, “Self-management in chaotic wireless deploy-ments,”MobiCom Proceedings of the 11th
annual interna-tional conference on Mobile computing and networking, Cologne, August 28 - September 2 2005.
[10] J. Jun and M. L. Sichitiu, “The Nominal Capacity of Wireless Mesh Networks,” IEEE Wireless Communica-tions, Vol. 10, No. 5, 2003, pp. 8-14.