Application of FTIR imaging and spectroscopy to solid
dosage formulations.
MUTHUDOSS, Prakash.
Available from Sheffield Hallam University Research Archive (SHURA) at:
http://shura.shu.ac.uk/20107/
This document is the author deposited version. You are advised to consult the
publisher's version if you wish to cite from it.
Published version
MUTHUDOSS, Prakash. (2011). Application of FTIR imaging and spectroscopy to
solid dosage formulations. Doctoral, Sheffield Hallam University (United Kingdom)..
Copyright and re-use policy
See
http://shura.shu.ac.uk/information.html
Sheffield Hallam University Research Archive
Adsetts Centre, City Campus Sheffield S1 1WD
1 0 2 0 0 1 824 0
ProQuest Number: 10697414
All rights reserved
INFORMATION TO ALL USERS
The quality of this reproduction is dependent upon the quality of the copy submitted.
In the unlikely event that the author did not send a com plete manuscript and there are missing pages, these will be noted. Also, if material had to be removed,
a note will indicate the deletion.
uest
ProQuest 10697414
Published by ProQuest LLC(2017). Copyright of the Dissertation is held by the Author.
All rights reserved.
This work is protected against unauthorized copying under Title 17, United States C ode Microform Edition © ProQuest LLC.
ProQuest LLC.
789 East Eisenhower Parkway P.O. Box 1346
Application of FTIR Imaging and
Spectroscopy to Solid Dosage Formulations
Prakash Muthudoss
A thesis submitted in partial fulfilment of the requirements of
Sheffield Hallam University
for the degree of Doctor of Philosophy
April 2011
ABSTRACT
The preparation of solid dispersions, in this study felodipine/poly vinyl pyrrolidone solid dispersion, is a multifaceted phenomenon. In order to understand the formation of solid dispersions two different mixed solvent system, three different temperatures and different drug loadings were selected and monitored in real time using Attenuated Total Reflectance- Fourier Transform Infrared Spectroscopy. 50 pi of the prepared solution was placed onto a pre-heated ATR crystal. The effect of PVP/API ratio, molecular interactions and effect of temperature (30°C, 40°C and 50°C) on the rate of film formation (solid dispersions) was evaluated. The changes in the peak positions, peak intensities and peak width as a function of time was monitored. The data were then analysed using peak height measurements, statistical and chemometric data analytical tools. It was shown that the nature of the solvent, the working temperature, presence of polymer and low drug loading was found to influence the rate of evaporation of solvent, molecular interactions and quality of the final product. Moreover, using thermogravimetric techniques it was complemented that the residual solvent within the systems was within the studied limits.
The spatial arrangement or distribution of components within solid dispersion was found to influence the physical stability, phase behaviour, dissolution and bioavailability. Mid infrared spectroscopic imaging has been shown to be useful and has provided unique insights in to various fields. However, it has very limited applications in analysing the pharmaceutical materials. This work aims to evaluate various image processing tools in extracting process related information. Three model systems with varying chemical composition were selected. The chemical images from the regions of interest were collected using a Varian 620 FTIR Imaging instrument equipped with 64 x 64 MCT-Focal Plane Array (FPA) detector. Firstly we showed the impact of optical artefacts on the quality of the acquired image. The data was then pre-processed to remove baseline effects, pathlength variations and image processed to extract distribution maps. Agreement between the data generated using peak height measurements, compare correlation, principal component analysis and multivariate curve resolution was obtained only with the simple systems, the advantage with the latter being that the supervised and unsupervised chemometric approaches do not require any prior information about the sample and does not suffer from any physical or chemical interferences. The success of MCR-ALS over compare correlation and PCA methods is that it does not require any pure materials library and provides chemical information respectively. Moreover, implementation and data extraction is easy using MCR-ALS. It was then showed that once the optical artefacts are separated and chemically significant information is extracted, the benefits of infrared imaging was multitude.
ACKNOWLEDGEMENTS
First and foremost, I would thank my director of studies Dr. Christopher Sammon. I gratefully appreciate for sharing his scientific expertise, mentoring during tough times in the PhD pursuit, making time to answer, being friendly always and develop me as an infrared spectroscopist. I express my sincere gratitude to my second supervisor Dr. Stephen Spells, for his guidance, encouragement, and inspiring discussions from a physicist point of view. I am sincerely grateful to Dr. Francis Clegg, for his support, never-ending optimism and patience, professional and social discussions.
1 extend my sincere thanks to my industrial supervisor Dr. Caroline Rodger, for her constant support, appreciation, patiently accepting my request to visit AZ to use Isys software anytime during 2010.1 consider it as a great honour to express my deep sense of gratitude and indebtedness to Dr. Andrew Brookes, who not only gave me the opportunity but also kept me in high spirits through his valuable suggestions and inspiration. I am delighted to place on record my profound sense of gratitude to Dr. Stephanie Brown, Dr. Jonathan Booth and Dr. Liz Meehan. I would like to thank
Prof. Jack Yarwood for his professional support and many interesting discussions about vibrational spectroscopy. I am particularly indebted to Dr. Bindhu Madhavan Gururajan, for his personal motivations, productive ideas at each and every stage of my professional and personal career.
Word’s can’t express my sincere gratitude to Dr. Olivier Lewis, Miss. Deeba, Mr.Vinay, Mr.Bob, Mr.Stuart, Mr. Gary Robinson and obligation to my dear colleagues Dr. Subodh, Dr. Marianne, Dr. Andrew, Dr. Fabio, Mr. Michael, Miss. Vicky, Mr. Hakan, Mr. Omkar and to all other friends who directly or indirectly helped during my work. Thanks to everyone in the MERI office (admin team).
I gratefully acknowledge the financial support from Materials and Engineering Research institute as Hallam Research Studentship and AstraZeneca for supporting the project. I submit my sincere thanks to my beloved friends Ponraj, Santosh, Ganesh
Contents
Chapter 1... 1
Background a nd In tr o d u c t io n... 1
1.1 Pharmaceutical Substances... 1
1.2 Aqueous solubility, dissolution rate and bioavailability ...1
1.3 Amorphous systems and Solid Dispersions... 2
1.4 Solid Dispersion and Potential Characteristics... 4
1.4.1 Choice o f manufacturing process ... 4
1.4.2 Solvent selection ... 4
1.4.3 Importance o f Molecular interactions... ... 4
1.4.4 Understanding dissolution behaviour or drug release...5
1.5 Implications o f knowing these characteristics... 5
1.6 Aims and Objectives... 7
Chapter 2 ... 10
Felodipine/Polyvinylpyrrolidone Solid Disper sio n s...10
2.1 Model Polymer-Polyvinylpyrrolidone (P V P )... 10
2.2 Model Drug-Felodipine... 10
2.3 Felodipine/PVP Solid Dispersions ... 13
Chapter 3 ... 18
Research Design a n d Me t h o d s... 18
3.1 Preparation o f Solid Dispersions... 18
3.2 Characterization o f Solid Dispersions... ...18
3.3 Fourier Transform Infrared Spectroscopy... 18
3.3.1 Introduction...18
3.3.2 Principle... 19
3.3.3 Theory and Molecular Vibrations... ... 19
3.3.4 Infrared Spectrum... 21
3.3.5 Instrumentation... 21
3.3.6 Advantages o f FT-IR over traditional instruments...22
3.3.7 Attenuated Total Reflectance-Fourier Transform Infrared Spectroscopy 23 3.4 Spectroscopic Imaging ... 25
3.4.1 Introduction... 25
3.4.2, Infrared imaging background ... 26
3.4.3 Instrumentation... 26
3.4.4 Resolution...31
3.4.5 Signal to noise ratio (SNR )... 31
3.5 Thermogravimetry-Mass Spectrometry or Evolved Gas A nalysis... 31
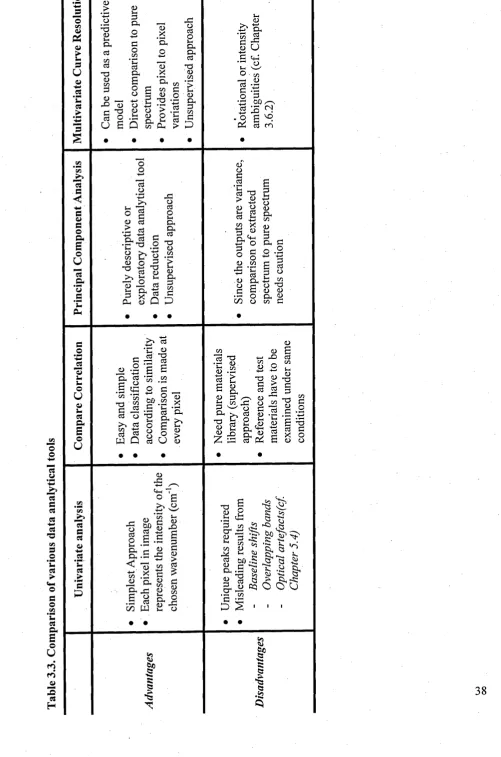
3.6.1 Univariate analysis... 34
3.6.2 Multivariate analysis... 34
3.7 Statistical Analysis... 36
Ch a p t e r 4 ... 39
Th e Ap p l ic a t io n o f Vib r a t io n a l Sp e c t r o s c o p y t o So l id Di s p e r s i o n s: Kin e t ic s o f So l v e n t Ev a p o r a t io n An d Dr y i n g... 39
4.1 Introduction... 39
4.2 Experimental part... 40
4.2.1 Materials... 40
4.2.2 Sample preparation... 42
4.2.3 Experimental Parameters... 42
4.2.4 Multivariate Curve Resolution... 42
4.2.5 Statistical Analysis ... 43
4.3 Results... 43
4.3.1 Extraction of kinetic information - Peak Height Measurements... 49
4.3.2 Extraction of kinetic information - Multivariate Curve Resolution...50
4.3.3 Statistical Analysis ... .51
4.3.4 Thermogravimetry/Mass Spectrometry ... 51
4.4 Discussion... ...54
4.4.1 Surface tension and Wettability ... 54
4.4.2 Thickness of the Final Product... 54
4.4.3 The Applicability of Raoult’s law and Henry’s L aw ...54
4.4.4 Acetone/Methanol BSM : Molecular Interpretation of Raoult’s Law...56
4.4.5 DCM/Acetone BSM: Molecular Interpretation of Raoult’s Law... 56
4.4.6 11o Measurements - Kinetics of solvent evaporation and film formation . 57 4.4.7 Residual solvents... 70
4.4.8 Molecular Interactions... 70
4.5 Conclusion ... 74
Ch a p t e r 5... 76
Ev a l u a t i o n o f Im a g e Pr o c e s s in g To o l s f o r Mi d-In f r a r e d Im a g i n g 76
5.1 Introduction... 76
5.2 Materials and Methods... ...76
5.3 Understanding the Raw D ata... 77
5.4 Data Pre-processing... 79
5.5 Data Processing ... 80
5.6 Results and Discussion... 80
5.6.1 Model system I or High Contrast sample or Pharmaceutical Alloys...80
5.6.3 Model System III or Medium contrast sample...90
5.7 Image visualisation to o ls ...91
5.7.1 Red-Green-Blue (RGB) reconstruction...94
5.7.2 Scatter plots with colour representation... 94
5.7.3 RGB vs. Scatter plots... 95
5.8 Conclusions ... 97
Chapter 6 ... 102
The Application of Vibrational Spectroscopy to Solid Dispersions: Final Product Characteristics.... ... 102
6.1 Introduction ... 102
6.2 Experiments...102
6.2.1 Materials ... 102
6.2.2 Sample preparation... 103
6.2.3 Experimental Parameters... ...103
6.3 Results and D iscussion ... 104
6.3.1 PVP Final Product Characteristics... 104
6.3.2 Felodipine final product characteristics... 105
6.3.3 Spectroscopic Imaging ...113
6.4 Conclusions...116
Chapter 7 ... 122
Infrared Imaging in Assessing the Thermal Stability of Solid Dispersions ... 122
7.1 Introduction ... -122
7.2 Objective o f the present study...123
7.3 Structures o f the starting materials and degradation products... 123
7.4 Experiments... 124
7.4.1 TGA/DTA M easurements... 124
7.4.2 In situ FTIR ATR Measurements ... 124
7.4.3 Mid infrared imaging... 124
7.5 Results and D iscussion...125
7.5.1 Thermogravimetric/Thermal Analysis (TG-DTG-DTA) measurements 125 7.5.2 In situ ATR-FTIR studies... 127
7.5.3 Mid infrared imaging ;... 128
7.6 Conclusion...134
Chapter 8... 138
Sum m ary and Co n c lu sio n s... 138
8.1 Introduction... ... 138
8.2 Bulk Spectroscopic Measurements...138
Ch a p t e r 9... 143
Fu r t h e r w o r k... 143
9.1 Kinetics of solvent evaporation and drying... 143
9.2 Evaluation of image processing tools... 143
9.3 Spectroscopic imaging to determine the final product characteristics 144 9.4 Stability studies of solid dispersions ... 144
Ch a p t e r 10... 146
C
h a p t e r1.
B
a c k g r o u n d a n dI
n t r o d u c t io n1.1 Pharmaceutical Substances
A pharmaceutical substance or active pharmaceutical ingredient (API) or drug is a compound that is intended to furnish pharmacological activity or other direct effect in the diagnosis, cure, mitigation, treatment or prevention of a disease or to affect the structure of any function of the human body.1 However, these pharmaceutical substances do not include any intermediates used in the synthesis. Drug development is a tedious, expensive and a time-consuming process and the time frame for drug 1 2 development from screening to market launch on average requires 10-12 years. 5 Various stages from discovery to marketing are, drug discovery, drug development, clinical trials, manufacturing procedures, marketing approval.1
Drugs are hardly ever administered as pure chemical substances, instead formulated in combination with one or more non-medicinal agents or excipients.3 These formulations are termed dosage forms. An active ingredient can be formulated into a variety of dosage forms. The dosage forms are classified based upon the routes of administration like Oral, Rectal, Topical, Parenteral, Nasal, Eye, Ear, etc. The preferred route for administering drugs is through mouth or commonly termed as oral route of administration. Solid oral dosage forms are more stable, easy to produce and more or less accurately delivered than the other oral dosage forms like suspensions, emulsions, syrup etc. However, formulating a successful dosage form requires consideration of physical, chemical and biological characteristics of ingredients and excipients used in fabricating the product.3,4
1.2 Aqueous solubility, dissolution rate and bioavailability
When the dosage form is administered, the aqueous soluble drugs are dissolved or solubilised either in the stomach or small intestine through the action of gastro-intestinal (GI) fluids (dissolution) and transported to the blood or systemic circulation.5 The amount of drug required to reach the systemic circulation determines the physiological action and is termed as bioavailability.5’6
hydrophobic drugs.8 The problem of delivering poorly water soluble active pharmaceutical ingredients (APIs, or "drugs") is one that is increasingly taxing the pharmaceutical scientists. The first and foremost focus during drug development is enhancing the bioavailability of hydrophobic drugs.9' 11
The relationship between solubility and dissolution is well understood using the modified Noyes-Whitney equation which is
dU AD(Cs~C
t)
_ _
wd t h
w
where dM/dt is the dissolution rate; A is the specific surface area; D is the diffusion co efficient; h is the diffusion layer thickness, Cs is the saturation solubility and Q is the drug concentration at time t.
The diffusion coefficient and diffusion layer thickness are physiological parameters which are often difficult to be manipulated.5 However, improving the solubility through formulation approaches is the most attractive option.7,10 Tailoring the surface area and manipulation of saturation solubility are some of the available approaches to improve aqueous solubility. The available surface area for dissolution can be increased by reducing the particle size (e.g. milling, micronisation).5,7,12 The saturation solubility can be altered by chemically modifying the pharmaceutical substances (e.g. salts) or changing the physical state of the drug in the formulation (e.g. metastable polymorphs, amorphous form).7,13
1.3 Amorphous systems and Solid Dispersions
A crystalline substance melts at a certain temperature which is the melting temperature (Tm) and rapid cooling of this melt yields supercooled liquid. Further cooling produces glassy material: the temperature at which this transition occurs is termed as the glass transition temperature.14,15 The property of materials at Tm, below and above Tg vary significantly.
The amorphous phases or forms of pharmaceutical active substances have received greater attention.15 This is due to the fact that amorphous forms contain higher free
16 18
With solid dispersions, there are improvements in bioavailability because there is reduction in particle size, improved wettability, higher porosity and change in drug crystallinity.7,10’19'21 Moreover, aforementioned improvements are the parameters concerning the surface area and saturation solubility with the Noyes-Whitney solubility relationship.5
Solid dispersion refers to solid state mixtures, prepared through the dispersion, typically by solvent evaporation or melting (fusion) or melting-solvent methods, of one or more
11 Oft 00
active ingredients in an inert carrier matrix. ’ ’ It also refers to a product formed by
13 9 1 9 3
converting a fluid-carrier combination to the solid state. ’ ’
When the technique was first introduced it was believed that the drug was in a microcrystalline state in the drug/polymer mixture with the formation of eutectic systems24 and was later termed as “solid dispersion”.20 Conversely, it was suggested that some of the drug particles might be molecularly dispersed (solid solution) or drug being present as small particles embedded (solid suspension) in the polymeric matrix.25,26 Nevertheless, the fundamental principle remains the same, that is, the drug particles are released as fine particles upon exposure to aqueous media when the carrier component of the solid dispersion dissolves.
As already mentioned, the amorphous forms have higher solubility than the crystalline counter-parts. To quantify the benefits, the thermodynamic or thermal properties have been used to compare the predicted and experimental solubility. Hancock and Parks16 using a simple thermodynamic approach (based on the free energy difference between two physical forms) reported a procedure for the estimation of solubility advantage. However, the predicted and experimental solubility was in close agreement only with crystalline materials. Pikal and co-workers17,18 proposed a modified procedure for the estimation of amorphous solubility, yet the procedure was successful only for amorphous systems that were slowly crystallising from the aqueous media. For rapid crystallising materials there are more limitations. Nevertheless, the number of marketed products developed using the solid dispersion approach is very limited10,13 whilst there have been many publications concluding increased dissolution rates. This could be
27
attributed to the lack of basic understanding of these systems at the molecular level.
1.4 Solid Dispersion and Potential Characteristics
1.4.1 Choice of manufacturing process
Various approaches used in the generation of solid dispersions are the melt or fusion method,10 the solvent method,13 melting-solvent method,20 etc. If the carrier selected has a lower glass transition temperature (Tg), as with PVP and felodipine the preferred choice is the solvent method. The drug and the polymer are mixed in a common solvent upon removal of the solvent, solid dispersions are obtained.5,10 Since the solvent evaporation occurs at ambient or room temperature, this method is suitable for processing thermolabile compounds.6,7 Practical or industrial applications of pilot scale solvent evaporation method are spray drying and freeze drying. However, finding a common solvent is not easy; toxicity or physical instabilities of residual solvents and high manufacturing cost are some of the limitations of the solvent method. The choice of preparation method (Spray drying or melting) influenced morphology or particle size of triamterene-D-mannitol solid dispersions and the dissolution rate.
1.4.2 Solvent selection
In the solvent method, the solubility of drug and the polymer in the solvent is a prerequisite to obtain stable solid dispersions. The physical state of the prepared dispersions is influenced by the drug-to-solvent and/or carrier-to-solvent ratio, solvent- solid interactions, temperature of drying, evaporation rate and the nature of the solvent. 10,30 Solvent nature, Gutmann’s acceptor-donor number and density are some of the factors that are important while selecting the solvents. Spectroscopic studies have
31 •
shown that solvents can alter molecular interactions of 1,4 dihydropyridine, swelling behaviour of hydrogels,32 change in the conformation,33 alter the denaturation of urea34,35 etc. These effects are characterised by solvent induced frequency shifts31 (SIFS) in carbonyl moieties and other groups involved in the intermolecular interactions. In contrary, self-association and solvent-solvent interactions can decrease the maximum solubility of the drug.
1.4.3 Importance of Molecular interactions
Various interactions known to-date37 are H-bonding, ion-dipole, dipole-dipole, complexation and Vander Waal’s interactions or combinations of the aforementioned interactions.38 Likewise electrostatic interactions between the drug and the polymer are reported.39 The physico-chemical properties of the drugs are altered due to the presence of strong heteromolecular interactions like hydrogen bonds.11 In addition, these interactions have a pronounced effect on the molecular state of the drug.40 Applications
include improvement of the solubility of hydrophobic drugs, enhanced dissolution rates, increased drug release rate, improved stability, enhanced bioavailability, altered therapeutic activity and reduced side effects.37 Interestingly, Timmins et al.,38 showed that drug-polymer interactions could reduce crystallinity even if the products are physically mixed.38
1.4.4 Understanding dissolution behaviour or drug release
Compared to the crystalline form, the amorphous systems require no additional energy to dissolve in the gastro-intestinal enzymes or fluids. Additionally, the advantage of solid dispersions over amorphous forms in enhancing the release of drug and dissolution rate of the drug is enormous.41'43 Water soluble polymers together with biological factors like bile acids and fatty acids solubilise the dissolved drug and hence facilitate the dissolution rate.
1.5 Implications of knowing these characteristics
Several experiments have been conducted in the past few years to understand the stability of amorphous pharmaceutical formulations. These can be illustrated by considering the solution state stability and solid state stability separately. The solid state stability concerns with the manufacturing and storage aspects; while the solution state stability mainly concerns with drug release and dissolution rate in the stomach or small intestine.
To understand the recrystallization process or solid-state stability of solid dispersions, evaluation of kinetic and thermodynamic factors is quite important.30,44 From a kinetic point of view, molecular mobility is a key factor that is frequently reported detrimental when assessing the stability of amorphous forms. In a thermodynamic perspective, solid-solid or drug-polymer miscibility is a prerequisite to retard the amorphous- amorphous phase separation and hence improve the physical stability of solid dispersions. The recrystallization process in the solution state always starts by a nucleation event followed by crystal growth.5
To overcome these undesirable events, various formulation strategies were developed. Addition of polymers reduces the molecular mobility either by increasing the viscosity of the mixture (antiplasticization effect) or through specific drug-polymer molecular interactions.27,45,46 Manipulating the drug-polymer interactions not only facilitates thermodynamic solid-solid miscibility or drug dissolution rate but does provide the opportunity in designing optimally stabilized amorphous systems 47 Taylor et al.,4S
investigated physical stability of model hydrophobic drug-PVP solid dispersions upon exposure to high relative humidities. It was shown that model drugs with NH moieties underwent moisture-induced drug-polymer immiscibility while model drugs with GOOH moieties were miscible. The physical stability was influenced by solid-solid or drug-polymer miscibility. It was showed that the hydrophobic-drug polymer systems which were partially miscible were more prone to phase separation and subsequent recrystallization than systems which showed complete miscibility.48'50
From the biopharmaceutical point of view, the selected polymer should solubilize the drug, molecularly interact and reduce the nucleation rate. Additionally, the kinetics of drug release from the solid dispersion depends on the dissolution mechanism like wetting or dispersability and an extensive knowledge of this would help in formulating better process conditions.13,47 For dissolution enhancement, Telang et al., prepared ternary dispersions of indomethacin (IMC) by incorporating the surfactant meglumine (MU) in the polymer polyvinyl pyrrolidone (PVP) in an attempt to prevent crystallization from the supersaturated solutions. The prepared ternary dispersion showed improved physical stability and enhanced dissolution rate.51
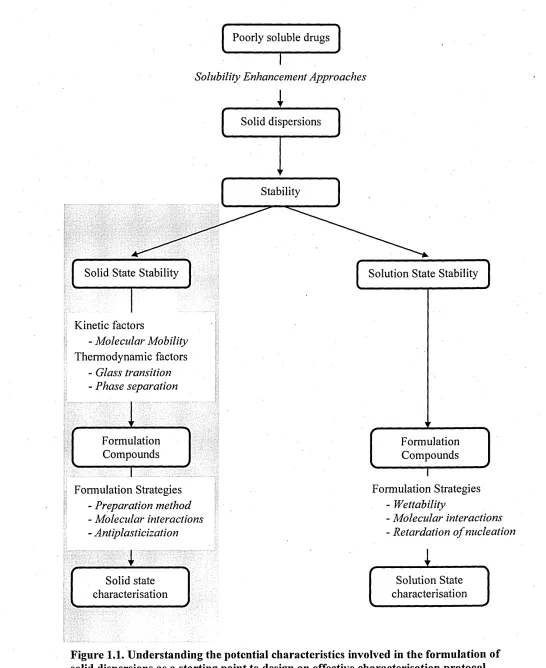
Moreover, Vanden Mooter et al.,52 showed that sprayed dried itraconazole/eudragit E l00 solid dispersions were superior in product performance to the melted products and concluded that the influence of drying kinetics on phase behaviour or solid-solid miscibility has to be understood. Patel et al., formulated solid dispersions of two poorly soluble anti-cancer drugs (CurcurbitacinB and CurcurbitacinI) using PEO-b-PCL diblock polymer.53 At low levels of PCL there was increased solubility; however increasing the content decreased the dissolution rate due to retardation of drug release from the polymer matrix. That is, the degree and nature of molecular interaction can affect the dissolution and bioavailability.42,54,39,53,55 Moreover, the addition of surfactants could increase the nucleation rate and hence decrease the solution stability.5 Poor prediction still persists in understanding the importance of these individual characteristics. The challenges concerning the basic understanding could be due to poor predictability of the properties of the resultant material, influence of manufacturing conditions or factors governing stability considerations. Major difficulties for this knowledge gap have most certainly been the limitation of characterisation techniques to study the solid-state and the solution-state stability and the interplaying factors on a molecular level. Understanding the potential characteristics involved in the formulation
of solid dispersions will be a good starting point to design an effective characterisation protocol as shown in Figure 1.1.
A wide range of analytical methods have been used to study the prepared solid dispersions with the aim to understand the structure of solid dispersions, the crystallization kinetics, drug-polymer-excipient interactions, molecular mobility and thermodynamics of the molecular state.47 The advantages of using infrared (bulk spectroscopy and spectroscopic imaging) and complementary techniques to improve the understanding of the distribution of each component within the polymer matrix, the dynamics of solid dispersion formation and the physical stability of solid dispersions will be discussed in the following chapters.
1.6 Aims and Objectives
The objective of this project was to investigate the applicability of mid-infrared spectroscopy and spectroscopic imaging techniques to characterise the drying kinetics, molecular interactions, phase separation, phase transition and homogeneity or heterogeneity in distribution. In this context, the aim of this research was to develop methodologies and experimental toolbox involving mid infrared spectroscopy to effectively characterise the solid state stability of solid dispersions.
Fourier Transform Infrared Imaging (FTIR-Chemical Imaging) allows us a new dimension to probe the distribution of the components on the micron scale. However, it has also raised particular challenges in extracting useful information from the chemical images. In this direction, particular attention will be paid to the evaluation and optimisation of experimental design and of procedures to provide statistical and chemometric data analysis schemes.
In order to achieve our motivation model drug (felodipine), model polymer (polyvinylpyrrolidone, PVP) and various solvents (acetone, methanol and dichloromethane) were included in the study. These model systems were selected because extensive work has been carried out among different groups across the globe to prepare, characterise and study the stability of felodipine/PVP solid dispersions. Moreover, these model systems are widely used in the pharmaceutical industry.
Poorly soluble drugs
Solubility Enhancement Approaches
Stability Solid dispersions
Solid State Stability Solution State Stability
Kinetic factors
- Molecular Mobility Thermodynamic factors
- Glass transition - Phase separation
Formulation Compounds
Formulation Strategies - Preparation method - Molecular interactions - Antiplasticization
\
Solid state characterisation
Formulation Compounds
Formulation Strategies - Wettability
- Molecular interactions - Retardation o f nucleation
[image:19.627.26.572.23.691.2]Solution State characterisation
Figure 1.1. Understanding the potential characteristics involved in the formulation of solid dispersions as a starting point to design an effective characterisation protocol.
C
h a p t e r2.
F
e l o d ip in e/
p o l y v in y l p y r r o l id o n eS
o l idD
is p e r s io n s2.1 Model Polymer-Polyvinylpyrrolidone (PVP)
Polyvinylpyrrolidone (PVP) is made from the monomer N-vinyl pyrrolidone. PVP has hydrophilic and hydrophobic groups which makes it soluble in water and various other solvents.57,58 The relative molecular mass of PVP ranges from 2500 to 1 million and PVP of lower relative molecular mass are used in pharmaceutical industries.56 PVP grades are distinguished by their K-value, a measure of specific viscosity and this correlates with the molecular weight.56
Chemical Structure of Polyvinylpyrrolidone (p yp)56,59,60.
PVP forms a molecular adduct solubilising the insoluble substances;7 thus PVP is one of the common carriers used in preparing solid dispersions.6,61 Due to the steric hindrance, the lone pair of electrons on nitrogen atom doesn’t involve in the intermolecular interactions, while the involvement of the C=0 group is favoured.62 Precisely, PVP stabilises the solid dispersions through intermolecular interactions with proton donating drugs,22,62 ion-dipole interactions with proton accepting drugs63 and the antiplasticing effect with neutral drugs.30
In addition, PVP polymers are used as crystal growth inhibitors and/or rheological additives in soft gelatine capsules, oral liquids and suspensions, parenteral formulations, topical gels creams, lotions and ophthalmic preparations.
2.2 Model Drug-Felodipine
Felodipine is a dihydropyridine derivative that is chemically described as ethyl methyl- 4-(2, 3-dichIorophenyl)-l, 4-dihydro-2,6- dimethyl-3, 5-pyridine-dicarboxylate,64,65 a calcium channel blocker, widely used in the treatment of angina pectoris and hypertension.66'68 It acts by relaxing the vascular smooth muscle. In addition, felodipine when administered dilates the coronary and peripheral arteries.
Felodipine shows polymorphism69 and chirality68 unlike other 1, 4 dihydro pyridine derivatives. The different crystal forms and the properties are given in the Table 2.1.
Partial decomposition is found in the annealed and molten form but not in the
1TQ
commercially available products.
. c o o c h 2c h 3
£€> »7A Chemical structure of Felodipine
Felodipine is very poorly soluble in water and the aqueous solubility at ambient temperature is determined to be 0.5 mg/1.69 Srcic et al.,31 studied the molecular interactions of 1,4 dihydro pyridine (DHP) derivatives like nifedipine, nitrendipine, nimodipine and amlodipine in different organic solvents. For uncharged molecules there was good correlation between the acceptor-donor number and the carbonyl stretching vibrations of the derivatives. The DHP’s act as H-bond donors in solvents with low acceptor number (AN) whereas they are strong H-bond acceptors in solvents with high AN. However, in protic solvents like ethanol/methanol, the DHP’s can act as H-bond donors and acceptors.
These properties affect the dissolution rate of felodipine, if it is formulated as a conventional dosage form.65 Several approaches to increase the dissolution rate of felodipine have been undertaken.71'74 The formation of a glassy phase by producing amorphous felodipine is one such method.65 Amorphous felodipine is prepared either by cooling the melt at room temperatures or by quenching under liquid nitrogen and has a glass transition temperature (Tg) of 43 °C. Velaga et al.,15 obtained felodipine form II reproducibly by co-crystallising with isonicotinamide. The results were confirmed through the appearance of the NH stretching peak at 3336 cm '1 and carbonyl peaks at
1698 and 1683 cm'1.
Table 2.1. Data of (±)- and (+)- Felodipine crystal forms'
m
X>
(N
CO
o
O
h
CO
VO
00
[image:22.618.57.772.52.566.2]Chamarthy and Pinal12 milled felodipine crystals to induce crystal disorder. A high degree of crystal disorder can introduce amorphous character; however, milling felodipine material induced crystal defects but not amorphous character. Lindfors and
7 ft •
co-workers showed that even the amorphous felodipine nanoparticles were sensitive to very small amounts o f crystalline material in seeding experiments. However, the prepared metastable states can revert to the more thermodynamically stable crystalline polymorph. Hancock and co-workers15 showed that amorphous compounds above and just below their Tg experience molecular mobility which is one of the factors responsible for the physical instability. However, utilization of different polymers to inhibit the crystallization39 and improve the release kinetics have been proposed.47 When high Tg polymeric materials are added to the crystalline drugs, the Tg of the resulting amorphous solid dispersions is increased thereby reducing the molecular mobility of the high energy states consequently inhibiting the crystallization.
2.3 Felodipine/PVP Solid Dispersions
Hwang et al.,77 studied the influence of preparation method (rotary evaporation or conventional solvent method and supercritical fluid anti-solvent precipitation) on the physicochemical characteristics of felodipine/hydroxylpropylmethylcellulose (HPMC) solid dispersions. The mean particle size of felodipine was 200-250 nm with supercritical fluid anti-solvent precipitation but was found to be irregular with voids when prepared using conventional solvent method. These properties did influence the dissolution rate to a marked extent and the authors concluded that the supercritical fluid anti-solvent precipitation method of preparation was far superior to the conventional methods. An alternative method to solvent evaporation and melting was the microwave irradiation wherein the model drug felodipine along with the polymer was placed in a beaker in the microwave chamberl.74 The microwave energy was used as a source of heat to transform the crystalline material to amorphous, instead of the conventional melting method.74,78 Many studies have been focussed upon the novel methods for preparing the amorphous forms; however, physical instability has been the major hurdle for solid dispersion techniques to reach the market.
Bhugra e t«/.,79,80 showed that a simple correlation does not exist between the molecular mobility and crystallization tendency. Zografi and co-workers81 in a series of studies has shown that even at low levels of polymeric materials the crystallization was inhibited. Neither molecular weight nor Tg of polymer had influence on the crystallization inhibition. Using spectroscopic studies these improvements were related to the
intermolecular interaction between the drug and the polymer. In another study, Aso and Yoshioka showed that molecular interactions were responsible for the nifedipine and phenobarbital-PVP amorphous solid dispersion having reduced molecular mobility and hence its physical stability. In felodipine, the polar groups C=0, Cl and NH are involved in the intermolecular interactions. With lipophilic excipients both C=0 and
48
NH interact while with hydrophilic excipients only the NH group is involved . Moreover, researchers41,54 studied the effect of particle morphology, physical state of the drug, particle size distribution and the drug polymer interactions on the felodipine dissolution mechanism.
The intermolecular interaction between the drug and the polymer differentiates the physicochemical properties of the pure drug molecules. Karavas et al.,n and Bikiaris et a/.,22 studied the potential effects of H-bonding interactions on solubility, dissolution profile and contact angle. It was established that the interactions reduce the particle size and enhance the solubility of felodipine thereby improving the dissolution rate. The contact angle measurements suggested that the hydrophilicity of the polymer did not significantly influence the dissolution rate. Moreover, at low drug concentrations (10% w/w) the release of felodipine from PVP was diffusion controlled and at high drug
9 9 9 3 83
concentrations the release was dissolution controlled. ’ ’
Vasanthavada et al.,84 showed that intermolecular interactions favour the solid solubility of drug in the polymer. The solid solubility was found to influence the physical stabilisation, that is, of the two models studied, drugs indoprofen interacts with PVP while griseofulvin does not. The interacting system was physically stable but Gris-PVP was phase separated.
Ktistis et al.,85 showed that although there is strong interaction of felodipine with PVP, these systems are only partially miscible. Interestingly, this interaction is sufficient to reduce the particle size to the nanoscale which was found to influence the dissolution rate but this reduction is dependent upon drug-polymer ratio.
Sigalas and Teberekidis86 showed based on quantum mechanical modelling and computational studies, that felodipine forms stronger hydrogen bonds with PVP than polyethylene glycol (PEG).
Kestur et al.,87 studied the effect of molecular weight and viscosity on the crystallisation kinetics of felodipine/PVP solid dispersions. Intermolecular interaction between the drug and the polymer (PVP) was not dependant on the molecular weight or different
grades of the polymer. The results indicate that molecular weight and viscosity have limited effects on the molecular mobility and thence the recrystallization of amorphous solid dispersions. Moreover the inhibition of crystal growth rate is due to reduced molecular mobility and hence it is a kinetic rather than thermodynamic one, through the formation of drug-polymer interactions.
Marsac et al.,88 studied the effect of temperature and moisture on the miscibility of felodipine/PVP amorphous solid dispersion’s and amorphous felodipine. The NH stretching peak in crystalline felodipine is centred at 3372 cm '1 while in the amorphous felodipine due to drug-drug interactions the peak is centred at 3341 cm'1 and in solid dispersion’s this peak is centred at 3290 cm"1. All compositions of felodipine/PVP are miscible at room temperature as suggested by the presence of drug/polymer interactions, the value of Tg and modelling studies.88,89 When the amorphous polymer was heated from 5 °C to 160 °C the NH peak centred at 3337 cm'1 shifted to 3350 cm'1, which is indicative of a weakening of the intermolecular interactions. This shift was found to occur close to the Tg of the studied system. However, these effects were reversible. When felodipine/PVP ASD’s was exposed to high relative humidity (atmospheric moisture or liquid water) >75% there was irreversible disruption of drug/polymer interactions and there was amorphous-amorphous phase separation. In contrast, long exposures induced crystallisation. This study shows that drug/polymer combinations are susceptible to moisture induced immiscibility.
Rumondor et al.,48 studied the influence of different degrees of moisture (54%, 75%, 84% and 94%) and compared the phase behaviour of four model systems consisting of nifedipine, droperidol, ketoprofen, indomethacin and pimozide. Drug-polymer interactions provide information on the intimacy of mixing and hence the solid-solid miscibility. Any disruption of these interactions at the expense of drug-drug interactions is indicative of amorphous-amorphous phase separation. The results of this study indicated that the crystallisation could happen either directly from the miscible dispersions or through amorphous-amorphous phase separation. The latter route was found to impose faster crystallisation as the polymer inhibitory effect is reduced. Moreover, the NH moieties were sensitive to moisture induced immiscibility while model systems with COOH moieties were less susceptible. The other factors that were found as co-influences were strength of drug water interactions and total moisture absorbed by the system.
Rumondor et al.,90 studied the impact of moisture and polymer type (PVP and HPMCAS) on the physical stability of felodipine/PVP amorphous solid dispersion’s. In the absence of moisture both the polymers were crystallisation inhibitors. When the RH>75% HPMCAS was a better polymer than PVP in inhibiting the crystallisation. However the system firstly undergoes amorphous-amorphous phase separation followed by crystallisation.
Rumondor et al.,91 studied the influence of different degrees of moisture (13% to 80%) of felodipine solid dispersions prepared from PVP and HPMCAS. The researchers showed that for <64% moisture PVP was a better polymer but for >64% HPMCAS was better because there was moisture-induced drug-polymer phase separation.
Ivanisevic49 studied the physical stability of twelve model amorphous solid dispersion’s (consisting two polymers PVP, PAA and four drugs felodipine, ketoprofen, nifedipine and indomethacin) for the period of nine to twenty-two months. The systems initially determined to be miscible were amorphous (as determined by XRD) for the entire length of the study. The initially phase separated systems crystallised within one or two months while amorphous systems (in the absence of polymers) crystallised within days. The conclusion of the study was that good physically stable dispersions were obtained with good drug polymer miscibility.
Eerdenbrugh, Baird and Taylor92,93 investigated 51 model compounds and evaluated their crystallisation tendency. These compounds were prepared using melting and rapid solvent evaporation methods. The crystallisation tendency of the model compounds from the melt was based upon molecular weight, structure and orientation of the molecules. These physicochemical properties were also descriptors of the model compounds glass forming ability (GFA) and in producing stable amorphous/glass (glass stability, GS) compounds. The results indicated clear differences in the crystallisation behaviour. Based upon the crystallisation tendency, a “crystallisation classification system” was developed and the compounds were described as being class I (rapid crystallizers or crystallization immediately after spin coating), class II (intermediate crystallizers or crystallization within 7 days of storage) or class III (slow crystallizers or no signs of crystallization even after 7 days of storage). Moreover, the results suggested that class I compounds were not ideal condidates to be adapted for the solid dispersion technology.93
inhibit the crystallisation of class I and class II model drugs from amorphous solid dispersions. The results of this investigation showed that acidic polymers were better crystallisation inhibitors for neutral and basic model compounds. Hence there is no superior polymer universally better than the others but a rationale for good selection can be based on the drug-polymer chemistry.
Konno et al.,72 demonstrated the importance of solid state and solution state stability by preparing felodipine amorphous solid dispersions (ASD’s) with different polymers (PVP, HPMC and HPMCAS). This study was carried out to understand the inhibition of recrystallization of the amorphous form from the supersaturated dissolution medium. Of the studied polymers, HPMCAS was not only found to produce higher amounts of supersaturated solution but was superior at inhibiting the crystal growth rates compared to PVP or HPMC. This study shows the importance of reconsidering the suitability of polymers to show good solid and solution state stability.
Taylor et al.,94 studied the dissolution behaviour of felodipine and indomethacin (IMC) solid dispersions prepared from three different polymers (PVP, HPMC and HPMCAS) at 25 °C and 37 °C. These two drugs were selected because they both had similar glass transition temperatures. The results of dissolution profile shows that supersatured solutions were formed for both the compounds upon dissolution at 25 °C but at 37 °C only IMC produced supersaturated solutions but not felodipine. These results implicate the complexity of dissolution behaviour (Tg is not the key factor).
Since much structural information and basic understanding is available in the literature about the felodipine/polyvinylpyrrolidone systems, this particular system will be carried further to survey the range of potential physical characterisation methods and data analytical approaches.
C
h a p t e r3
R
e s e a r c hD
e s ig n a n dM
e t h o d s3
.1 Preparation of Solid Dispersions
Various preparation methods for solid dispersions have been reported. Of the available approaches, preparation of solid dispersions involving solvents is most common6,7,10 The first step in the solvent method is to mix the drug and the polymer in a common solvent. The second step involves the removal of solvent(s) which results in the formation of a solid dispersion. The other strategies are the use of binary solvent mixtures (BSM’s) which can be solvent-solvent (both drug and the polymer are soluble) or solvent-nonsolvent (drug is soluble in both the solvents but polymer is insoluble in one of the solvent) mixtures. In this research, solvent casting and spray coating were the two pilot scale solvent methods used for the preparation of solid dispersions.
3.2 Characterization of Solid Dispersions
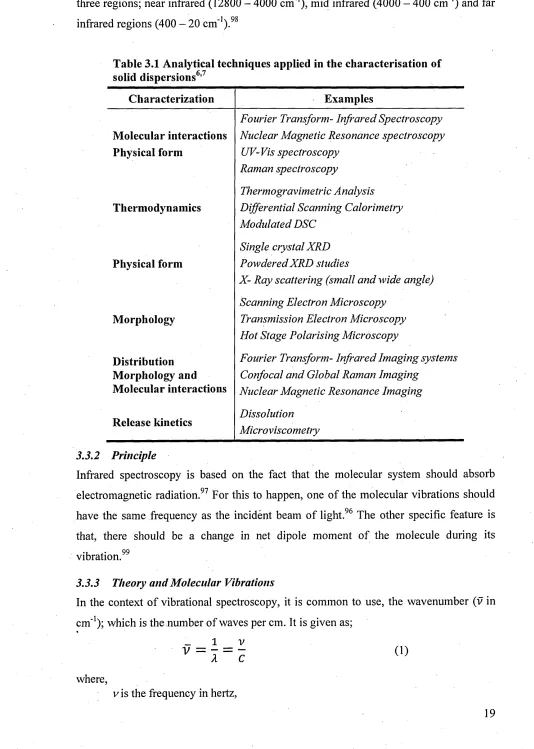
A wide range of analytical methods (shown in Table 3.1) are used to investigate the properties of the resulting amorphous solid state materials as a result of employing the solid dispersion technique; with the aim to understand the mechanism, crystallization kinetics, drug-polymer interactions, molecular mobility and thermodynamics of the molecular state.47 The most frequently employed techniques to characterize solid dispersions are Fourier Transform-Infrared Spectroscopy, powder X-Ray diffraction, Differential Scanning Calorimetry, Scanning Electron Microscopy and Dissolution techniques. However, to tailor the research, various other techniques are combined, such as Transmission Electron Microscopy, Nuclear Magnetic Resonance, Thermally Stimulated Current, etc.21,95 Of the aforementioned techniques, FT-IR has been successfully applied to study the molecular structure, polymorphism, degree of crystallinity and molecular interactions in the solid dispersion systems.11,21,71 FT-IR will be applied to understand the real time film formation, to investigate drug-polymer interactions, spatial distribution, stability of solid dispersions employed in this research.
3.3 Fourier Transform Infrared Spectroscopy
3.3.1 Introduction
Infrared radiation is an electromagnetic radiation which is beyond the visible region of the spectrum or radiation not visible to the human eye.96 IR spectra provide information on the Vibrational and rotational changes within the molecules under study and this technique is also called vibrational spectroscopy.97 The infrared radiation is divided into
three regions; near infrared (12800 - 4000 cm'1), mid infrared (4000 - 400 cm'1) and far infrared regions (400 - 20 cm'1).98
Table 3.1 Analytical techniques applied in the characterisation of /» 7
solid dispersions ’
Characterization Examples
Molecular interactions
Fourier Transform- Infrared Spectroscopy Nuclear Magnetic Resonance spectroscopy
Physical form UV-Vis spectroscopy
Thermodynamics
Raman spectroscopy
Thermogravimetric Analysis Differential Scanning Calorimetry
Physical form
Modulated DSC Single crystal XRD Powdered XRD studies
Morphology
X- Ray scattering (small and wide angle) Scanning Electron Microscopy
Transmission Electron Microscopy
Distribution
Hot Stage Polarising Microscopy
Fourier Transform- Infrared Imaging systems
Morphology and Confocal and Global Raman Imaging
Molecular interactions Nuclear Magnetic Resonance Imaging
Release kinetics DissolutionMicroviscometry
3.3.2 Principle
Infrared spectroscopy is based on the fact that the molecular system should absorb electromagnetic radiation.97 For this to happen, one of the molecular vibrations should have the same frequency as the incident beam of light.96 The other specific feature is that, there should be a change in net dipole moment of the molecule during its vibration.99
3.3.3 Theory and Molecular Vibrations
In the context of vibrational spectroscopy, it is common to use, the wavenumber (v in cm'1); which is the number of waves per cm. It is given as;
where,
vis the frequency in hertz,
C is the velocity of light (3 x 10⁸m/s), v is the wavenumber in cm'1
X is the wavelength in cm.
58
The advantage of using wavenumber is that, it is linear with the frequency or energy. ’ 59 The relationship between frequency, energy and wavelength is given by Planck’s equation which is;
(2)
where,
E is the energy,
h is the Planck’s constant (6.625 x 10'34 m2 kg s'1 or J s), v is the frequency,
C is the velocity of light
If some energy is transferred from electromagnetic radiation by absorption, the amplitude of vibrations is increased. In the simplistic harmonic model, the transitions can only occur between the adjacent levels, that is, u0tot) i, u i t0 ^ 2 and the energy associated with these levels are the same.100 If the energy of the radiation matching this difference is absorbed then the molecules are promoted from ground vibrational state to higher vibrational state which is given as;
AE = Evl
-
E
vo
(3)Moreover,
AE = hv or v = —
h (4)Substituting 3 in 4,
(5)
However, the frequency of vibration is related to the mass and the force constant and follows Hooke’s law which is;
(6)
where,
v is the vibrational frequency, k is the classical force constant,
H is the reduced mass of the two atoms f-m- ™2- )Vnii+mz/
The simplistic harmonic model is best suited for diatomic molecules and for molecules that do not dissociate. For polyatomic and dissociating molecules a good approximation would be to consider the bond behaving as an anharmonic oscillator.101 If there are N numbers of atoms in the molecule, there will be 3N degrees of freedom.97 The number of vibrations99 is described based on a three fold set of co-ordinate axes known as normal modes of vibration. Subtracting the translational and rotational motions of the molecule we get 3N-6 normal modes of vibration for non-linear molecule and 3N-5 for linear molecule.97 These vibrations can involve either stretching (change in bond length) or bending (change in bond angle). There are two types of stretching; symmetrical and antisymmetrical stretching and four types of bending vibrations which are rocking, scissoring, wagging and twisting.
3.3.4 Infrared Spectrum
An infrared spectrum is the plot of absorbance vs. wavenumber. A model infrared spectrum of felodipine is shown in Figure 3.1
P s S
CJ a
P
as u o
Of)
pfi
<
1.2
0.6
0.0
5 0 0 4 0 0 0 3 5 0 0 3 0 0 0 2 5 0 0 2 0 0 0 1 5 0 0 1 0 0 0
[image:31.629.38.562.45.780.2]Wavenumber (cm1)
Figure 3.1. Model representation of infrared spectrum of felodipine
3.3.5 Instrumentation
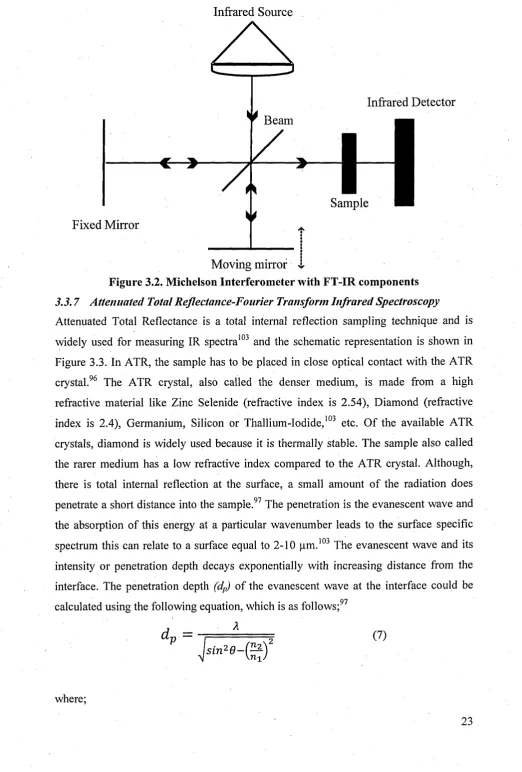
The significant development of FT-IR spectrometers began with the introduction of the Michelson interferometer (Figure 3.2) and, requires the Fourier transform mathematical procedure to convert the interference pattern to spectra generated by the interferometer.102 These developments outweighed the application of dispersive and
grating IR spectrometers. FT-IR spectrometers employ Globar or Nernst sources in the mid-IR region and widely used detectors being DTGS (Deuterated Tri-Glycine Sulfate) in an alkyl halide window resistant to temperature changes and for more sensitive work the MCT (Mercury-Cadmium-Telluride) is used, however, it has to be cooled with liquid nitrogen.96
The radiation from the infrared source is directed on to a semi-reflecting beam-splitter made of germanium or iron-oxide coated onto a IR transparent material such as potassium bromide or caesium iodide.96 The beam splitter reflects approximately half the radiation to the moving and half to the fixed mirror.102 The beams then return to the beam splitter where they interfere and are partially reflected or transmitted again. The beam returning to the source is of rare interest while the beam travelling perpendicular to the input beam is measured.102 The two beams then recombine to produce an interference pattern, specific wavelengths within this beam will be constructive (in- phase) or destructive (out of phase) interfered depending on the path difference. At the zero path difference, all wavelengths will be in-phase. This result in the interferogram which is converted to a single beam spectrum by means of a Fourier transform mathematical function.
3.3.6 Advantages of FT-IR over traditional instruments
• Jacquinot or throughput advantage:98,102 FT-IR doesn’t employ any slits and the resolution is defined by the path length of the moving mirror.
• Felgett or multiplex advantage:98,102 the detector observes all the frequencies concurrently, and the time taken is considerably reduced and the signal to noise ratio is increased.
• Connes advantage:98,102 the accuracy of the Wavenumber measured is enhanced due to the internal He-Ne reference lasers which not only monitor the movement of the mirrors, but also calibrates the wavelength.
The interferometer modulates the IR frequency differently thereby stray light impact is reduced.98
Infrared Source
Infrared Detector ^ Beam
Sample Fixed Mirror
[image:33.620.43.566.25.799.2]Moving mirror i
Figure 3.2. Michelson Interferometer with FT-IR components
3.3.7 Attenuated Total Reflectance-Fourier Transform Infrared Spectroscopy
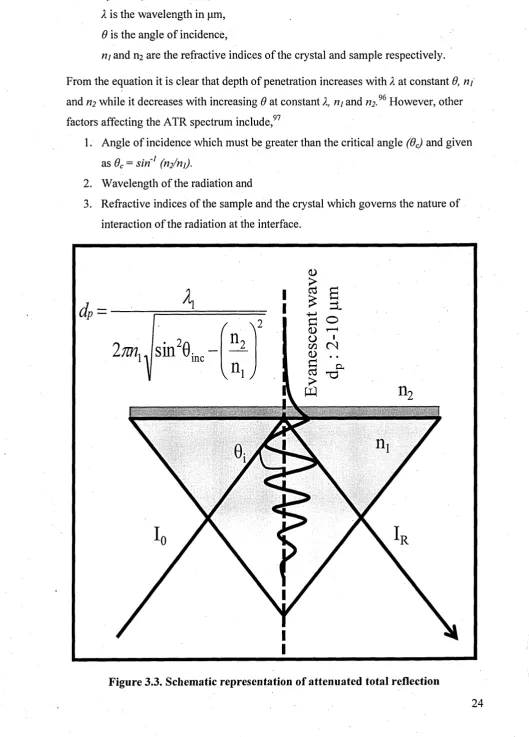
Attenuated Total Reflectance is a total internal reflection sampling technique and is widely used for measuring IR spectra103 and the schematic representation is shown in Figure 3.3. In ATR, the sample has to be placed in close optical contact with the ATR crystal.96 The ATR crystal, also called the denser medium, is made from a high refractive material like Zinc Selenide (refractive index is 2.54), Diamond (refractive index is 2.4), Germanium, Silicon or Thallium-Iodide,103 etc. Of the available ATR crystals, diamond is widely used because it is thermally stable. The sample also called the rarer medium has a low refractive index compared to the ATR crystal. Although, there is total internal reflection at the surface, a small amount of the radiation does penetrate a short distance into the sample.97 The penetration is the evanescent wave and the absorption of this energy at a particular wavenumber leads to the surface specific spectrum this can relate to a surface equal to 2-10 pm.103 The evanescent wave and its intensity or penetration depth decays exponentially with increasing distance from the interface. The penetration depth (dp) of the evanescent wave at the interface could be
0 7
calculated using the following equation, which is as follows;
d
A (7)where;
dp is the penetration depth in pm, X is the wavelength in pm, 6 is the angle of incidence,
nj and ni are the refractive indices of the crystal and sample respectively. From the equation it is clear that depth of penetration increases with X at constant 6, ni and ri2 while it decreases with increasing 6 at constant X, ni and ri2.96 However, other
factors affecting the ATR spectrum include,97
1. Angle of incidence which must be greater than the critical angle (6C) and given as 6C = s in 1 (n2/ni).
2. Wavelength of the radiation and
3. Refractive indices of the sample and the crystal which governs the nature of interaction of the radiation at the interface.
O
sin 0-
me2m
-Figure 3.3. Schematic representation of attenuated total reflection
[image:34.619.31.561.42.780.2]3
.4 Spectroscopic Imaging
3.4.1 Introduction
Spectroscopic imaging is also known as chemical imaging or hyperspectral imaging. Infrared microspectroscopy using prism monochromator was made available during the 1940’s104, but the performances of these instruments were marginal.105 The first true chemical imaging104,105 was reported in the mid 1990’s. With the imaging investigations, apart from the conventional spectroscopic benefits, the distribution and location of the individual components within the mixture can be established.106,107 These advancements enhanced the chemical characterization of samples on a microscopic scale, its morphological form (typically polymorphs and hydrates).106,108,109 Thousands of infrared spectra with near-diffraction limited spatial resolution and moderate spectral resolution can be acquired in minutes depending on the instrumentation type.105 More
107 recently applications have involved real time analysis o f Complex systems.
The aforementioned vibrational spectroscopic imaging can be approached by single point measurements or mapping or imaging. In the single-point measurements, firstly, the sample is visually inspected for desirable features using optical microscopy.105 Then the spatial localization is accomplished by restricting the incident radiation at the sample plane.108 This is achieved by placing an opaque mask with an aperture of controlled size.108,110 Spectra are then acquired using single element detector. The microscopic stage is then moved to record spectra from other regions.104 Precise positioning, accuracy and longer time of analysis make this approach undesirable.108'110 The application of infrared microscopy, when coupled to a dispersive instrument, is severely hampered by the low amount of energy passing through the aperture onto the sample from the grating. This can be overcome by the use of an interferometer where all wavelengths of light are measured simultaneously.105,108,111,112 This technique involves sequential measurement of neighbouring points one at a time.105,106,113 If these measurements are done in one direction (x-axis), it is termed as line mapping.104,108,114,115 Moreover, it is possible to move and measure the spectra in both x, y directions. Although this resembles imaging measurements, since the spectra are not acquired using array detectors it is still a mapping technique.105,108,110
Imaging utilizes a focal plane array (FPA) detector, were the radiation from the sample plane is segmented at the detector plane106,108 and is referred to as hyperspectral
imaging.105,108,109 FPA detectors enable one to acquire thousands of spectra simultaneously and have become increasingly popular in the recent years.104
Spectroscopic or hyperspectral imaging can be accomplished by measuring the mid- infrared, near-infrared or the Raman spectrum.104 In near infrared and Raman, the signal at a given wavelength is recorded at each pixel.104,105 With the NIR chemical imaging, the light is passed to a monochromator or liquid crystal tunable filter (LCTF).105 The radiation is then passed onto the sample and the signal from the sample is acquired by the array detector. The image from one wavelength is measured at all pixels simultaneously. The wavelength is then changed and the process is repeated until all the wavelengths are measured.
The monochromator is also located before the sample in Raman Imaging.105 With Raman imaging, the signal to noise ratio is good, therefore longer integration times are required, also, collection times are longer as a typical Raman dispersion element will only collect data covering a ‘spectral window’ of around 600 cm'1 at a resolution of 2 cm'1. In the NIR imaging, the signal to noise ratio is low but the images can be acquired rapidly. The spectral resolution in both the measurements is determined by the optics (band pass of the monochromator or the filter).
In mid-infrared imaging,104,105,108,116 the array detectors are coupled to an interferometer. Interferogram from the different regions are acquired simultaneously, after which it is Fourier transformed to yield the desired hyperspectral data.
3.4.2 Infrared imaging background
Infrared imaging utilizes a focal plane array (FPA) detector and allows measurement of spatially resolved images117,118 which carries spectral information.105 Chemical imaging combines the benefits of digital imaging and the spectroscopy. The driving force behind this technology jump is the availability of multi-channel detectors105 and the development of efficient chemometric tools.108"110,117,119,120 The acquisition of chemical images using linear array of detector is called pushbroom approach whereas acquisition using 2-D array detectors is called quilting or mosaicing.105
3.4.3 Instrumentation
reflective Schwarzschild objective is used.105 Radiation selection optics are designed for flexibility in switching between visible and infrared light. That is, the regions of interest can be selected using visible light source while data collection or scanning is carried out using infrared light. Moreover, to increase the spot size and spatial homogeneity/field of view (FOV) diverging lenses like lightly sanded KRS-5 are used.105,108
The infrared microscope is interfaced to a Michelson interferometer for the imaging studies and requires the Fourier transform mathematical procedure to convert the interference pattern (intensity path difference from the static and moving mirror) to spectra generated by the interferometer.102 There are two scan modes available, continuous scan and step scan. If the moving mirror is scanned at a constant rate between data collection points it results in continuous scan process and often used for steady state measurements. When the moving mirror is stopped and dithered at fixed distances over the length of the data collection sweep, the collected data can be recombined to form an interferogram and this process is known as ‘step-scan\105,108 Step scan mode will be a powerful tool for studying spectroscopic changes occurring on the nanosecond or microsecond time scale. The primary advantage of operating interferometer in continuous scan mode is reduced instrument cost (no additional hardware or software modifications required) and increased data collection efficiency
I HR
(mirror stabilisation time is eliminated).
The infrared microscopes and interferometer are then assembled to the multichannel or large format array detectors arranged in two dimensional grid patterns.105,108 The earliest FPA detectors were made from indium antimonide (InSb) but were replaced quickly due to low spatial area focus (500 pm x 500 pm) and high cut off (1800 cm'1). These were replaced with mid-IR mercury-cadmium-telluride (HgCdTe) focal plane array (MCT-FPA) detectors. The imaging FPA detectors operate in the photovoltaic (PV) mode rather than the conventional photoconductive mode MCT detectors. Consequently, the cut-off wavenumber for the PV-MCT is at about -850 cm'1 and MCT detectors operate effectively at -20 °C, hence requires cryogenic cooling.105
the interferometer. At each trigger, the pixel responses are read in snapshot mode.105 That is, all the pixel responses are read simultaneously, processed and transferred to the data system to provide an interferogram. The interferogram is then Fourier transformed. The chemical image can be viewed as a 3D block termed as hypercube comprising of two spatial (x, y) and one wavelength (z) dimension104,110,122 (Figure 3.5). Each data point in the cube provides spectral information, and the process of acquiring the image is called as hyperspectral imaging. Single data point in the image is termed as the pixel (ID) which yields spectral information while the collection of pixels represents image plane or channel (2D) and carries information on spatial and distribution patterns within the selected system.104,115,123
A variety of sampling techniques have been utilised in spectroscopic imaging experiments like transmission or external reflection like reflection-absorption, specular reflectance or diffuse reflectance techniques and attenuated total reflection sampling modes are utilised. However, these choices depend upon nature and thickness of the sample.105,108
Binoculars
Multichannel FPA “" S . Detector
Camera
FTIR Spectrometer
View/Scan Selection Optics
Shared Aperture Optics
Reflection or Transmission Illumination Selection Optics
Schwarzschild Objective
T>
Sample
Transmission
[image:38.628.16.564.1.787.2]Mode Condenser Visible Radiation
Figure 3.4. Schematic representation of FTIR chemical imaging
Figure


Related documents
A status report on the phenomenology of black holes in loop quantum gravity: Evaporation, tunneling to white holes, dark matter and gravitational waves.. Aur´ elien Barrau, 1, ∗
Random effect model has been examined the influence of investment, government expenditure and inflation on economic evolution of SAARC countries.. The study also explained
The task for the radiologists was to mark the first 10 images returned as relevant or irrelevant for every search query or, if the first 10 results featured no relevant items,
A/C mode: Assist Control mode; ADL score: Activities Daily Living score; AECOPD: Acute Exacerbations of Chronic Obstructive Pulmonary Disease; BMI: Body Mass Index; COPD:
– In a hiding under (adaptive) chosen stegotext attack (HID-CSA), the challenger randomly flips a coin, and depending on the result decides to encrypt the submitted hiddentext or
Stephen Balsky at the above address. A case of a 74-year-old woman complaining of pain, loss of strength and diminished range of motion in her left wrist is presented. These
All concerns are for- warded to the trust director of safety and risk who monitors patterns of concerns, but also forwards more complex concerns to a team of six trust directors,
In both bracket slot sizes, the measured moments generated by rectangular archwires were higher compared to the square archwires, due to torque loss.. archwire with nominal
