ARMITAGE, Christopher J and ARDEN, Madelynne A <http://orcid.org/0000-0002-6199-717X>
Available from Sheffield Hallam University Research Archive (SHURA) at: http://shura.shu.ac.uk/12127/
This document is the author deposited version. You are advised to consult the publisher's version if you wish to cite from it.
Published version
ARMITAGE, Christopher J and ARDEN, Madelynne A (2016). Enhancing the Effectiveness of Alcohol Warning Labels With a Self-Affirming Implementation Intention. Health psychology, 35 (10), 1159-1163.
Copyright and re-use policy
See http://shura.shu.ac.uk/information.html
Enhancing the Effectiveness of Alcohol Warning Labels With a Self-Affirming Implementation Intention
Christopher J. Armitage
University of Manchester
Madelynne A. Arden
Sheffield Hallam University
Correspondence to:
Christopher J. Armitage
Manchester Centre for Health Psychology, School of Psychological Sciences
Manchester Academic Health Science Centre, University of Manchester
Coupland Street, Oxford Road
Manchester, M13 9PL, UK
E-mail: [email protected]
Tel: +44 (0) 161 275 2556
Fax: +44 (0) 161 275 2623
Author note. The authors declare no conflict of interest. We would like to thank the Alcohol
Research UK for funding Study 1 and Claire Wolstenholme for her help with collecting and entering
the data for Study 1 and to Rebecca Smith for her help with collecting and entering the data for Study
Brief Report: Enhancing the Effectiveness of Alcohol Warning Labels With a
Self-Affirming Implementation Intention
Objective. Excess alcohol consumption extorts significant social and economic costs that are
increasing despite the presence of mandatory warning labels on packaged alcoholic
beverages. We used a novel approach by adding a brief statement based on self-affirmation
theory (Steele, 1988) to alcohol warning labels.
Method. In two studies (N = 85; N = 58), we randomized regular wine drinkers recruited
from University campuses to complete a wine pouring task with bottles that had standard
labeling, or bottles that added a self-affirming implementation intention to the standard
labeling. Alcohol consumption, behavioral intention and self-efficacy were measured
pre-manipulation; message acceptance was measured post-pre-manipulation; and alcohol
consumption, behavioral intention and self-efficacy were measured again at follow-up.
Results. In both studies, the self-affirming implementation intention significantly reduced
subsequent alcohol consumption (ds = 0.70 and 0.91, respectively). However, message
acceptance, behavioral intention, and self-efficacy did not significantly mediate the observed
effects.
Conclusions. Self-affirming implementation intentions augmented the effect of alcohol
warning labels to reduce subsequent alcohol consumption, but – consistent with the broader
self-affirmation literature – it was not clear what mediated the effects. Further research is
required to examine whether self-affirming implementation intentions could augment the
effects of other kinds of public health-related labeling.
KEY WORDS: brief intervention; self-affirmation; health behavior change; implementation
Brief Report: Enhancing the Effectiveness of Alcohol Warning Labels With a
Self-Affirming Implementation Intention
Excess alcohol consumption extorts significant social and economic costs that are
increasing despite the presence of mandatory warning labels on packaged alcoholic
beverages. Research shows that people react defensively to the information on the labels
meaning that their alcohol consumption remains unaffected (Andrews, 1995). According to
self-affirmation theory (Steele, 1988), defensiveness arises because people are motivated to
defend their global sense of self-worth, which is threatened by alcohol warning labels.
However, accumulated empirical evidence demonstrates that affirming the self leads
consistently to improvements in the way in which threatening health messages are processed
and to increases in people’s motivation to act in accordance with the message (Epton, Harris,
Kane, van Koningsgruggen, & Sheeran, 2015).
A self-affirming implementation intention has been developed that significantly
reduces alcohol consumption (Armitage, Harris, & Arden, 2011; Armitage, Rowe, Arden, &
Harris, 2014) and could be adapted for use on alcohol warning labels. The self-affirming
implementation intention works on the principles that: (a) specifying the critical situation
“feeling threatened or anxious” increases the salience of that critical situation when it is
aroused by an alcohol warning label, and (b) linking “feeling threatened or anxious” to an
appropriate affirming response (e.g., “thinking about the things that are important to me”)
ensures that the affirming response is triggered automatically (e.g., Gollwitzer, 1993).
Two studies to date show that when adults (Armitage et al., 2011) and adolescents
(Armitage et al., 2014) are asked to form self-affirming implementation intentions,
subsequent alcohol consumption is significantly reduced. Of particular relevance in the
present context is that significant reductions in alcohol consumption occurred even when the
and was instead ticked or circled (Armitage et al., 2011; Armitage et al., 2014). The
implication is that even minimal processing of self-affirming implementation intentions, such
as might occur when reading the label on a wine bottle, might reduce alcohol consumption.
The principal aim of the present research is to see whether standard warning
information can be augmented with a self-affirming implementation intention to bring about
reduced alcohol consumption. A second aim was to address limitations in Armitage et al.’s
(2011, 2014) operationalization of message acceptance and motivation as potential mediators
of the effects of self-affirming on alcohol consumption.
Two studies were designed to test the hypotheses that: (a) alcohol warning labels
augmented with a self-affirming implementation intention would significantly decrease
subsequent alcohol consumption, and (b) any effect of self-affirmation on alcohol
consumption would be mediated by greater message acceptance and increased motivation.
Method
Participants
Regular wine drinkers were invited to take part in a study on alcohol consumption.
Participants were recruited from University campuses and via advertisements placed on
student PC screensavers and in staff e-newsletters, and made appointments to attend the
laboratory via e-mail. Eighty-five agreed to participate in Study 1 (Table 1) and fifty-eight
people agreed to participate in Study 2 (Table 2). Participants were paid £5 (circa US$7.50)
in high street vouchers (Study 1) or received course credit (Study 2). The study received full
ethical approval from the appropriate University research ethics committee. Assuming .80
power and alpha = .05 we required at least 58 participants in total at follow-up to test
repeated measures differences between intervention and control groups based on the average
effect size of implementation intentions, namely, d = 0.65 (Gollwitzer & Sheeran, 2006).
conditions. Participants were blind with respect to condition.
Design and Procedure
On arrival at the laboratory, participants were provided with information about the
study, reminded of their right to withdraw, and asked to sign a consent form. Participants
were then asked to complete a manipulation questionnaire. On completion of the
pre-manipulation questionnaire participants were led to an adjacent room in which there was a set
of written instructions, a wine bottle and four empty wine glasses. Participants were
presented with a standard 750ml wine bottle that appeared to contain white wine and
instructed to read the labels on the bottle. In fact, the bottle was filled with water colored
with three drops of yellow food coloring to resemble a light colored white wine (e.g., Pinot
Grigio). The labels on the back of the wine bottles included standard UK government
information about alcohol intake; the experimental label additionally included a
self-affirming implementation intention: “If I feel threatened or anxious, then I will think about
the things that are important to me” (supplemental material; Armitage et al., 2011, 2014).
Participants were instructed to pour what they thought would be a safe amount to
drink in a single session into one (or more) of four empty wine glasses. The wine glasses and
bottles were weighed before and after the experiment. Given that 1g of water equals 1ml of
water and that there are 9 units of alcohol in a 750ml bottle of wine (12% alcohol by
volume), then: Units poured = weight of water (g) x (9/750). The correlation between the
amount poured into the glasses and the amount remaining in the bottle was, r = 0.98, p <
.001, and so the number of units poured into the glass(es) was used in subsequent analyses.
After the task participants completed the post-manipulation questionnaire. Following
completion of the post-manipulation questionnaire, participants were invited to provide
contact details. All participants chose to be contacted by e-mail and were sent an online
participants’ anonymized data and all participants were successfully contacted.
Measures
Pre-manipulation questionnaires measured age, gender, ethnicity, alcohol
consumption, and motivation. Alcohol consumption was measured using an adapted version
of the timeline follow-back technique (Sobell & Sobell, 1992). Behavioral intention was
measured with three items, including: “I intend to drink within [safe levels, Study
1]/[government recommended levels, Study 2] definitely do not (1)-definitely do (7).”
Internal reliability was high in both Study 1 ( = .94) and Study 2 ( = .81). Self-efficacy
was measured with three items, including: “How confident are you that you will be able to
drink within [safe levels, Study 1]/[government recommended levels, Study 2]? not very
confident (1)-very confident (7).” Cronbach’s indicated high internal reliability in both
Study 1 ( = .88) and Study 2 ( = .86).
Post-manipulation questionnaires assessed message acceptance. In Study 1, message
derogation (Witte, 1994) was measured with four items, e.g., “The information on the
alcohol label was exaggerated strongly disagree (1)-strongly agree (7),” and anger (Dillard
& Peck, 2001) also consisted of four items, e.g., “The information on the alcohol label made
me feel angry not at all (1)-very much (7).” Cronbach’s indicated high internal reliability
(s = .88 and .95, respectively). In Study 2, message acceptance was operationalized in
terms of perceived expertise (2 items e.g., expert not at all [1]-very [7], = .84) and
perceived credibility (3 items e.g., reliable not at all [1]-very [7], = .74; Wu & Shaffer,
1987); and message utility (4 items e.g., useful not at all [1]-very [7], = .71) and message
satisfaction (6 items e.g., interesting not at all [1]-very [7], = .54, Moon & Nass, 1996).
Follow-up questionnaires were administered online one month post-intervention and
included repeat measures of alcohol consumption, behavioral intention (Study 1 = .89; Study 2
Results
MANOVA and chi-square were used to test whether the intervention and control
groups were equivalent at baseline. All the multivariate and univariate tests were
nonsignificant (Tables 1 and 2), showing equivalence between groups at baseline in terms of
age, gender, ethnicity, behavioral intention, self-efficacy, and alcohol consumption.
MANOVA was used to test whether intervention and control groups differed
post-manipulation in terms of the amount of wine poured and message acceptance. In both
studies, there were no significant main effects of condition, ps > .28; no significant main
effects of gender, ps > .28; and no significant condition x gender interactions, ps > .28.
MANCOVA was used to test whether intervention and control groups differed in
behavioral intention, self-efficacy and the amount of alcohol consumed at follow-up
controlling for baseline measures of each. There was a significant multivariate main effect of
condition in both Study 1, F(3, 71) = 3.69, p = .02, p2 = .13, and Study 2, F(3, 49) = 3.74, p
= .02, p2 = .19. However, there were no significant main effects of gender, F
Study 1(3, 71) =
1.07, p = .37, p2 = .04; F
Study 2(3, 49) = 1.15, p = .34, p2 = .07, and no condition x gender
interactions, FStudy 1(3, 71) = 1.64, p = .19, p2 = .06; FStudy 2(3, 49) = 1.02, p = .39, p2 = .06.
Scrutiny of the univariate tests revealed no significant differences in behavioral
intention, FStudy 1(1, 73) = 0.78, p = .38, p2 = .01; FStudy 2(1, 51) = 1.76, p = .19, p2 = .30;
and self-efficacy, FStudy 1(1, 73) = 0.29, p = .59, p2 = .004; FStudy 2(1, 51) = 1.51, p = .22, p2
= .03, at follow-up in either study. However, participants exposed to the self-affirming label
were consuming significantly fewer units of alcohol at follow-up than those exposed to the
standard label in both Study 1, F(1, 73) = 8.86, p < .01, p2 = .11, d = 0.70 and in Study 2,
F(1, 51) = 10.59, p < .01, p2 = .17, d = 0.91.
Discussion
theory (Steele, 1988) to alcohol warning labels. In two studies, we showed that engaging in a
wine pouring task and being exposed to a self-affirming implementation intention led to
significant decreases in alcohol consumption at follow-up. Given the brevity of the
intervention and the multiple domains in which it might be deployed (e.g., cigarette
packaging), the present findings are encouraging and warrant further investigation.
Consistent with the broader literature on self-affirmation theory (e.g., Epton et al.,
2015) and the self-affirming implementation intention (Armitage et al., 2011; 2014), we were
unable to identify significant mediators of the observed effects, which is potentially
problematic for self-affirmation theory (Steele, 1988). One possible avenue for further
research might be to consider whether implicit – as opposed to explicit – measures mediate
the effects of self-affirming. Another possible avenue is to consider whether motivation
provides an adequate explanation of the effects of affirming; one possibility is that
self-affirming might prompt self-regulatory mechanisms, as opposed to behavioral intention and
self-efficacy. Consistent with this view, recent research suggests that the effects of
implementation intentions on behavior change can at least partly be explained by changes in
self-monitoring (Armitage, in press).
Although the present research takes the literature on self-affirmation forward in some
important respects, it is important to take note of some potential limitations. First,
participants were invited to take part in a laboratory task that potentially lacked ecological
validity when compared with a regular shopping experience and it would be valuable to test
the effects of self-affirming implementation intentions in a more naturalistic setting.
Nevertheless, it is notable that participants in both the intervention and control conditions
poured out similar amounts of wine, which implies that the wine pouring task might not be
necessary to exert the observed effects. Second, although the effects of the manipulation
sustained over a period of time longer than a month. It is worth noting, however, that greater
ecological validity and longer follow-up periods may end up being confounded with repeated
exposures to the intervention. Third, alcohol consumption was measured using self-report
and it would be valuable to obtain reliable and valid objective data about the main outcome
measure. However, we have confidence in the reliability and validity of our dependent
variable because, when used in similar situations to the present study, self-reports have been
shown to agree 97.1% with biological measures (for a discussion, see Armitage et al., 2011;
2014). Fourth, we did not include a manipulation check and in future research it would be
valuable to ascertain whether participants reported giving increased thought to
personally-salient goals/outcomes as a result of forming a self-affirming implementation intention.
Two studies showed that standard information augmented with a self-affirming
implementation intention was capable of significantly reducing alcohol consumption.
Although it is not yet clear which variables mediate the observed effects, the present research
demonstrates potential for deploying a simple intervention with considerable public health
“reach” both in reducing alcohol consumption specifically and health behaviors more
References
Andrews, J. C. (1995). The effectiveness of alcohol warning labels - a review and extension.
American Behavioral Scientist, 38, 622-632. doi: 10.1177/0002764295038004011
Armitage, C. J. (in press). Field experiment of a very brief worksite intervention to improve
nutrition among health care workers. Journal of Behavioral Medicine.
Armitage, C. J., Harris, P. R., & Arden, M. A. (2011). Evidence that self-affirmation
reduces alcohol consumption. Health Psychology, 30, 633-641.
Armitage, C. J., Rowe, R., Arden, M. A., & Harris, P. R. (2014). A brief psychological
intervention that reduces adolescent alcohol consumption. Journal of Consulting and
Clinical Psychology, 82, 546-550. doi: 10.1037/a0035802
Dillard, J. P., &Peck, E. (2001). Persuasion and the structure of affect: Dual systems and
discrete emotions as models. Human Communication Research, 27, 38–68.
Epton, T., Harris, P. R., Kane, R., van Koningsbruggen, G. M., & Sheeran, P. (2015). The
impact of self-affirmation on health-behavior change: A meta-analysis. Health
Psychology, 34, 187-196. doi: 10.1037/hea0000116
Gollwitzer, P. M., & Sheeran, P. (2006). Implementation intentions and goal achievement.
Advances in Experimental Social Psychology, 38, 69-119. doi: 10.1013/S0065-2601
Moon, Y. M., & Nass, C. (1996). How “real” are computer personalities? Communication
Research, 23, 651-674. doi: 10.1177/009365096023006002
Sobell, L. C., & Sobell, M. B. (1992). Timeline follow-back. In R. Z. Litten & J. P. Allen
(Eds.), Measuring alcohol consumption (pp. 41-72). Totowa, NJ: Humana Press.
Steele, C. M. (1988). The psychology of self-affirmation. In L. Berkowitz (Ed.), Advances in
experimental social psychology (Vol. 21, pp. 261-302). New York, NY: AP.
Wu, C. H., & Shaffer, D. R. (1987). Susceptibility to persuasive appeals as a function of
source credibility and prior experience with the attitude object. Journal of Personality
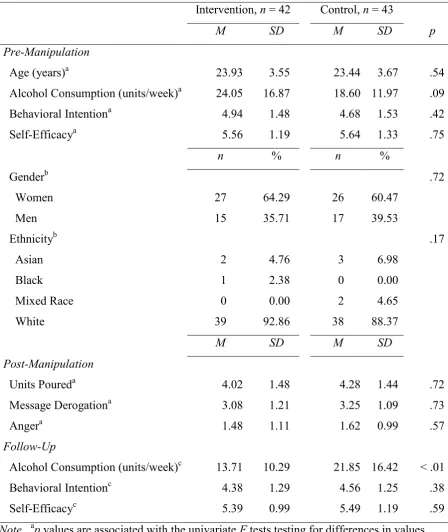
Table 1
Effect of the Self-Affirming Implementation Intention (Study 1)
Intervention, n = 42 Control, n = 43
M SD M SD p
Pre-Manipulation
Age (years)a 23.93 3.55 23.44 3.67 .54 Alcohol Consumption (units/week)a 24.05 16.87 18.60 11.97 .09 Behavioral Intentiona 4.94 1.48 4.68 1.53 .42 Self-Efficacya 5.56 1.19 5.64 1.33 .75
n % n %
Genderb .72
Women 27 64.29 26 60.47
Men 15 35.71 17 39.53
Ethnicityb .17
Asian 2 4.76 3 6.98
Black 1 2.38 0 0.00
Mixed Race 0 0.00 2 4.65
White 39 92.86 38 88.37
M SD M SD
Post-Manipulation
Units Poureda 4.02 1.48 4.28 1.44 .72 Message Derogationa 3.08 1.21 3.25 1.09 .73 Angera 1.48 1.11 1.62 0.99 .57 Follow-Up
Alcohol Consumption (units/week)c 13.71 10.29 21.85 16.42 < .01 Behavioral Intentionc 4.38 1.29 4.56 1.25 .38 Self-Efficacyc 5.39 0.99 5.49 1.19 .59 Note. ap values are associated with the univariate F tests testing for differences in values between intervention and control conditions. bp values are associated with the chi-square tests for differences in between intervention and control conditions. cM values are “raw” and not adjusted for baseline; p values are associated with the univariate F tests testing for
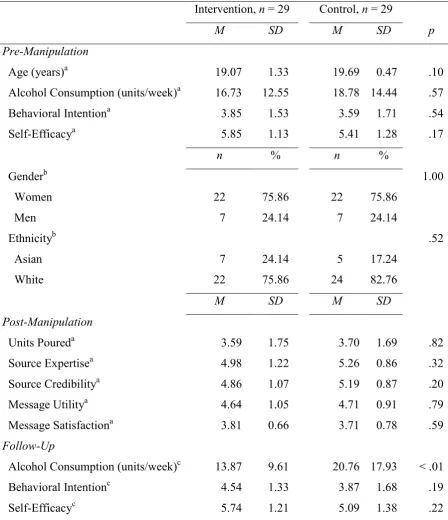
Table 2
Effect of the Self-Affirming Implementation Intention (Study 2)
Intervention, n = 29 Control, n = 29
M SD M SD p
Pre-Manipulation
Age (years)a 19.07 1.33 19.69 0.47 .10 Alcohol Consumption (units/week)a 16.73 12.55 18.78 14.44 .57 Behavioral Intentiona 3.85 1.53 3.59 1.71 .54 Self-Efficacya 5.85 1.13 5.41 1.28 .17
n % n %
Genderb 1.00
Women 22 75.86 22 75.86
Men 7 24.14 7 24.14
Ethnicityb .52
Asian 7 24.14 5 17.24
White 22 75.86 24 82.76
M SD M SD
Post-Manipulation
Units Poureda 3.59 1.75 3.70 1.69 .82 Source Expertisea 4.98 1.22 5.26 0.86 .32 Source Credibilitya 4.86 1.07 5.19 0.87 .20 Message Utilitya 4.64 1.05 4.71 0.91 .79 Message Satisfactiona 3.81 0.66 3.71 0.78 .59 Follow-Up
Alcohol Consumption (units/week)c 13.87 9.61 20.76 17.93 < .01 Behavioral Intentionc 4.54 1.33 3.87 1.68 .19 Self-Efficacyc 5.74 1.21 5.09 1.38 .22 Note. ap values are associated with the univariate F tests testing for differences in values between intervention and control conditions. bp values are associated with the chi-square tests for differences
in between intervention and control conditions. cM values are “raw” and not adjusted for baseline; p