The Effect of the Implementation of Six Sigma in
Reducing Obsolete Stock and Controlling Stock
Inventory at a Flavor Manufacturing Company:
A Case Study
P. Kholopane
Abstract - In many business environment the Six Sigma
culture is a way of life through a systematic effort to introduce a uniform approach and set of techniques for continuous quality improvement. It addresses waste and defects reduction, lowering of costs leading to an improved customer loyalty and a way to achieve strategic business results.
The purpose of this paper is to establish how the implementation of Six Sigma can contribute by minimising the cost of write offs, and by better management of stock inventory. It discusses how team work can positively identify bottlenecks, unnecessary waste, working towards improving manufacturing processes in order to benefit the organisation’s production input.
The study is carried out at a flavour company in South Africa. Every year the company write off more than a million South African Rands (ZAR) worth of products due to obsolete raw materials, wrong safety stock levels, waste and false new wins. The paper demonstrates how the application of Six Sigma can be done to reduce waste and save costs by identifying slow moving and redundant sock which can be extended into other sub products instead of them being scrapped, thus reducing stock write off and making the company competitive and productive.
Key words: Six Sigma, cost reduction, productivity, slow moving material, manufacturing
I. INTRODUCTION
The food flavour manufacturing industry is an industry that looks for cost saving methods and is continuously looking at improving the quality of their products and satisfying their customers.
Pule Aaron Kholopane is a Senior lecturer at the University of Johannesburg (UJ), Faculty of Engineering and the Built Environment (FEBE). He works for the Department of Quality and Operations Management. Tel: +27714335364, Email: [email protected]
The industry faces obsolescence of raw materials due to, wrong inventory, not managing the inventory levels as efficiently as they should as well as competitors introducing same quality materials at low cost prices.
According to Evans (2008) superior quality, consistent service, and competitive pricing are just an entry to the sales game.
Porter (1980), states that competitors usually play the strategy game according to different rules, making it harder to respond effectively. Therefore in order to compete, it is important to improve operational methods to ensure that they are effective to support implemented quality and cost reduction initiatives thus ensuring more productivity.
Continuous improvement is an ongoing effort to improve products, services or processes. These efforts can seek “incremental” improvement over time or “breakthrough” improvement all at once, as stated by Adams et al (2002). Evans (2008) and Warner (2013) points out that one of the most widely used tools for continuous improvement is a four-step quality model the plan, do, check, act (PDCA) cycle, also known as Deming Cycle or Shewhart Cycle as explained below.
Plan: Identify an opportunity and plan for change.
Do: Implement the change on a small scale.
Check: Use data to analyze the results of the change and determine whether it made a difference.
Act: If the change was successful, implement it on a wider scale and continuously assess your results. If the change did not work, begin the cycle again.
II. SIX SIGMA
The name Six Sigma, originally developed by Motorola for its manufacturing operations, relates to the goal of achieving low rates of defective output by developing processes whose mean output for a performance measure is +/- six standard deviations (sigma) from the limits of the design specifications for the service or product, Lee J. Krajewski et al (2013).
Six Sigma is a set of statistically-based quality control methodologies that are used to identify and reduce variations and defects in the process, and finally reach a goal as near perfection (Six Sigma, 2011). Sigma is a Greek letter that stands for the standard deviation from a statistical population. The higher the sigma level, the less the defects exist. The processes of most companies are around sigma level three or four, which means the defects in the process are between 6,210 to 66,807 out of one million opportunities; while, Six Sigma represents 3.4 defects per million opportunities, which is almost the perfect process. (George, 2002).
Six Sigma can be defined in different ways. Adams et al (2002) defines Six Sigma as a customer based approach realizing that defects are expensive. Fewer defects mean lower costs and improved customer loyalty. The lowest cost, high value producer is the most competitive provider of goods and services Evans (2008). Six Sigma is a way to achieve strategic business results. Another definition by Krajewski L, et al (2013), defines Six Sigma as a statistic. Six sigma processes will produce less than 3.4 defects or mistakes per million opportunities, many successful six sigma projects do not achieve a 3.4 ppm or less defect rate. That just indicates that there is still opportunity according to Adams et al (2002).
To implement the six sigma management philosophy and achieve the six sigma level of 3.4 defects per million opportunities or less there is a process that is used. Adams et al (2002) and Krajewski L, et al (2013), states that the six sigma process is define, measure, analyze, improve and control or DMAIC . The Six Sigma model can be applied to projects involving incremental improvements to processes or to projects requiring major changes, including a redesign of an existing process or the development of a new process Krajewski L, et al (2013).
Six Sigma relates to the broader philosophy and improvement approach. It is a philosophy that “stretches” goals of all organizations that adopt a Six Sigma encourages them to have critical processes, regardless of functional area, at a Six Sigma level of capability. It provides a blueprint for implementation of a total quality system (Evans 2008). The Define Measure Analysis Improve and Control (DMAIC) process is a typical Six Sigma tool that divides the problem into five phases naturally to solve the problem by defining a phase, measuring a phase, analysing, improving and controlling a phase. This process facilitates the identification of process waste and variations, and guides the selection of proper statistical tools, the phases are defined as per below:
A. Define
Determines the characteristics of the process’s output that are critical to customer satisfaction and identify any gaps between these characteristics and the process’s capabilities. It aims demonstrate the goal of a project by the assessment of given process, and identifies the issues that exist and can be improved for a higher sigma level.
B. Measure
Quantify the work the process does that affects the gap. Select what to measure, identify data sources, and prepare a data collection plan, it is a data collection process for all the information of the target process.
C. Analyze
Use data on the measures to perform process analysis; applying tools such as Pareto charts, scatter diagrams, and cause-and-effect diagrams and the statistical process control (SPC) tools in the chapter to determine where improvement is necessary. Whether or not major redesign is necessary, establish procedures to make the desired outcome routine. It is the time the selected team examines data and the process to identify the time traps, and to confirm the results with proper statistical tools
D. Improve
Modify or redesign existing methods to meet the new performance objective. Implement the changes. This is the step that implements all the tools and solutions designed to reduce or eliminate the defects and variations for a higher quality and faster process.
E. Control
Monitor the process to make sure that high performance levels are maintained. Statistical control tools can be used to control the process. This is the last phase to keep the achieved improvement and quality or speed level. Several control tools can be used in this phase, such as mistake proofing. This is the final performance it should be monitored periodically to guarantee the profits as advised by George (2002).
III. SLOW MOVING MATERIAL (SMM)
Inventory control of slow-moving items is essential to many establishments, since excess inventory leads to high holding costs and stock outs can have a great impact on the performance of operations. As the demands for slow moving items are extremely stochastic and as the demand might sometimes be zero or as a lumpy demand, it is difficult to develop efficient strategies for the inventory management of items with such a demand owing to their nature. This complicates the estimation of the lead time demand distribution that is essential to obtain the control parameters of most inventory policies (Porras and Dekker (2008 ) and Eaves and Kingsman (2004) ,
In many organizations, a simple inventory turnover report shows the problem starkly: Substantial portions of inventory investment and storage space are typically consumed by slow- and non-moving items. Dealing effectively with this problem, however, can often be very difficult. You must not only eliminate as much of this inventory as possible but also act to prevent it from building right back up again.
Slow-moving and non-moving inventory can consume large amounts of capital, storage space, and often handling expense. The problem can be addressed in two fronts: (1) reduction — eliminating this excess inventory as much as possible, and (2) prevention — removing causes that quietly tend to replace it.
IV. CONTINUOUS IMPROVEMENT
Continuous improvement in a management context means a never-ending effort to expose and eliminate root causes of the problems. Usually, it involves many incremental or small-step improvements rather than one overwhelming innovation. From a Japanese perspective, continuous improvement is the basis for their business culture. Continuous improvement is a philosophy, permeating the Japanese culture, which seeks to improve all factors related to the transformation process (converting inputs into outputs) on an ongoing basis. As stated by de Jager, B. et al. (2004) workers are trained to spot problems that interrupt, or have the potential to interrupt, the smooth flow of work through the system; the employee-driven improvements are integral to the success of the Continuous Improvement process. Management does not force the changes, thus the employees are less resistant to the changes and recognize the necessity and value in implementing these alternative methods.
V. COST REDUCTION
The cost of capital is the opportunity cost of investing in an asset relative to the expected return on assets of similar risk. Inventory is an asset; consequently, we should cost and measure that adequately in order to reflect the firm’s approach to financing assets. Inventory takes up space and must be moved into and out of storage, an inventory holding cost is incurred when a firm could use storage space productively in some other way (Krajewski L, et al 2013).
Cost reduction is the process used by companies to reduce their costs and increase their profits. The strategies can differ; this depends on a company’s services or product they offer. Companies must be aware that the decisions made in the product development process, has an impact on cost. Companies sometimes come up with the launch of new products without focusing too much on cost should the target market not take the product. Cost becomes more important when competition increases and price becomes a differentiator in the market.
VI. PROBLEM DESCRIPTION
The study was conducted at APB manufacturing company in South Africa which specialised in manufacturing food flavours. Every year the company write off more than a million ZAR worth of products due to obsolete raw materials, wrong safety stock levels, waste and false new wins. The plant implemented Six Sigma in different
departments. The implementation of Six Sigma was introduced in order for the organisation to reduce the product waste which resulted from internal rejection and also from obsolete and slow moving material (SMM). Materials that have been consumed little or not at all over a long period of time are referred to as slow-moving items. These materials are not necessarily obsolete but they are required rarely by your business and you can keep barest minimum stock and safety stock can be very low may be less than the dead stock calculated over a period of time. The total value of the write offs of SMM was costing the organisation millions of US dollars per annually. The organisation trained internal personnel who worked on different projects in order to save the organisation money.
VII. METHODOLOGY
The methodology for this case study involved the uses of the DMAIC cycle as a guideline to define the problem, measure the data, analyze the current situation, improve the process, and control the final benefits. The overview of the process demonstrated that no comprehensive inventory management system was available in the plant, which caused excess inventory that lead to slow moving and obsolete stock.
The project started by clearly defining the problem, strategically aligning key business resources, and following the methodical Six Sigma approach throughout the selected processes to collect data that supported the project reduce excess inventory.
In order to carry out the project, the team was established and it consisted of all purchasing department personnel, the sponsor which is top management and project leader a trained six sigma Green Belt, quality control department personnel, finance department, customer service department and research and development department.
The team agreed on some procedures to follow. They agreed on the method of communication, bi-monthly meeting at a set time, the project leader shared with the team a set of rules that the whole team had to agree to and always follow. The quick win opportunities of the project were identified, the quick wins were: Pack size of raw materials, lean manufacturing in a form of only manufacture what has been ordered, confirmed customer orders that are cancelled, to have safety stock agreement with every customer that requires stock at a short lead time and rework stock that is obsolete. The opportunities were identified into categories which are: easy to implement, cost effective, within the team’s control or not, whether they were reversible or not and if already implemented and how to improve on already implemented quick win opportunities.
For the project’s Improve phase the team agreed on the items as shown in fig 1.
Review the top 10 obsolete/slow moving list on a monthly basis – action items of concern (see fig 1). Raws appearing on the slow moving /obsolete list on a
monthly basis: - Research and Development team to check if materials can be used in other formulations to prevent write-offs.
safety stock holding agreement with customers and stock was brought in/manufactured based on estimated forecast, sales to ask customers to take stock and written safety stock agreements are initiated to prevent future write off based on estimates.
All over yields or under yields are to be reported so that stock can be adjusted immediately on the system in order to control the actual quantity available on the floor.
Quality control to ensure that all raws received have more than 50% shelf life and not accept raws with short shelf life – this will prevent having expired stock before the full ordered quantity is used up.
Safety stock quantities must be communicated to the integrated planning team to make it current /relevant as per requirements, should a raw not move within 2 months, the safety stock level must be evaluated in order to prevent having excess stock that turns into obsolete stock.
Quality department and Research and Development department to look at date alignment of raws against the supplier’s shelf life, permanent shelf life on formulations of final products that can be extended further and option of finished product being reworked instead of being scrapped.
Inventory stock controller to check at time of dispatch that older stock is dispatched first; apply the First in first out system.
QC and Operations run the relevant transaction from the system on a bi- weekly basis to check stock that needs quality checks, and make a decision after testing in order to prevent stock expiring which results in write offs
Where possible procurement gets the minimum pack size that is required for production, negotiate with suppliers, and where possible only request the samples and pay for a sample price, this all depends on quantity used at a given time.
Customer service department must capture orders on time and follow the correct lead time, this will allow the production planner to exercise the implemented Make to order system and to adhere to make to order system Should there be a signed stock holding agreement with
customer; stock will be manufactured whenever it gets quieter in the manufacturing areas.
Consistency in writing & capturing write-off reason codes in the system, to be able to monitor if there is an improvement on the causes of write off and should there be another cause, it can be identified and addressed.
The team used the ISHIKAWA Diagram to state what they have identified as the root causes of the excess or obsolete inventory problem. This exercise assisted in developing measures that will eliminate the root causes. The team stated the values and motivation why the project should be carried out. This is the formation of team charter, this happened during the define phase where the business case was stated to reduce obsolescence and stock write-off. The opportunity statement was presented explaining the average cost the company was losing annually due to stock write off as a results of obsolescence and excess stock.
The goal of the project was to reduce the cost of write per annum by half of what was currently been written off.
The team drew a scope indicating the start of the project. The team started with the review of all stock that was on the plant’s floor and this included all raw materials and finished goods, which reached expiry date and those that were obsolete and have no usage requirements. The team used a company facility that enabled the team to check safety stock levels and consumption values then they compared this with a physical stock count to ensure that what was on paper was actually on the floor.
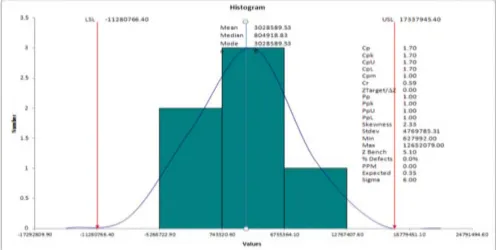
Figure 1 shows the histogram of slow moving material before the implementation of the project and figure 2 shows Pareto chart for Obsolete materials for top 10 obsolete materials, before the implementation of the project.
The data is classified as defective if the desired measurement, is outside the upper specification limit (USL) or lower specification limit (LSL). In addition to specifying the USL and LSL, a value target is specified, which typically is the midpoint between the USL and LSL. From a short-term process capability view, after sampling data from the process, a six sigma process that produces the parts is normally distributed and it displays short-term process capability in various sigma levels.
At the end of the project, the team was to review and monitor safety stock of all raw materials and to also review raw material from purchasing, to processing until exit of finished goods. The main aim was to see if they have achieved a significant reduction in obsolete material which would results in the company saving a lot of money, less write –off costs and the company having a good control over stock inventory.
VIII. DATA COLLECTION AND ANALYSIS
The Analyze phase began after the required data has been collected and a simple inventory model has been created using classic inventory formulas such as those found in the QI Macros disc and the operations management books. These models are used to analyze an inventory population to understand how key process input variables impact excess and obsolete inventory investment. In addition, a simple inventory balance is calculated for every item and location of the inventory population based on each item’s service level, lead-time and demand variation. An inventory balance show which items and locations may have too much inventory and which items and locations may have too little inventory.
The data collected was populated on excel spread sheet and analysed using Histogram, Scatter diagram and Pareto charts. The data was plotted and the Control chart was used for the control phase. The results were analysed and interpreted by the whole team comparing with previous supplied data, and a final report and project indicating the actual saving achieved was indicated.
and also time to collect data and communicate it to the project leader was deemed critical. The team’s commitment in ensuring that correct relevant data was collected and presented to the project leader on time was also sees as crucial. The support of the IT department in ensuring that the team had access to the relevant transactions to support data collection and sales team was also important as this assisted in understanding why some stock was never sold to customer and the sales team took this up with the customer, the product was even offered at less price in order to avoid write-off.
Benefits and lessons learnt was that the inventory levels were changed, some of the raw materials did not require to have safety stock and thus this was remove, some raw materials could be bought at small quantities, the supplier could give a smaller pack size, the saving that was supposed to be achieved in buying in bulk was in return causing obsolescence and write-offs which was not a saving but a loss for the company. All stock was made to order, customers had to adhere to lead-time and if they required stock to be available, they would take it with any shelf life and not require a longer shelf life on product. Other customers had a safety stock agreement signed, this is a binding contract protecting the company and ensuring that the customer take the stock as agreed on the contract.
For this project, after data analysis was carried out and the issues identified, measures we put into place to ensure that obsolescence and write-off are reduced as stated in the
define phase of the project. The team worked on a list that was run weekly and reported on a bi-weekly meeting on which items were no longer on the list, and how they got off the list, two main ways the items were off the list was through, rework and or selling to customer at lower prices.
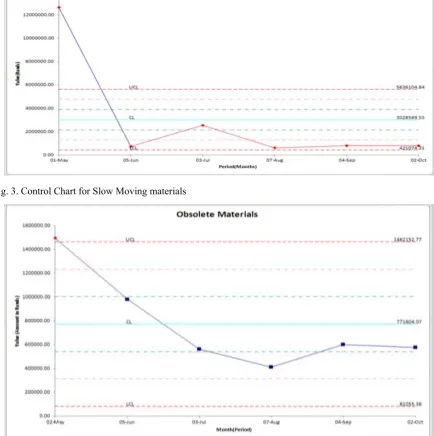
For the analysis phase and the control phase statistical process control charts were used. Values at start and the control limits were set; the top 10 list that was check regularly was checked. For the control phase, continuous monitoring was still on going, this ensured that the company did not experience a re-lapse in having excessive stock, which end up as obsolete stock or a write-off as shown in figure 3 and figure 4.
The value of Slow moving has been within the control limit since the implementation of a project.
The values for top 10 obsolete materials are within the control limit since the implementation of project.
Benefits and lessons learnt from the study was the realization of the value of Six Sigma knowledge and it success if more employees are well trained and well equipped. It was observed that if employees are trained
[image:5.595.49.549.412.662.2]properly and are well equipped there is an ability to build better project teams. Issues are tackled more effectively when there is a higher level of collaboration within the group. With support and involvement of top management, the team was able to reach the set goal.
Fig. 2. Pareto Chart for Obsolete materials
[image:6.595.87.515.59.512.2]Fig. 3. Control Chart for Slow Moving materials
[image:6.595.79.514.297.734.2]IX. DISCUSSION AND CONCLUSION
Six Sigma tools are applicable in the food industry. The tools can be integrated with existing systems to improve inventory control and minimize the risk having slow moving and obsolete stock that leads to inventory write-off. It can facilitate food companies to be competitive in the market by improving productivity and quality of products, and by reducing unnecessary waste and lead time. In this stock inventory process case, the process in the company was improved significantly and this also brought the team together to achieve a goal of providing solutions to issues thus meeting the on time performance target and delivering safer and good quality products to customers.
Lean Six Sigma could never help a company to achieve the goals they are expecting without the support of management (George, L. M., 2002, p. 85). A company needs to establish a detailed Six Sigma plan and incorporate this plan into the company’s strategies that will contribute for long term success. Building a Six Sigma and Safety Culture in an organisation and enhancing the awareness and participation of each individual in the organisation will assist in the efficiency of the improvements and maintain the achieved benefit.
The main objective is to reduce the write-off due to wrong inventory. The problem was established and a plan was needed in order for the system to be aligned with the actual inventory requirements. A team was developed in order to establish the actual causes and work on the problems at hand in order to support the business’s corporate goal of ensuring Obsolete Raw materials and Finished Goods discard are reduced and the organisation can also add value to the sustainability project.
By the end of the project, the organisation had a controlled inventory system that was followed. This procedure was linked to everyone who contributed to the excess inventory issues. More than half of write-off has been reduced from the period of implementation and the process was put under control. Six Sigma methodologies were followed and they benefited the organisation not only for the period of the project but thought the working period which included continuous improvement. The introduction of the sigma tool led to the success and productivity of the company.
REFERENCE
[1] Adams C, Gupta P and Wilson C, (2002), Six Sigma
Deployment, P288 Continuous Improvement
http://asq.org/learn-about-quality/continuous-improvement/overview/overview.html. ( Accessed 17 August 2013)
[2] de Jager, B., et al(2004). "Enabling Continuous Improvement: A Case Study of Implementation." Journal of Manufacturing Technology Management, 15, no. 4: 315– 324.
[3] Evans J. (2008) Quality & Performance Excellence: Management, Organization and Strategy, Fifth Edition.
[4] Eaves A.H.C., Kingsman B.G. (2004), “Forecasting for the Ordering and Stock-holding of Spare Parts”, Journal of the Operational Research Society 55, pp.431-437
[5] George, M.L. (2002), Lean Six Sigma – Combining Six Sigma Quality with Lean Speed, McGraw-Hill, New York, NY
[6] Krajewski LJ, Ritzman Larry P and Malhotra Manoj K. (2013), Operations Management, Processes and Supply Chains, tenth edition, Global Edition.
[7] Porras E, Dekker R (2008 ), “An Inventory Control System for Spare Parts
[8] Porter. M. (1980) Competitive Strategy – Techniques for Analyzing Industries and Competitors, New York: The Free Press.
[9] Warner J. (2013). Quality and Total Quality: March 1,; Ready to Manage.
Dr. PULE KHOLOPANE (PhD. University of Johannesburg)
Dr. Pule Kholopane worked at Unilever for a number of years, first as an Operator and then a Plant Controller within a manufacturing plant. He was then promoted to a Shift Manager position. He left Unilever to take up a job at Picto Thobela Enterprise as a Technical Director. He left the company to pursue his business interests. He established two companies called ZIBI INVESTMENT (PUMAC) and SEBATI AND KHOLOPANE Construction and was later appointed as General Manager at Afropulse and Inkanyamba Engineering. Some of these companies were involved in many private and Government projects.
Dr. Kholopane did part time lecturing at Production Management Institute (PMI) and later joined Vaal University of Technology as a Senior Lecturer in the department of Industrial Engineering and Operations Management. He also acted as the Head of above-mentioned Department (HOD). Currently he is a researcher supervisor and a coordinator of MTech and Doctoral students at UJ and Tshwane University of Technology (TUT).
Dr. Kholopane has written a number of articles and presented papers at the Portland International Centre for Management of Engineering and Technology (PICMET) in the USA, the South African Institute of Industrial Engineering and (SAIIE) and the Association for Operations Management of Southern Africa.(SAPICS), International association of management of technology (IAMOT) and Global Bussines and technology Asciation (GBATA).