Abstract—Most of the SMEs in the batik industry were only
concerned about the price offered and the quality of the raw materials. Of course, price offered and quality were still the important criteria, but knowing the location of suppliers who can provide the desired price and quality were also important and this can reduce the cost of production. Internet Geographical Information Systems (GIS), therefore, is a tool of great inherent potential for SMEs in the batik industry choosing the supplier of raw material. The spatial modelling offered by GIS is directly applicable to understanding the location of each supplier and, and its relationship to cost of delivery. In this study, the proposed GIS for supplier selection is developed through the Software Development Life Cycle (SDLC) methodology; whereas, architecture of information systems is described in the form of Use-Case Diagram, Context Diagram, and DFD, and database design is described in the form of ERD. Thus, alpha test and beta test are conducted in order to verify that the proposed GIS satisfies the specified requirements.
Index Terms—cost of production, geographical information
systems, SMEs in batik industry, supplier selection
I. INTRODUCTION
NE of the key essential elements to supply chain success is an effective purchasing function because it is can significantly reduce the purchasing costs in manufacturing firms[1]. Effective purchasing enhances efficiency and competitiveness among other benefits, but to realize these benefits, it is imperative to select and maintain competent suppliers [2]. According to [3], firms cannot successfully produce low cost, high quality products without judicious selection and maintenance of a competent group of suppliers. However, many factors affect a firm’s ability to choose the right supplier. There is a need for understanding of the supplier selection criteria. Reference[4] introduced 23 supplier selection criteria in his publication in 1966. The study was enhanced by [3] by reviewing 74 publications from 1966 to 1990. Reference [5] compares Dickson and Manuscript received January 14, 2015; revised March 30, 2014. This work was supported by Direktorat Penelitian dan Pengabdian Kepada Masyarakat, Directorate General of Higher Education, Ministry of Research, Technology, and Higher Education, through grand for “Strategis Nasional Research”
Aries Susanty is with Departemant of Industrial Engineering, Diponegoro University, Central of Java, Indonesia (corresponding author to provide phone: 62-024-7460052; fax: 62-024-7460052; e-mail: [email protected]).
Sri Hartini is with Departemant of Industrial Engineering, Diponegoro University, Central of Java, Indonesia (corresponding author to provide phone: 62-024-7460052; fax: 62-024-7460052; e-mail: [email protected]).
Diana Puspitasari with Departemant of Industrial Engineering, Diponegoro University, Central of Java, Indonesia (corresponding author to provide phone: 62-024-7460052; fax: 62-024-7460052; e-mail: [email protected]).
Weber study, and summarized new supplier selection criteria from the study of 49 articles from 1992 to 2003. In practice, there could be several criteria used by a firm in its supplier selection decision, such as the price offered, part quality, on-time delivery, after-sales services, supplier location and supplier’s financial status. Apparently, supplier selection is a multi-criteria problem that includes both quantitative and qualitative factors. It is necessary to make a trade-off between these tangible and intangible factors while considering a suitable supplier [6].
This study will focus on one of criterion for supplier selection, e.g. geographical location of the supplier. Geographical location is a preferred criterion as it will decide whether to engage a local or distant supplier which will ultimately have an impact on purchasing costs of raw material. Related to the geographical location of suppliers, SMEs in the batik industry began to realize the impact of the location of the supplier on the cost of delivery raw materials. In the past, most of the SMEs in the batik industry were only concerned about the price offered and the quality of the raw materials. Of course, price offered and quality were still the important criteria, but knowing the location of suppliers who can provide raw material with desired price and quality were also important and this can reduce the cost of production [7]. Batik is “wax writing”, a way of decorating cloth by covering a part of it with a coat of wax and then dyeing the cloth. It is a technique of covering the parts of fabric which will not receive the color. The waxed areas keep their original color and when the wax is removed the contrast between the dyed and undyed areas forms the pattern [8].
The purpose of this paper is to develop the application of Geographical Information Systems (GIS) as a decision support system in analyzing geospatial data in the supplier selection in batik industry. These in turn help to identify the nearest supplier of a particular raw material in a particular geographic area, so the SMEs can get the minimum cost of delivery. A GIS is a computer based system capable of capturing, storing, analyzing, and displaying geographically referenced information; that identified according to location. A GIS is used for mapping and analyzing spatial data [9]. More detail, this study aims to: (i) analyze the requirements of batik industry on information system related to geospatial information about suppliers of particular material; and (ii) design, build, and test a geographical information system that can be used to provide geospatial information about suppliers of particular material. The rest of the paper is organized as follows. We give the relevant literature about GIS and Google Map API. This is followed by methodology of research which includes the steps of application development. Then we present the result ofanalyzing the
Design the Geographical Information System
for Supplier Selection in Batik Industry
Aries Susanty, Sri Hartini, Diana Puspitasri, Wiwik Budiawan, Priliandi Hidayatullah
requirements of batik industry on GIS and the result of application development in the next section. Finally, we conclude the paper with a summary of the findings and limitation of the study.
II. LITERATURE REVIEW
A. Geographical Information System
Business requirements for information systems are as diverse as the many types of businesses that exist. Nevertheless, most organizations use information systems for one or more of five applications: transaction processing, operations, inventory control, planning and decision-making, and internal management and control. Geographical Information Systems (GIS) can be used for these functions because this technology possesses capabilities that are common to traditional a spatial information system. In addition, GIS also possess characteristics that provide them with capabilities that are not present in other information systems [10]. GIS and related geographic information technologies are increasingly becoming critical tools for addressing logistic and transportation problems. In this context, GIS is used both as a platform for supporting decision modeling activities and as a tool for displaying the results of these analyses [11].
GIS a promising branch of Information Systems (IS) [12].The use of GIS has recently become popular [13], [14], [15], [16], [17]. The first definition of the term GIS as a decision support system was made by Cowen [18]. A GIS is a decision support system involving the integration of spatially referenced data in a problem-solving environment [18]. Another definition made by Christiansen ten years later was like a synthesis of older definitions. A GIS is a system, consisting of hardware, software, data, procedures and a proper organizational context which compiles, stores, manipulates, analyses, models and visualizes, spatial data, to solve planning and management problems [19]. Fundamentally, a GIS is a tool for linking attribute databases with digital maps. GIS also provides users with advanced modeling functions, tools for design and planning, and advanced imaging capabilities. While many of these capabilities also exist in other types of systems, such as visualization and virtual reality systems, GIS is unique because of their emphasis on providing users with a representation of objects in a cartographically accurate spatial system and on supporting analysis and decision-making [20].
Typically, GIS datasets come as layers –there can be a layer for rivers, a layer for roads, and a layer for zip codes – all within a particular geographical boundary. A layer may consist of one or more features, which include points, lines, or boundaries. The various layers are superimposed to create a meaningful map. Each GIS layer has two views: a map view and a data view. The map acts as a visual representation of data, and a particular attribute of the dataset can be displayed on the map. The data view can be used to create a smaller dataset (or map) from a large dataset using a query tool [21].
B. Google Map API
According to [22], since the emergence of the internet in
the 1990s, there has been a paradigmatic shift in all aspects of GIS. Internet GIS is a research and application area that utilizes the internet to facilitate the access, processing, and distribution of geographic data and spatial analysis knowledge. The internet has affected GIS in three major areas: GIS data access, spatial information dissemination and GIS modelling/processing [23]. It has increasingly been recognized that future developments in GIS will canter on internet GIS [24], [23]. Access to and transfer of spatial data over the internet are the first steps toward true internet GIS and the use of Google Maps API (Application Programming Interfaces) has been shown to have great potential as GIS software for developing Internet GIS solutions [22]. The GIS software is a fundamental and critical part of any operational GIS. The GIS employed in a GIS project has a controlling impact on the type of studies that can be undertaken and the results that can be obtained. There are also far reaching implications for user productivity and project costs [25].
Google Maps is a free web map server application and technology provided by Google that powers many map-based services. The user can also control the map with the arrow keys to move to the desired location. To allow for quick movement, the "+" and "-" keys can be used to control the zoom level. Users may enter an address, intersection or general area to quickly find it on the map. Google Maps offers three viewing modes by default: Map (Street map views), Satellite (satellite and high-resolution aerial photographs) and Hybrid (Street maps overlaid on satellite and high-resolution aerial photographs) [26]. To use Google maps, the first step is doing registration to get the API key from Google that will be used in the program code. Registration can be done through http://www.google.com/ apis/maps/signup.html. It would be better if a programmer has to know web programminglanguage, such as HTML, XML, and Java Script because JavaScript is the native language of Google Maps and Google Maps is built of XHTML (Extensible HTML), formatted with CSS (Cascading Style Sheet) [27].
Analysis, Design, Coding, Testing, and Maintenance [31, 32].
There are some tools used for design the application, i.e. Use-Case Diagram, Context Diagram, Data Flow Diagrams, and Entity Relationship Diagrams. A Use-Case Diagram is derived from use-case study scenarios. It is an overview of use cases, actors, and their relationships of communication to demonstrate how the system reacts to requests from external users. It is used to capture system requirements [33]. The Use-Case diagrams separate the system into actors and use cases. Actors represent roles of the users of the system. These users can be humans, other software systems, other computers or pieces of hardware. The Use–Case Diagram is a very useful tool for describing the behavior of the system. This behavior is described in a textual manner [34].
A Context Diagram is a data flow diagram of an organizational system that shows the system boundaries, external entities that interact with the system and the major information flows between the entities and the system [35]. The context diagram shows the overall business process as just one process and shows the data flows to and from external entities. The context diagram is further decomposed into the lower-level, and each process on the level can be decomposed into more explicit Data Flow Diagrams (DFDs) [36].
DFDs is a tool that uses various symbols to show how data moves through an information system but does not show program logic or processing steps [37]. According to [38] they are often used in the preliminary design stages to provide an overview of the system. A set of DFDs provides a logical model of what a system does. When it comes to conveying how data flows through system and how that data is transformed into the process, DFDs are the method of choice over technical descriptions for three principle reasons, i.e.: DFDs are easier to understand by technical and non-technical audiences, DFDs can provide a high level system overview, complete with boundaries and connections to other systems, and DFDs can provide a detailed representation of system components. In process modeling, the highest-level of data flow diagram is known as the context diagram [39]. DFDs is composed of various levels, each elaborates on the level superseding it such as: level 0, this level is concerned with identifying the source and sink of data that describes the inputs and outputs of a system at its entirety; level 1, this level identifies the basic functional elements of a system and thesequence of their interaction; level 2, identify the sub-components of each functional element identified in 1 and their organization; and level n, identify the building blocks of sub-components defined at leveln-1[40]. DFD symbols consist of four symbols which are processes, data flows, data stores and external entities [41]
Entity Relationship Diagram (ERD) is one of the main tools used in software design process. This representation enables software engineers to understand system data requirements at a more comprehensive level [42]. Entity relationship diagrams (ERD) are widely used in database design and systems analysis to represent systems or problem domains. The ERD was introduced by Chen [43] in early
1976. Information system designers need to understand the ERD notations to perform tasks for information system analysis and design, for schema integration and manipulation, for reverse engineering, and also for maintenance of current systems [44], [45]. The basic components of the ERD are entities, properties of entities called attributes, and relationships between entities.
IV. RESULT
A. Analyze the Requirements of Batik Industry on Geographical Information System
The prime concern during any supplier selection system by SMEs in batik industry is the availability of the spatial information. Internet GIS which facilitated by Google Maps can play a key role in this aspect by providing the shortest location of supplier for raw material. There is a number information or database needed by internet GIS which facilitated by Google Maps, i.e. information about each SME (name of SME, location, type of batik produced, e-mail address, phone number), raw material (fabric, dye, wax), information about each supplier (name of supplier, location, e-mail address, phone number), delivery costs in accordance with the type of transport that will be used, as well as the amount of particular materials to be transported.
Procedures for the supplier selection based on the most minimal delivery costs can be explained as follows: (i) the users will see a map of Central Java and Yogyakarta; (ii) the user determines point of the location as the destination of delivery of raw materials; (iii) the point of destination can be selected through the menu if the SMEs has been registered in the database; (iv) the user selects the type of raw material and fill the amount of raw materials to be sent; (v) the users will see the delivery path of each suppliers that sell ttese types of materials to be purchased; (vi) the system will display information about the delivery cost of each supplier based on type transportation which is used to make deliveries
B. System Design and Coding Architectures of Information Systems
Architecture of information systems is described n the form of Use-Case Diagram, Context Diagram, and DFD. The Use-Case Diagram that depicts the activity of the system and those who carry out the activity on the system (or the actors) can be seen in Fig 1 and its descriptions can be seen in Table 1; thus, the Context Diagram that shows the system boundaries, external entities that interact with the system and the major information flows between the entities and the system can be seen in Fig. 2.
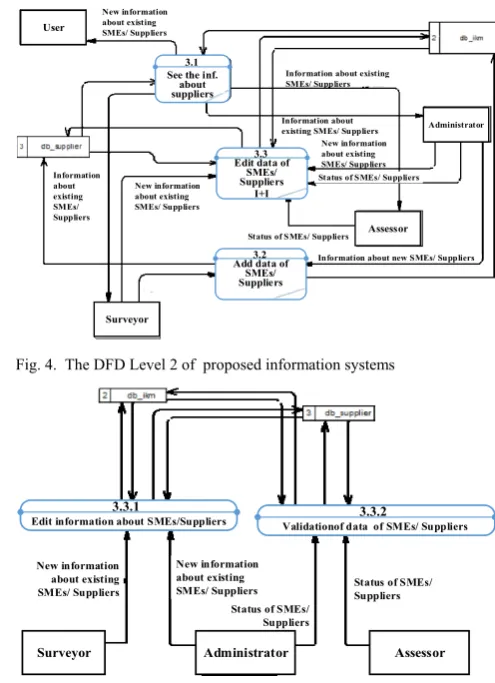
level 3 will describe the detail process of edit data of SMEs or suppliers.
GIS of Supplier Selection of Raw Material in Batik Industry
Validation data of SMEs/
Suppliers Assesor
Administrator
Surveyor Information about location and
calculate the delivery cost
Information about SMEs/Supplier
Edit data of SMEs/ Suppliers
Input data of SMEs/ Suppliers User
[image:4.595.309.545.50.266.2]Login
Fig. 1. The Use Case Diagram of proposed information systems
TABLEI USE-CASE DESCRIPTIONS
Activity Description Actor
Login Activities login to the system (main page) by entering username and password
Administrator, surveyor, assessor Information about
SMEs/ Suppliers
Activities to see the location of SMEs and Supplier
Administrator, User Input data of SME /
Supplier
Activities to add data about the location and other information about SMEs and suppliers to the system
Administrator, surveyor
Edit data of SMEs/Supplier
Activities change the data that has been inputted by the supplier.
Administrator, surveyor
Validation data of SMEs/Supplier
Activity validate the data that has been inputted by the supplier Administrator, assessor Information about location and calculate the delivery cost
Activities comparing the distance between SMEs batik and location of suppliers and delivery cost that will be charged to SMEs Batik.
User
User
GIS of Supplier Selection of Raw Material in Batik Industry
Information about new SMEs /new suppliers
Information about delivery cost
Location of user Destination of delivery Quatity and type
of raw material
Assessor
Page of assesor Information about existing SMEs/ Suppliers
Status of SMEs/Suppliers Username & Password
Administrator
Status of SMEs/ Suppliers Information about new SMEs/Suppliers
Username & Password
New information about existing SMEs/Suppliers
Surveyor Information about existing SMEs/Suppliers
Page of administrator Page of surveyor
Information about existing SMEs/ Suppliers
Information about existing SMEs/Suppliers
Information about new SMEs/Suppliers Username & password
Fig. 2. The Context Diagram of proposed information systems
DatabaseDesign
The ERD assists the database designer in identifying the data and the rules that will be represented and used in a database. Thus, the ERD of the proposed information systems can be seen in Fig. 6.
Users Quantity and type of
raw material Information about delivery cost Information about existing SMEs/ Suppliers
Information about new SMEs/ Suppliers New information about existing SMEs/ Suppliers Information about existing SMEs/ Suppliers Managemet of information Information about existing SMEs/ Suppliers
New information about existing SMEs/ Suppliers Information about new
SMEs/ Suppliers Administrator Status of SMEs/ Suppliers
Status of SMEs/ Suppliers
Assesor
Username & password
Username & password Page of
Assessor
Page of Administrator Username &
password Page of Surveyor
User Surveyor Login Information about existing SMEs/ Suppliers Destination of delivery
Location of users
2
[image:4.595.61.267.94.257.2]Calculate the delivery cost 3 Management of information 1 Login
Fig. 3. The DFD Level 1of proposed information systems
User
See the inf. About suppliers New information about existing SMEs/ Suppliers Information about existing SMEs/ Suppliers New information about existing SMEs/ Suppliers
Edit data of SMEs/ Suppliers
Assessor
Surveyor
Add data of SMEs/ Suppliers
Status of SMEs/ Suppliers
Information about new SMEs/ Suppliers Status of SMEs/ Suppliers
New information about existing SMEs/ Suppliers Information about existing SMEs/ Suppliers
Information about existing SMEs/ Suppliers
Administrator
3.1 See the inf.
about suppliers
See the inf. About suppliers
3.3 Edit data of
SMEs/ Suppliers
I+I
Edit data of SMEs/ Suppliers See the inf.
About suppliers
3.2 Add data of
SMEs/ Suppliers
Fig. 4. The DFD Level 2 of proposed information systems
Add data of SMEs/ Suppliers Edit data of SMEs/ SuppliersSee the inf. About suppliers3.3.1
Edit information about SMEs/Suppliers Validationof data of SMEs/ SuppliersEdit data of SMEs/ Suppliers Add data of SMEs/ SuppliersSee the inf. About suppliers3.3.2
Surveyor Administrator Assessor
New information about existing SMEs/ Suppliers
New information about existing
SMEs/ Suppliers Status of SMEs/ Suppliers Status of SMEs/
Suppliers
Fig. 5. The DFD Level 3 of proposed information systems
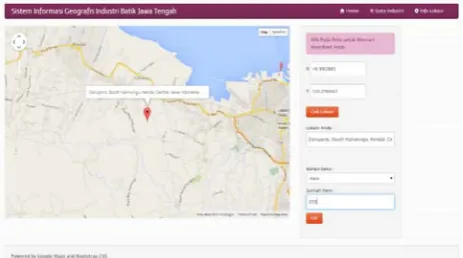
Interface Design
[image:4.595.297.545.296.638.2] [image:4.595.45.304.309.676.2]Fig. 6 The ERD of proposed information systems
Fig. 7 The interface for inputting data of location and raw material needed (type and amount)
C. Software Testing
Software testing is the process of exercising a product to verify that it satisfies specified requirements or to identify differences between expected and actual results [46]. This proposed information system (GIS for supplier selection of raw material in batik industry) will be tested by alpha and beta testing. The aims of this testing is to uncover errors that only the end-user seems able to find. The alpha test is conducted at the developer's site by a customer. The software is used in a natural setting with the developer "looking over the shoulder" of the user and recording errors and usage problems. Alpha tests are conducted in a controlled environment. The beta test is conducted at one or more customer sites by the end-user of the software. Unlike alpha testing, the developer is generally not present. Therefore, the beta test is a "live" application of the software in an environment that cannot be controlled by the developer. The customer records all problems (real or imagined) that are encountered during beta testing and reports these to the developer at regular intervals. As a result of problems reported during beta tests, software engineers make modifications and then prepare for release of the software product to the entire customer base [47].
Alpha testing will be done using black-box testing. Black box testing also called behavioral testing, focuses on the functional requirements of the software. That is, black-box testing enables the software engineer to derive sets of input conditions that will fully exercise all functional requirements for a program [49]. The result of alpha testing with black-box testing indicates that the all functions
contained in the GIS for supplier selection of raw material in batik industry have been running properly, in accordance with the design. It means, all the functions of the GIS has been successfully used and did not experience an error; if there is an error, this is caused by users who do not provide right input. Functionally, the GIS for supplier selection can produce output as expected by the user. After beta testing, the user evaluation results regarding software system performance were summarized as follows: (i) the proposed GIS has a good user interface and easy to understand; (ii) users can easily follow the instruction, i.e. login to the system, search data in the system; (iii) the system was capable of generating information required by the users, i.e. type of raw material provided by suppliers, as well as their location as shown in the map.
V. CONCLUSION
Development of an internet-based GIS for supplier selection of raw material in batik industry is presented in this paper. The spatial modelling offered by GIS is directly applicable to understanding the location of each supplier and, and its relationship to cost of delivery.SDLC methodology is used as a tool for GIS development. Thus, architecture of information systems of the proposed GIS is described in the form of Use-Case Diagram, Context Diagram, and DFD; whereas, database design is described in the form of ERD. Alpha test and beta test are conducted in order to verify that the proposed GIS satisfies the specified requirements. The result of alpha testing with black-box testing indicates that all functions contained in the GIS for supplier selection of raw material in batik industry have been running properly, in accordance with the design. The result of beta testing was summarized as follows: (i) the proposed GIS has a good user interface and easy to understand; (ii) users can easily follow the instruction, i.e. login to the system, search data in the system; (iii) the system was capable of generating information required by the users, i.e. type of raw material provided by suppliers, as well as their location as shown in the map.
The major limitation of study on the designof GIS for supplier selection in batik industry is that this study didn't consider the road and traffic condition. So, further research should include the condition of road and traffic as some factors which have significant impact to lead time of delivery, which in turn affect the cost of delivery. It is necessary to make sure that proposed GIS can be used by SMEs batik. In this case, the government as a regulator, must encourage the SMEs uses GIS through conduct a training about using the software and providing some facilities such as computers and the Internet which can be used by SMEs to run the software.
REFERENCES
[1] M. Tracey and C.L. Tan,“Empirical Analysis of Supplier Selection and Involvement, Customer Satisfaction and Firm Performance,” Supply Chain Management: AnInternational Journal, vol. 6, no. 4, pp. 174-188, Sept. 2001
[image:5.595.48.280.235.364.2]Journal of Humanities and Social Science, vol. 2, no. 14,pp. 189-193, Jul. 2012
[3] C.A. Weber, J. R. Current, and W.C. Benton, “Vendor Selection Criteria and Methods,”European Journal of Operational Research, vol. 50,no.1,pp. 2-18, 1991
[4] G.W. Dickson, “An Analysis of Vendor Selection Systems and Decisions,” Journal of Purchasing, vol.2, no.1, pp.5-7, winter 1966 [5] Z. Zang, J. Lei, N. Cao, K. To and K. Ng, Evolution of Supplier
Selection Criteria and Methods, “Evolution of Supplier Selection Criteria and Methods,”EuropeanJournal of Operational Research, vol.4, no.1, pp 335-342,2003
[6] R. Jain, A.R. Singh, and P.K. Mishra, “Prioritization of Supplier Selection Criteria: A Fuzzy-AHP Approach,“ MIT International Journal of Mechanical Engineering, vol. 3, no. 1, pp. 34–42, Jan. 2013
[7] Kontan, Jatuh Bangun Bisnis Batik Nusantaara, 2012. Available: http://peluangusaha.kontan.co.id/news/jatuh-bangun-bisnis-batik-nusantara-tetap-menggiurkan/2012/04/23,
[8] TREDA (Trade Research and Development Agency). Indonesia Batik-A Cultural Beauty.Jakarta, IND: Ministry of Trade of the Republic of Indonesia, 2008
[9] K. Chang, Introduction to Geographic Information Systems. Boston, London: McGraw Hill Higher Education, 2006
[10] J.D. Landis,“GIS capabilities, uses, and organizational issues,”in Profiting From A Geographic Information System, Fort Collins, CO: GIS World Inc, 1993, pp. 23-53.
[11] M. Grabowski and S. Sanborn, “Knowledge Representation and Reasoning in a Real-Time Operational Control System: The Shipboard Piloting Expert System (SPES),” Decision Sciences, vol. 23, pp. 1277-1296, 1992
[12] M. F. Worboys and M. Duckham, GIS: A Computing Perspective. Boca Raton, FL: CRC Press, 2004
[13] D. Weigel and B. Cao, “Applying GIS and OR Techniques to Solvesears Technician-Dispatching and Home-Delivery Problems,” Interfaces, vol. 29, no. 1, pp.112 -130, 1999
[14] J. Francica, “Location Analysis Tools Help Starbucks Brew up New Ideas,” Business Geographics, vol. 8, no. 8, p. 32-33, 2000
[15] A. Lubenow and K. Tolson, “GIS Technology Helps Pinpoint Patients,” Health Management Technology, vol. 222, no.1,pp.54-55, 2001
[16] D. Nemeth, “GIS Shows How Data Becomes a Vital Corporate Asset,’ Pipeline & Gas Journal, vol. 228, no. 3, pp. 41-43, 2001 [17] D. Hockstra, and P. Mattejat, “Manage Drainage Infrastructure,”
Public Works, vol. 133, no. 5, pp.170-171, 2002
[18] D.J.Cowen, “GIS versus CAD versus DBMS: What are the Differences?,” Photogrammetric Engineering and Remote Sensing, vol. 54,no. 11, pp. 1551-1555, 1988
[19] T. Christiansen “Geographical Information Systems for Regional Rural Development Projects in Developing Countries,” Giessener Geographischen Schriften, vol 75, Gießen: Selbstverlag des Geographischen Institutes der Justus-Liebig-Universität, 1998 [20] B. E. Mennecke, “Understanding the Role of Geographic Information
Technologies in Business: Applications and Research Directions,” Journal of Geographic Information and Decision Analysis, vol.1, no.1, pp. 44-68, 2000
[21] M.A. Rob, “Applications of Geographical Information Systems in Understanding Spatial Distribution of Asthma,” Informing Science Journal, vol. 6, pp.89-99, 2003
[22] T. E. Chow, “The Potential of MapsAPIs for Internet GIS Applications,” Transactions in GIS, vol. 12 no.2, p. 179-191, 2008 [23] Z. R. Peng and M. H Tsou, Internet GIS, Distributed Geographic
Information Services for the Internet and Wireless Networks. Hooboken, NJ: John Wiley & Songs, INC, 2003.
[24] B. Plewe, GIS Online: Information Retrieval, Mapping, and the Internet. Santa Fe, OnWord Press, 1997
[25] K. Eldrandaly, “GIS Software Selection: a Mmulti-Criteria Decision Making Approach,” Applied GIS, vol.3, no. 5,pp. 1-17, May, 2007 [26] J. A. S. Gomez, “GIS Applications for Real Estate in
Honduras,”Master’s Thesis, International Master Program for Environment Sustainable Development, July, 2007, pp. 28
[27] S. Udell, Beginning Google Maps Mashups with Mapplets, KML and GeoRSS: from Novice to Professional.Berkeley, CA. Apress. 2009.
[28] D. Avison and G. Fitzgerald, Information Systems Development:Methodologies, Techniques & Tools. Maidenhead, UK: McGraw-Hill Education, 2006.
[29] S.I. Pfleeger and J. M. Atlee, Software Engineering Theory and Practice. Englewood Cliffs, NJ: Pearson Prentice Hall, 2006
[30] V. Massey and K. Satao, “Comparing Various SDLC Models and the New Proposed Modelon The Basis of Available Methodology,” International Journal of Advanced Research inComputer Science and Software Engineering, vol.2, no.4, pp.170–177, 2012.
[31] S. K. Dora and P. Dubey, “Software Development Life Cycle (SDLC) Analytical Comparison on Traditional and Agile Methodology,”National Monthly Refereed Journal of Research in Science & Technology, vol.2, no.8, pp. 22-30, 2013
[32] N. Kumar, A. S. Zadgaonkar, Abhinav Shukla, “Evolving a New Software Development Life Cycle Model SDLC-2013 with Client Satisfaction,” International Journal of Soft Computing and Engineering (IJSCE), vol. 3, no.1, pp.216-21, March 2013
[33] K. Qian, X. Fu, L.Tao, C. W. Xu, and J. L. Diaz-herrera, Software Architecture and Design Illuminated. Sudbury,Massachusetts:Jones and Barlett publishers, 2010
[34] K. Tiwari, A. Tripathi, S. Sharma, and V. Dubey, “Merging of Data Flow Diagram with Unified Modeling Language,” International Journal of Scientific and Research Publications, vol 2, no. 8, pp. 1-6, August 2012
[35] A. Dennis, B. H. Wixom, and R. M. Roth, Systems Analysis and Design, Hoboken, NJ: JohnWiley & Sons, Inc, 2006
[36] F. Yakubu, B. I. Ahmad, O. M. Omowumi, and M. A. Mngohol, “Process and Database Modelling of a University Bursary System: A Perspective of Cash Office,” International Journal of Computer Science Issues, vol. 8, issue 4, no 2, pp. 555-560, July 2011
[37] G. B. Shelly and H. J. Rosenblatt, Systems Analysis and Design. Boston: Mass Thomson Course Technology, 2010
[38] P. D. Bruza and Th.P. van der Weide, "The Semantics of Data Flow Diagrams", presented at the International Conference on Management of Data (CISMOD), Hyderabad, India, 1989
[39] J. L. Whitten, L. D. Bentley, and K. C. Dittman,Systems Analysis and Design Methodology, Irwin: McGraw Hill, 2004
[40] B. Y. Alkazemi and G. M A. Grami, “Employing a DFD Model to Facilitate the Management of Final-year Student Projects in Computer Engineering,” Global Journal of Engineering Education, vol. 14, no. 2, pp. 177-182, 2012
[41] S. Donald and Jr.Le Vie. “UnderstandingData Flow Diagram,” presented at the 47th Annual Conference on Society for Technical Communication, Texas
[42] G. Tokdemir, N. E. Cagiltay, and O. Kilic, “How Engineers Understand Entity Relationship Diagrams (ERD): Insights from Eye Tracker Data,“ presented at the IADIS International Conference Information Systems, Berlin, Germany, March 10-12, 2012
[43] P. P. Chen, "The Entity Relationship Model-Toward a Unified View of Data,”ACM Transactions on Database Systems, vol. 1, no.1, pp. 9– 36, 1976
[44] H. L. Christensen, Mads L. Haslund, Henrik N. Nielsen, and N. Tryfona, “Operations for Conceptual Schema Manipulation Definitions and Semantics, “ presented at 5th East European Conference, Vilnius, Lithuania, 25-28 Sept, 2001
[45] M. Genero, G. Poels and Mo Piattini, “Defining and Validating Measures for Assessing the Understandability of Entity-Relationship Diagrams, Data & Knowledge Engineering, vol. 64, no. 3, pp. 534-557, 2008
[46] A. Blair-Early and M. Zender, “User Interface Design Principles for Interaction Design, Design Issue, vol 24, no.3, pp. 85-107, 2008. [47] O. Deshmukh and M. Kaushik, “A Overview of Software Verification
&Validation and SelectionProcess,” International Journal of Computer Trends and Technology, vol.4, issue2, pp. 177-182, 2013 [48] K. K. Khurana and M. Malhotra, “Software Testing: Techniques And