Long-term conventional tillage (CT) led to several soil quality problems, such as a shallow soil tillage layer, plough bottom thickening, poor permeable water-holding performance, height water velocity and damaged soil structure (van Wie et al. 2013). However, the same problems existed when the con-ventional tillage method was used in the North China Plain (NCP) (Chen et al. 2011). Conservation till-age can reduce soil erosion, increase penetration resistance beneath the tilled layer (Liu et al. 2016), while improving water use efficiency and the struc-tural stability of large aggregates and soil structure (Dalal and Chan 2001). A key component of conser-vation tillage is subsoiling (ST), which reduces soil strength and improves soil properties (Comia et al. 1994). Moreover, ST considerably improves crop yield
(Guan et al. 2014). Therefore, ST is the main tillage system the use of which is reported in the literature (Bogunovic et al. 2018). The structure and thickness of the tilled layer determine the survival environ-ment of crops and the supply of nutrients and water (Castel and Cantero-Martínez2003). Shallow tillage depth (15–25 cm) makes it difficult to break the soil using the bottom of the plough and is not conducive to crop root growth; greater tillage depth (40–60 cm) does not allow the crop root to absorb fertilizer and decrease the supply of crop nutrients (Han et al. 2015). Thus, tillage depth has an important effect on soil properties and crop yield. However, the effects of ST depth on soil physical properties and crop yields in the NCP have not been previously reported. The main objectives of our study were to: (1) identify ongoing
Effect of subsoiling depth on soil physical properties
and summer maize (
Zea mays
L.) yield
Shaobo Wang, Liangliang Guo, Pengchong Zhou, Xuejie Wang, Ying Shen,
Huifang Han*, Tangyuan Ning, Kun Han
State Key Laboratory of Crop Biology, Key Laboratory of Crop Water Physiology and Drought-Tolerance Germplasm Improvement of Ministry of Agriculture, College of Agronomy,
Shandong Agricultural University, Tai’an, P.R. China
*Corresponding author: [email protected]
Citation: Wang S.B., Guo L.L., Zhou P.C., Wang X.J., Shen Y., Han H.F., Ning T.Y., Han K. (2019): Effect of subsoiling depth
on soil physical properties and summer maize (Zea mays L.) yield. Plant Soil Environ., 65: 131–137.
Abstract: The present study was carried out in 2016–2017 to assess the effect of subsoiling depth on the soil bulk density, stability of soil structure, soil physical properties and summer maize yield based on a field experiment started in 2015. Four tillage depths were studied: conventional tillage 25 cm (CT25); subsoiling tillage 30 cm (ST30); subsoiling tillage 35 cm (ST35) and subsoiling tillage 40 cm (ST40). The results showed that at the 20–50 cm depth ST30, ST35 and ST40 decreased the mean soil bulk by 4.59, 7.13 and 8.27%, respectively, and at the 0–40 cm depth reduced soil compactness by 17.62, 23.63 and 36.42%, respectively, as compared to CT25. ST40 reduced soil compactness in the 0–40 cm soil layer under conditions of relative drought (during the maize season growing season of 2016), ST35 and ST40 increased macroaggregates (> 0.25 mm), improved the stability of the aggregate structure (geometric mean diameter and mean weight diameter) (20–40 cm), increased soil water storage capacity at 40–60 cm and increased maize yield by 7.89% and 8.91%, respectively. Considering the improvement of soil properties and crop yield, ST35 was the optimum method to increase maize yield and modulate soil physical properties in the North China Plain.
Keywords: tillage layer; soil quality; soil compaction; water content; soil depth; grain
NCP experiments with tillage depth in subsoiling as an experimental factor; (2) analyze the effects on soil physical properties (soil bulk density, soil compaction, aggregate structure, soil water content); (3) relate till-age effects on crop yield to measured soil properties.
MATERIAL AND METHODS
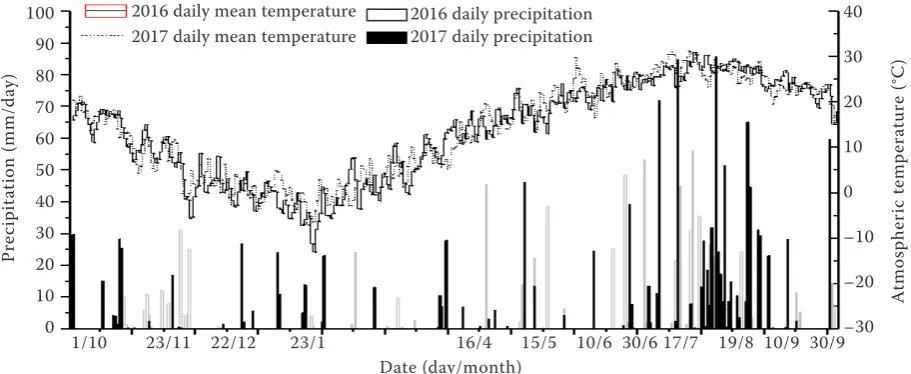
Field site description. The experiment was con-ducted in a field in the Shandong province (36°55'59'N, 120°39'33'E) from 2015 to 2017. The daily mean temperature and total precipitation distributions during the experimental period are shown in Figure 1. The crop system consists of winter wheat from October to June and summer maize from June to September. The experimental field was flat and the soil was loam (sand 35.2%, silt 46.61% and clay 18.19%), with pH of 6.79. In the 0–40 cm soil layer, the organic carbon and total N, P and K were 3.47 g/kg, 0.69 g/kg, 35.51 mg/kg and 89.12 mg/kg, respectively.
Experimental procedure. The randomized complete block design included four kinds of tillage depth: con-ventional tillage 25 cm (CT25); subsoiling tillage 30 cm (ST30); subsoiling tillage 35 cm (ST35) and subsoiling tillage 40 cm (ST40). The plot size was 8.5 m wide and 50 m long with three replicates. Summer maize
(cv. Wei Ke 702) was sown on June 10 in 2016 and June 8 in 2017. During the maize growth periods, 125 kg N/ha, 50.6 kg P/ha and 83 kg K/ha were used col-lectively as base fertilizers, and 110 kg N/ha was used as topdressing at the jointing stage. All of the soil tillage practices were performed following the maize harvest. The CT consisted of four ploughings (Bochi Model® FZL–430, Jiangsu, China) while ST consisted of five rotary hoeing’s (Haofeng Model® 1SF–200, Henan, China) to 40 cm depth. Maize resi-dues were mechanically shredded and buried using a moldboard plough. Ploughing was carried out on October 12, 2015, with the ploughing depth of 25 cm and ST tillage depths of 30, 35 and 40 cm, and soils of all treatments were subjected to traditional tilling with a depth of 25 cm on October 14, 2016. Table 1 shows that the rainfall levels in the growth periods were 378.2 mm in 2016 and 616.4 mm in 2017.
[image:2.595.72.528.99.286.2] [image:2.595.65.531.704.757.2]Measured variables and methods. Soil samples were collected after maize harvest on October 1, 2016 and October 4, 2017. The bulk density and soil porosity in the 0–50 cm depth were determined using the core method, soil density approximation to take 2.65 g/cm3. Soil penetration resistance was measured (CP40–II, Queensland, Australia). Soil moisture content was deter-mined by drying method and expressed by soil volume Figure 1. The atmospheric temperature and precipitation at the experimental site during 2016–2017
Table 1. Precipitation at all levels of maize (%)
Year (> 10 mm)Light rain Moderate rain (10–25 mm) (25–50 mm)Heavy rain (50–100 mm)Cloudburst Total precipitation (mm)
2016 13.33 35.27 36.59 14.81 378.2
2017 6.91 18.05 23.69 51.35 616.4
Date (day/month)
Pr
ec
ip
ita
tio
n
(m
m
/d
ay
)
100 90 80 70 60 50 40 30 20 10 0
2016 daily mean temperature
2017 daily mean temperature 2016 daily precipitation2017 daily precipitation 40
30
20
10
0
–10
–20
–30
A
tm
os
ph
er
ic
te
m
pe
ra
tu
re
(°
C
)
moisture content and soil aggregates were assessed using the wet sieve method (Oades and Waters 1991). The proportions of aggregates were used to calculate the aggregate content with a diameter of > 0.25 mm R0.25 (Hou et al. 2012) the mean weight diameter (MWD) and the geometric mean diameter (GMD) (Youker and McGuinness 1957). The parameters were calculated as follows:
Where: R0.25 – water stability of large aggregates (> 0.25 mm);
Mi > 0.25 – aggregate content with a diameter of > 0.25 mm,
the total weight of Mt aggregates (g). Wi – weight of the
aggregates in a specific size range as a proportion of the total
dry weight of the analyzed sample; n – number of sieves;
Xi – mean diameter of aggregates for each sieve size.
Yield samples of maize collected in three 10 m-long middle rows were randomly selected in the central area of each plot to exclude edge effects at maturity.
Statistical analyses. The data were statistically ana-lyzed using the SPSS 22.0 (Chicago, USA) statistical analysis system. The differences between the means for crop yield and soil properties were determined using the least significance difference (LSD).
RESULTS AND DISCUSSION
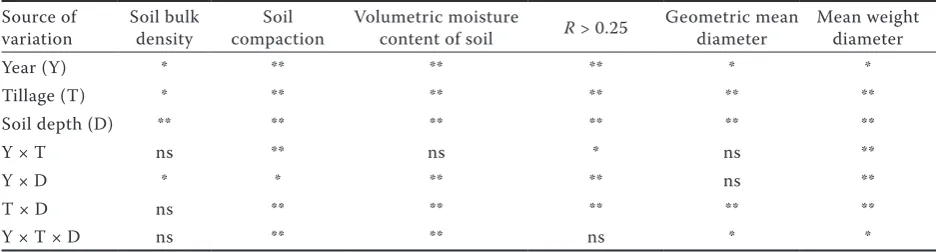
[image:3.595.63.532.126.252.2]Soil physical properties were significantly affected by year tillage and soil depth (Table 2). No significant dif-ference was found between CT and ST at the 0–20 cm depth, but soil bulk density increased with soil layer Table 2. Analysis of soil physical properties and soil aggregate stability indices of maize as affected by year tillage and soil depth
Source of
variation Soil bulk density compactionSoil Volumetric moisture content of soil R > 0.25 Geometric mean diameter Mean weight diameter
Year (Y) * ** ** ** * *
Tillage (T) * ** ** ** ** **
Soil depth (D) ** ** ** ** ** **
Y × T ns ** ns * ns **
Y × D * * ** ** ns **
T × D ns ** ** ** ** **
Y × T × D ns ** ** ns * *
[image:3.595.69.527.551.731.2]ns – not significant; *P < 0.05; **P < 0.01
Figure 2. Soil bulk density in 0–50 cm layer under tillage depth. Conventional tillage 25 cm (CT25); subsoiling 30 cm (ST30); subsoiling 35 cm (ST35); subsoiling 40 cm (ST40)
2016 maize maturity 2017 maize maturity
So
il
de
pt
h
(c
m
)
0–10
10–20
20–30
30–35
35–40
40–50
Soil bulk density (g/cm3)
0 0.2 0.4 0.6 0.8 1.0 1.2 1.4 1.6 1.8 0 0.2 0.4 0.6 0.8 1.0 1.2 1.4 1.6 1.8 𝑅𝑅0.25=𝑀𝑀𝑖𝑖>0𝑀𝑀.25
𝑇𝑇
𝑀𝑀𝑀𝑀𝑀𝑀=�∑𝑛𝑛𝑖𝑖=1∑ (𝑥𝑥𝑖𝑖𝑤𝑤𝑤𝑤𝑖𝑖)
𝑖𝑖 𝑛𝑛
𝑖𝑖=1 �
𝐺𝐺𝐺𝐺𝐺𝐺=𝐸𝐸𝐸𝐸𝐸𝐸 �∑𝑛𝑛𝑖𝑖=1∑𝑛𝑛𝑤𝑤𝑖𝑖𝑙𝑙𝑙𝑙𝐸𝐸𝑖𝑖𝑤𝑤𝑖𝑖
𝑖𝑖=1 �
CT25
ST30
ST35
depth (Figure 2). The results show that soil compac-tion has a significant negative correlacompac-tion with water content (Ahmadi and Ghaur 2015) (Figure 4). The amount of dry stable macroaggregates > 0.25 mm in soil layer of 20–40 cm was significantly increased by ST (Table 3). The soil water content in the crop
growth period differed significantly at tillage depths (Figure 5). This suggests that ST can modulate soil physical properties at 20–40 cm.
[image:4.595.67.522.97.271.2]Physical characteristics. Soil bulk density is an index of physical properties of soil that reflects the compactness of soil layers. Compared with CT25, Figure 3. Soil porosity in 0–50 cm layer under tillage depth. Conventional tillage 25 cm (CT25); subsoiling 30 cm (ST30); subsoiling 35 cm (ST35); subsoiling 40 cm (ST40)
Table 3. Soil aggregate stability indices (R > 0.25, geometric mean diameter (GMD) and mean weight diameter (MWD)) under different tillage depth systems in 0–40 cm layer
Treatment Depth (cm)
2016 2017
R > 0.25 mm
(%)
GMD MWD R > 0.25 mm
(%)
GMD MWD
(mm) (mm)
CT25
0–10
83.83c 1.41a 2.11b 87.46a 1.29c 2.21a
ST30 84.51bc 1.45a 2.90a 90.50b 1.42a 2.51a
ST35 86.79a 1.43a 2.47a 88.74b 1.35b 1.68b
ST40 81.98c 1.40a 2.03b 87.78b 1.27c 1.72b
CT25
10–20
87.59a 1.44a 2.50c 85.17a 1.26b 2.17b
ST30 85.44a 1.46a 3.11b 90.89b 1.31ab 1.79b
ST35 86.19a 1.46a 3.91a 87.64b 1.44a 2.73a
ST40 85.52a 1.44a 2.61c 88.35b 1.41a 2.07b
CT25
20–30
79.78c 1.34b 1.62b 83.00b 1.42a 2.35b
ST30 87.79a 1.36b 1.75b 84.44b 1.25b 1.55c
ST35 80.96bc 1.44a 2.67a 88.09a 1.48a 3.44a
ST40 83.02b 1.43a 2.42a 90.87a 1.48a 3.42a
CT25
30–40
80.99c 1.28b 1.49b 82.52a 1.35ab 1.58b
ST30 83.02ab 1.28b 1.96ab 85.21b 1.44a 2.59a
ST35 82.18b 1.26b 2.14a 91.06b 1.42a 2.19a
ST40 85.32a 1.43a 2.47a 92.61a 1.48b 2.31b
Within each factor, means in the same column followed by the same letters are not significantly different at P < 0.05
(least significance difference (LSD) test); conventional tillage 25 cm (CT25); subsoiling 30 cm (ST30); subsoiling 35 cm
(ST35); subsoiling 40 cm (ST40)
So
il
po
ro
si
ty
(%
)
2017 2016
Soil depth (cm) 60
55 50 45 40 35 30 25 10 0
0–10 10–20 20–30 30–35 35–40 40–50 0–10 10–20 20–30 30–35 35–40 40–50
CT25
[image:4.595.66.532.443.715.2]ST30, ST35 and ST40 the mean soil bulk decreased by 4.59, 7.13 and 8.27%, respectively, at the 20–50 cm depth. This indicated that with the increase of subsoiling depth, there was a greater effect on the improvement of soil tillage layer density. The bulk density of the 0–30 cm soil layer in 2017 was higher than that of the same soil layer in 2016, mainly because of the higher amount of precipitation, which increased soil compactness.
Soil bulk density and thus porosity of the investi-gated soils both differed due to tillage depth (Figure 3). As the total porosity, ST is calculated based on bulk density and default particle density, the tendencies of ST are the same as for the bulk density. Two-year data show that ST35 and ST40 have significant effects on improving soil porosity in soil layer of 30–40 cm. Thus, soil porosity can promote the absorption of water and nutrients in crop roots (Kutílek 2004)
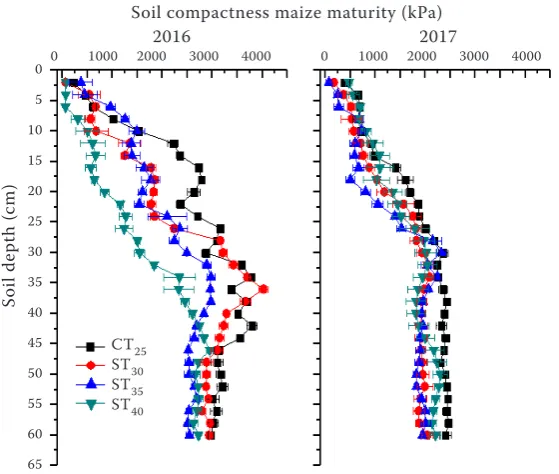
As shown by Pikul and Aase (2003), ST can improve soil structure by reducing soil strength and eliminating soil compaction. Compared with CT25, ST30, ST35, ST40 reduced the compactness by 17.62, 23.63 and 36.42%, respectively, at the 0–40 cm soil layer (Figure 4). This might be because ST improved soil compaction in the soil tillage layer, and thus provided better envi-ronment for the growth of crop root and promoted the elongation of crop roots. The root-ligation residues improved the compaction state of traditional soils (Borghei et al. 2008). The degree of soil compaction in 2017, however, was significantly lower than in 2016 and soil compaction had a significant negative correlation with soil water content (Table 1).
Soil structure. Soil aggregate is the foundation of soil structure and site material, energy transformation and metabolism in soil (Six et al. 2000). The MWD is an important evaluation index for soil aggregate stability, with a higher value indicating a better level of soil aggregate stability (Nimmo et al. 2002). The amount of dry stable macroaggregates > 0.25 mm was significantly higher in the 20–40 cm layer with ST30, ST35 and ST40 than with CT25 (Table 2); the amount of macroaggregates increased with soil layer depth. This is attributable to two factors. First, soil layers with low soil moisture content are not conductive to the formation of macroaggregates (Fan et al. 2010); second, owing to the disturbance of the soil under tillage, organic material could reach the deeper soil layer, resulting in more macroaggregates at that depth. The increase in GMD and MWD (20–40 cm) with the four treatments was ranked in order as follows: ST35 > ST40 > ST30 > CT25. As the depth of subsoiling increased, not only was the bottom of the plough able to break the soil, but the failure in soil aggregate structure caused by the drastic turning associated with traditional tilling soil was avoided and soil structure was therefore maintained with better stability (Tian et al. 2014).
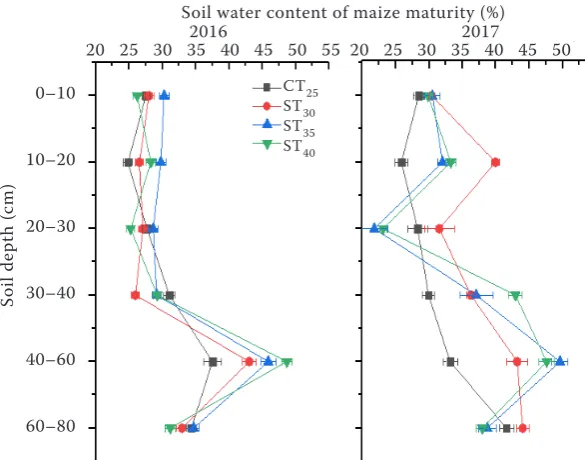
[image:5.595.71.351.94.331.2]Soil water content is an important factor for soils that not only provides water for crop growth but also affects nutrient conversion (Nkakini and Akor 2013). The magnitude of the change in soil water content was 24.85–48.67% in 2016 (Figure 5). ST30, ST35 and ST40 led to an increase of –3.16, 6.03 and –0.19% at Figure 4. Soil compactness at tillage depths. Conventional tillage 25 cm (CT25); subsoiling 30 cm (ST30); sub-soiling 35 cm (ST35); subsoiling 40 cm (ST40)
So
il
de
pt
h
(c
m
)
Soil compactness maize maturity (kPa) 2016
0 1000 2000 3000 4000 0 1000 2000 3000 4000 0
5 10 15 20 25 30 35 40 45 50 55 60 65
CT25 ST30 ST35 ST40
the 0–40 cm soil layer, and 5.73, 12.13 and 11.16% at the 40–80 cm soil layer, respectively, compared to CT25. The increase in soil water content (30–60 cm) under the four treatments was ranked in order as follows: ST40 > ST35 > ST30 > CT25 in 2017. While soil in the CT25 and ST30 was not broken by the plough bottom, consequently, the bottom of the plough is isolated and the water cannot be infiltrated, causing moisture to flow along the soil surface. ST35 and ST40 adjust the degree of soil compaction to make the soil at the level of 30–40 cm loose and porous, forming a good soil structure (Holthusen et al. 2018). Soil porosity is increased and soil infiltration capacity is enhanced, which increases the field water storage capacity of soil 30–60 cm layer (Evans et al. 1996).
Summer maize yield. During the study period, crop yields with the ST were significantly different from those with CT (Table 4). ST significantly in-creased the number of grains per spike, 1000 grain
weight of maize and the final grain yield increased (Mrabet 2011). At the same time, the results of the present study revealed that, under drought stress, ST could facilitate the uptake of subsoil water and thus increase crop yield, as also reported by Doty et al. (1975). The two-year results revealed that the average yield under the ST30, ST35 and ST40 was 3.94, 7.89 and 8.91% higher, respectively, than that under CT25. These differences in crop yield might be attributed to tillage depth, the effect on the soil granular structure, the depth to which the root of the crop was restricted and variations in the water and nutrient supply to the crop (Lin et al. 2016).
[image:6.595.64.357.94.324.2]In conclusion, two-year results indicated that ST broke up dense soil layers and improved soil properties in the tilled layer as the depth increased; it is important to apply appropriate tillage practices that avoid the degradation of soil structure and maintain crop yield as well as ecosystem stability. Compared to CT25 and
Table 4. Effect of different tillage depth on yield and its components
Treatment
Ear number
(104 ear/ha) per ear (grain/ear)Grain number 1000-grain weight (g) (t/ha)Yield
2016 2017 2016 2017 2016 2017 2016 2017
CT25 5.96a 5.67b 475.63b 564.24b 298.37c 302.52b 8.73b 10.02b
ST30 6.18a 5.73ab 528.32a 615.49a 304.12b 305.61b 9.16a 10.33a
ST35 6.21a 5.81a 556.97a 618.06a 304.89b 304.29b 9.27a 10.96a
ST40 6.19a 5.82a 571.18a 624.11a 308.47a 312.17a 9.30a 11.12a
Within each factor, means in the same column followed by the same letters are not significantly different at P < 0.05
(least significance difference (LSD) test); conventional tillage 25 cm (CT25); subsoiling 30 cm (ST30); subsoiling 35 cm
[image:6.595.64.531.618.716.2](ST35); subsoiling 40 cm (ST40)
Figure 5. Effects of tillage depth on water content of maize maturity (volumetric water content). Conven-tional tillage 25 cm (CT25); subsoiling 30 cm (ST30); subsoiling 35 cm (ST35); subsoiling 40 cm (ST40)
So
il
de
pt
h
(c
m
)
0–10
10–20
20–30
30–40
40–60
60–80
Soil water content of maize maturity (%) 2016
20 25 30 35 40 45 50 55 20 25 30 35 40 45 50 55 CT25
ST30 ST35 ST40
ST30, the effect of ST35 and ST40 on the construction of reasonable soil layer is more significant, reduced soil bulk density compaction and controlled soil aggregate structure (especially in the 20–40 cm soil layer), the change of soil structure improves the soil water holding capacity of ST35 and ST40 in the soil layer of 30–60 cm, with greater maize yield and reduced mechanical power consumption. The subsoiling tillage at 35 cm constituted the optimum tillage depth for Brow loam in the NCP.
Acknowledgements
Special thanks go to the reviewers who had pro-vided much help to improve this paper.
REFERENCES
Ahmadi I., Ghaur H. (2015): Effects of soil moisture content and tractor wheeling intensity on traffic-induced soil compaction. Journal of Central European Agriculture, 16: 489–502.
Bogunovic I., Pereira P., Kisic I., Sajko K., Sraka M. (2018): Tillage management impacts on soil compaction, erosion and crop yield in Stagnosols (Croatia). Catena, 160: 376–384.
Borghei A.M., Taghinejad J., Minaee S., Karimi M., Varnamkhasti M.G. (2008): Effect of subsoiling on soil bulk density, penetration resistance, and cotton yield in northwest of Iran. International Journal of Agriculture and Biology, 10: 120–123.
Castel J.L., Cantero-Martínez C. (2003): Soil bulk density and pen-etration resistance under different tillage and crop management systems and their relationship with barley root growth. Agrono-my Journal, 95: 526–536.
Chen Y., Liu S., Li H., Li X.F., Song C.Y., Cruse R.M., Zhang X.Y. (2011): Effects of conservation tillage on corn and soybean yield in the humid continental climate region of Northeast China. Soil and Tillage Research, 115–116: 56–61.
Comia R.A., Stenberg M., Nelson P., Rydberg T., Håkansson I. (1994): Soil and crop responses to different tillage systems. Soil and Tillage Research, 29: 335–355.
Dalal R.C., Chan K.Y. (2001): Soil organic matter in rained cropping systems of the Australian cereal belt. Australian Journal of Soil Research, 39: 435–464.
Doty C.W., Campbell R.B., Reicosky D.C. (1975): Crop response to chiseling and irrigation in soils with compact A horizon. Trans-actions of the ASAE, 18: 668–672.
Evans S.D., Lindstrom M.J., Voorhees W.B., Moncrief J.F., Nelson G.A. (1996): Effect of subsoiling and subsequent tillage on soil bulk density, soil moisture, and corn yield. Soil and Tillage Research, 38: 35–46. Fan R.Q., Liang A.Z., Yang X. (2010): Effects of tillage on soil
ag-gregates in black soils in Northeast China. Scientia Agricultura Sinica, 43: 3767–3775.
Guan D.H., Al-Kaisi M.M., Zhang Y.S., Duan L.S., Tan W.M., Zhang M.C., Li Z.H. (2014): Tillage practices affect biomass and grain yield
through regulating root growth, root-bleeding sap and nutrients uptake in summer maize. Field Crops Research, 157: 89–97. Han X.Z., Zou W.X., Lu X.C., Hen D.J. (2015): The soil cultivated
layer in dryland and technical patterns in cultivating soil fertility. Soil and Crop, 2015: 145–150.
Holthusen D., Brandt A.A., Reichert J.M., Horn R. (2018): Soil po-rosity, permeability and static and dynamic strength parameters under native forest/grassland compared to no-tillage cropping. Soil and Tillage Research, 177: 113–124.
Hou X., Li R., Han Q., Wang W., Yang B. (2012): Effect of rota-tional tillage practices on soil properties, winter wheat yields and water-use essicency in semi-arid areas of north-west china. Field Crops Research, 129: 7–13.
Kutílek M. (2004): Soil hydraulic properties as related to soil struc-ture. Soil and Tillage Research, 79: 175–184.
Lin P., Qi H., Li C.F., Zhao M. (2016): Optimized tillage practices and row spacing to improve grain yield and matter transport efficiency in intensive spring maize. Field Crops Research, 198: 258–268. Liu X.W., Feike T., Shao L.W., Sun H.Y., Chen S.Y., Zhang X.Y.
(2016): Effects of different irrigation regimes on soil compaction in a winter wheat-summer maize cropping system in the North China Plain. Catena, 137: 70–76.
Mrabet R. (2011): Effects of residue management and cropping sys-tems on wheat yield stability in a semiarid Mediterranean clay soil. American Journal of Plant Sciences, 2: 202–216.
Nimmo J.R., Perkins K.S. (2002): 2.6 Aggregate stability and size distribution. Methods of Soil Analysis: Part 4: 317–328. Nkakini S.O., Akor A.J. (2013): Effects of tillage on soil moisture
content, Okra (Abelmoshus esculentus) emergence and yields. Journal of Agricultural Mechanization in Asia, Africa and Latin America, 44: 15–21.
Oades J.M., Waters A.G. (1991): Aggregate hierarchy in soils. Aus-tralian Journal of Soil Research, 29: 815–828.
Pikul J.L.Jr., Aase J.K. (2003): Water infiltration and storage affect-ed by subsoiling and subsequent tillage. Soil Science Society of America Journal, 67: 859–866.
Six J., Paustian K., Elliott E.T., Combrink C. (2000): Soil structure and organic matter: I. Distribution of aggregate-size classes and aggregate-associated carbon. Soil Science Society of America Journal, 64: 681–689.
Tian S.Z., Wang Y., Ning T.Y., Li N., Zhao H.X., Wang B.W., Li Z.J., Chi S.Y. (2014): Continued no-till and subsoiling improved soil organic carbon and soil aggregation levels. Agronomy Journal, 106: 212–218.
Van Wie J.B., Adam J.C., Ullman J.L. (2013): Conservation tillage in dryland agriculture impacts watershed hydrology. Journal of Hydrology, 483: 26–38.
Youker R.E., McGuinness J.L. (1957): A short method of obtaining mean weight-diameter values of aggregate analyses of soils. Soil Science, 83: 291–294.