Abstract—Classifying imbalanced data is a significant challenge for machine learning algorithms. Difficulty is due to the fact that data in the minority class can easily be overshadowed by the much larger number of instances in the majority class. The overall classification accuracy may be high, but the recognition of data instances in the minority class are normally unacceptable when applying standard algorithms. Therefore, this research proposes a technique for handling the imbalanced classification problem. We solve the imbalanced classification problem by performing separation of the imbalanced data into overlapped and non-overlapped regions between majority and minority classes. After the separation, data were clustered based on Euclidean distance consideration. Each cluster, then, has its own classification model. To predict the future event, closest distance scheme from all models has been applied. The experimental results show that the proposed technique modeling with the SVM using linear kernel function yields the best performance in classifying minority data.
Index Terms—Imbalanced data classification, overlapping region, clustering, SVM with linear kernel
I. INTRODUCTION
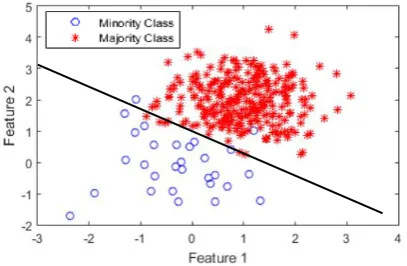
EARNING efficiently the classification model from imbalanced data has gained attention of researchers [1, 2]. The imbalanced data can occur in several applications [3] such as text classifications, medical diagnostic, financing, network intrusions, and so on. When the researchers applied this imbalanced data to the learning algorithm, they found that the induced models from most of the standard algorithms were unable to classify correctly data in the tiny. This is because the boundary of decision acceptable by learning algorithms tends to bias toward the class with larger number of instances, resulting in misclassification data in the smaller class as illustrated in Fig. 1.
[image:1.595.316.520.183.316.2]Many researchers have proposed various methods to solve this problem. These methods can be divided into three main approaches [4]: data level, algorithm level, and cost sensitive, which is the combination of data and algorithm levels.
Fig. 1 Linear classification imbalanced data which bias into majority class.
Data-level approach: this approach deals this problem at the preprocess stage by rebalancing the data distribution using data sampling technique [5] including over-sampling, under-sampling, and a hybrid of over and under-sampling. Algorithm-level approach: this approach deals with the imbalance problem by adjusting the parameters during the model learning process with bias toward the class having smaller number of instances. Cost-sensitive approach: at the data level, this approach [6] tries to assign higher cost to data instances that are misclassified. At the algorithm level, it performs fine-tuning to learning steps to make fewer mistakes. Most of the three groups of classification methods focus on the classification accuracy over small group. Some important methods are as follows.
Brown and Mues [7] used undersampling technique to increase five credit scoring imbalanced datasets .They found that the Random Forest and Gradient Boosting techniques can classify efficiently in a large class imbalance, while classifying with C4.5 and quadratic discriminant analysis (QDA) techniques are the worst.
Cateni et al. [8] proposed new technique called similarity-based under-sampling and normal distribution-similarity-based over-sampling (SUNDO), which combines the overover-sampling and undersampling techniques. They applied the SUNDO method to four classifiers: support vector machine (SVM), decision tree, labelled self-organizing map and Bayesian classifier. They evaluated the models on four binary datasets: synthetic data, the Wisconsin breast cancer dataset, and two real world datasets from the metal industry. The experimental results showed that their proposed method was efficient on classifying imbalanced data.
López et al. [9] used the two sampling techniques: SMOTE+ENN and SMOTE. Then performed the cost-sensitive learning with these algorithms: C4.5, SVM, fuzzy hybrid genetic based machine learning rule generation, and k-nearest neighbor. They found that all techniques can
A Cluster Based Classification of Imbalanced
Data with Overlapping Regions Between Classes
Pasapitch Chujai, Kittipong Chomboon, Kedkarn Chaiyakhan, Kittisak Kerdprasop,
Nittaya Kerdprasop
L
Manuscript received December 10, 2016; revised January 16, 2017. P. Chujai is a lecturer with the Electrical Technology Education Department, Faculty of Industrial Education and Technology, King Mongkut’s University of Technology Thonburi, Bangkok, Thailand (e-mail: [email protected]).
K. Choomboon is a PhD and data mining expert at the Seagate Technology, Korat Plant, Thailand (e-mail: [email protected]).
K. Chaiyakhan is a lecturer with the Computer Engineering Department, Rajamangala University of Technology Isan, Muang, Nakhon Ratchasima, Thailand (phone: +66 868129127; e-mail: [email protected]).
K. Kerdprasop is an associate professor and chair of the School of Computer Engineering, Suranaree Universiyof Technology, Nakhon Ratchasima, Thailand (e-mail: [email protected]).
Krawczyk et al. [10] applied cost-sensitive learning with decision tree ensemble to classify imbalanced data. They compared the proposed method with several ensemble methods. They found that their proposed method was efficient in some datasets.
Liao et al. [11] proposed the ensemble learning method by combining the SVM, multiple feature selection, back-propagation neural network (BPNN) ensemble, and rough set theory (RST). They also rebalanced the data in the stage of preprocessing by SVM algorithm, selected the features, learned ensemble by the BPNN algorithm, and took the outputs from ensemble learning to build new knowledge by using the rough set theory. The result showed that their proposed method was more efficient than other methods.
In this research, we are aware of both the importance and the practicality of imbalanced data classification. So, we present a feasible idea to the data imbalanced problem by firstly partitioning data into two regions: overlapped region and non-overlapped region. The intuitive idea of region partitioning is that data with class imbalance can share some overlapping region between majority and minority classes. Therefore, each data region should have its own model representing its unique characteristic. We apply clustering to determine appropriate regions. We then apply the SVM with linear, polynomial, and RBF kernels to build ensemble models for each data region.
II. BACKGROUND
A.Imbalanced Data
The characteristic of imbalanced datasets is that data in one group (called majority or negative class) has larger amount of instances than the other (called minority or positive class) [12]. The nature of the imbalanced data can be divided into three cases [13].
1)Imbalanced Ratio
Imbalanced ratio (IR) is the proportion of majority data ( ) to the minority ( )[14]. The imbalanced ratio can be defined by equation (1).
(1)
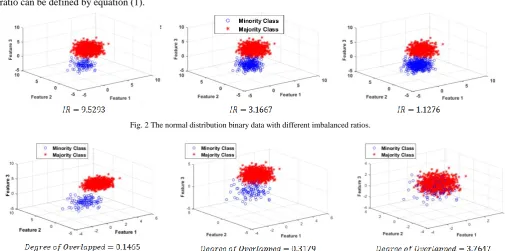
The higher IR indicates the more imbalance between classes. The example of imbalanced data with different IR is shown in Fig. 2.
2)Degree of Overlap
The overlap occurs when different classes share the same area. Overlap can cause more difficulty to the data classification, especially in the imbalanced data [15].
The degree of overlap can be defined in equation (2) based on the maximum Fisher’s discriminant ratio [9, 16] of all dimensions. The imbalanced data with various degrees of overlap is shown in Fig. 3.
(2)
where
is Fisher’s discriminant ratio of dimension ,
are means of majority class and minority class, respectively,
are variances of majority class and minority class, respectively.
3)Lack of data
[image:2.595.47.553.510.761.2]The small sample size [12] can occur in minority class of imbalanced data. It has an effect on finding the patterns.
Fig. 2 The normal distribution binary data with different imbalanced ratios.
B.Support Vector Machine (SVM)
[image:3.595.309.547.51.264.2]Support vector machine [17] is a supervised learning algorithm, which can be used for classification, regression or others problems. The basic idea of SVM is to find the optimal hyperplane with maximum margin between two classes as shown in Fig. 4. To separate the data, this algorithm constructs two parallel lines on each side of the hyperplane. The high distance between these parallel lines implies the better classification on future data.
Fig. 4. Optimal hyperplane with maximum margin.
C. k-Means Clustering
The simplest unsupervised learning algorithm to solve the clustering problem is k-means algorithm [18], with k representing number of groups. This algorithm performs clustering based on the computation of Euclidean distance between data points and the k central points.
D. Euclidean Distance
Euclidean distance [11] is used for measuring the distance
between two vectors and
. The distance can be computed as in equation (3).
(3)
III. METHODOLOGY
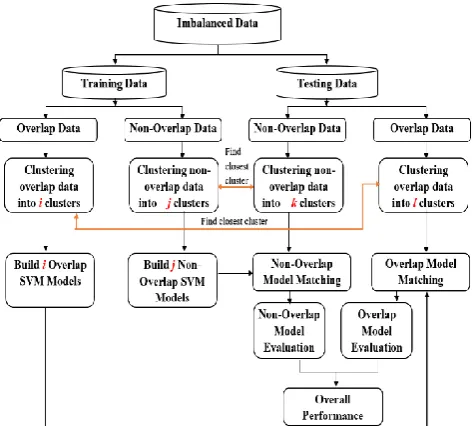
The main objective of this research is to find the efficient method for classifying imbalanced data. Imbalanced datasets can have different imbalance ratios and possibly overlapping regions between different data classes. Therefore, we propose to solve this imbalance and overlap data classification problem by splitting data into two regions: overlap regions and non-overlap regions. Each region is then clustered into k clusters. We finally build k SVM models. The framework of the proposed idea is shown in Fig.5. The detail of each step can be explained as follows:
A. Train-Test Data Preparation
We divided the imbalanced data into train set and test set. Each set consists of two classes: majority class and minority class. We choose 70% of majority class and 70% of minority class for train set and 30% of majority class and 30% of minority class for test set.
Fig. 5 Framework of the proposed imbalanced data classification method.
B.Building the Model
Building the proposed model with three steps as follows: 1)Overlap and Non-Overlap Region Separation
The training data were separated into two regions: overlap region and non-overlap region, using Euclidean distance technique. The details of this step are already explained in [19].
2)Building the Clusters
After the data were separated, they were clustered using k-Means algorithm. The silhouette technique was used to find the optimal k clusters. At this stage, we obtain two clusters of the overlap data (cTr1 and cTr2) and three clusters of non-overlap data (cTr3, cTr4 and cTr5)
3)Building the SVM Models
The classification model of each cluster from the previous step was built by using SVM algorithm with three kernel functions: linear, polynomial, and RBF. We thus got five models: two model from overlap data and three models from non-overlap data and the names of each model are mTr1, mTr2, mTr3, mTr4, mTr4 and mTr5, respectively.
C.Model Evaluation
For testing the performance of the proposed method, the three following steps were performed:
1)Testing Data Preparation
To test the model, testing data from step A were prepared to be the same format of training data, using the step B.1 and B.2. Here, we get two clusters of overlap data (cTs1 and cTs2) and two clusters of non-overlap data (cTs3 and cTs4).
2)Optimal Model Selection
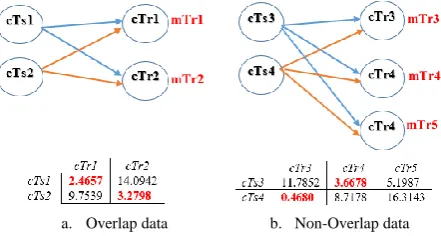
For finding the optimal model for each cluster, we employed Euclidean distance technique to find the closest cluster, and the concept is shown in Fig.6.
[image:3.595.81.261.174.334.2]a. Overlap data b. Non-Overlap data
Fig. 6 Conceptual idea to find the optimal model.
D.Test Performance of the Proposed Model
The optimal model will be tested to evaluate its performance on both overlap model and non-overlap model. Finally, find the overall performance.
IV. EXPERIMENTAL EVALUATION
A.Datasets
The proposed method has been developed for binary (or two-class) classification and tested with the standard benchmarking datasets from the KEEL repository[20]. We take seven binary imbalanced datasets; the details are in Table 1.
From Table 1, #att is the number of attributes, #ins is the number of instances, #maj is the number of instances in the majority class, #min is the number of instances in the minority class, IR is the imbalanced ratio between two classes and degree of Overlapped is the maximum Fisher’s value of two classes.
TABLEI
DETAILS OF TWO-CLASS IMBALANCED DATASETS USED IN THE EXPERIMENTS.
Data Sets #att #ins #maj #min IR degree of Overlapped
German 24 1000 700 300 2.33 2.8225
Haberman 3 306 225 81 2.78 5.4591
Liver 6 345 200 145 1.38 18.2492
Page-Blocks
10 472 444 28 15.89 0.6648
Pima 8 768 500 268 1.87 1.7413
Vehicle1 18 846 629 217 2.90 5.9334
Vehicle3 18 846 634 212 2.99 5.4096
B.Evaluation Metrics
For evaluating the accuracy and reliability of the proposed method, we used five measures: true positive rate, true negative rate, f-measure, g-mean and overall accuracy. The computations of the four cases are as follows:
True Positive Rate (TPR): (4)
True Negative Rate (TNR): (5)
Precision: (6)
F-measure: (7)
G-mean: (8)
Accuracy: (9)
Where are the number of instances correctly classified as positive class and negative class, respectively.
is the number of instances in negative class that are wrongly classified as positive.
is the number of instances in positive class that are incorrectly classified as negative.
C.Results and Analyses
In this section, we present the experimental results obtained from the evaluation of the proposed method with six standard benchmark imbalanced data. The results consist of three parts: the first part is the result from partition data into two regions: overlap region and non-overlap region, the second part is the results of clustering data and the third part was classification results.
1)Region separation results
For region separation step, the data set was partitioned into two regions: overlap region and non-overlap region, by using Euclidean distance. The test set in each region is shown in Table 2.
2)Cluster results
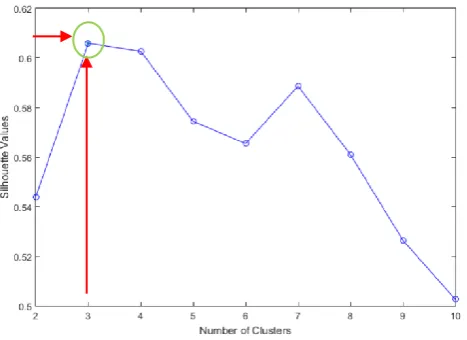
After the data were separated, they were clustered using k-Means algorithm. The silhouette was used to determine the optimal number of clusters. From Fig. 7, the suitable number of clusters of Haberman dataset is 3. Thus, the data was grouped into three clusters.
We did this in order to cluster data into suitable clusters to classification method. The results of the suitable clusters are given in Table 3. From the Table 3, we found that the suitable clusters of almost datasets is two clusters on both regions.
TABLEII
THE SUMMARY DESCRIPTION OF TEST SET IN OVERLAP AND NON-OVERLAP AREAS.
Dataset
Overlap Non-Overlap Total
#maj #min #maj #min #maj #min
German 173 62 37 28 210 90
Haberman 50 16 17 8 67 24
Liver 48 32 12 11 60 43
Page-Blocks 29 3 104 5 133 8
Pima 117 18 33 62 150 80
Vehicle1 127 39 62 26 189 65
Vehicle3 132 41 58 23 190 64
TABLEIII
Fig. 7 The silhouette criterion for determining number of clusters.
3)Classification results
[image:5.595.309.550.55.187.2]After the data were clustered, they were classified by standard SVM algorithm using linear kernel, polynomial kernel and RBF kernel. We performed the experiments over the imbalanced test sets. The performance of those models was evaluated by measurement as follows: true positive rate (TPR), true negative rate (TNR), f-measure (F*), g-mean (G*) and overall accuracy (ACC). Finally, the final results were calculated in terms of percentage of these measurements. The results of the experiments are given in Table 4.
This research will focus on the classification performance of minority class and it also must be able to classify majority class more effectively as well. The results from Table 5 show that the model from our proposed method can classify minority class more efficiently based on the TPR value. We found that the SVM with linear kernel model can classify minority class efficiently. This kernel model can classify page-block dataset correctly with TPR = 100%, the TPR of vehicle1 and vehicle3 datasets are 96.92% and 95.31%, respectively. This model is however not good enough to classify efficiently the Haberman dataset (TPR = 70.83%).
For comparison with other methods, we used the results from SVM with linear kernel model to compare against standard SVM algorithm with linear kernel and the results reported by Piyanoot et al. [21] that separated imbalanced data into three groups: non-overlapping data, borderline data, and overlapping data. The comparison results based on the three measurements, TPR, G* and F*, are summarized in Table 5 and graphically shown in Fig.8-Fig.10.
[image:5.595.308.548.143.526.2]Fig. 8 TP-rate comparision between our proposed method and others.
Fig. 9 G-mean comparison of our method and others.
Fig. 10 F-measure comparision between our proposed model and others.
From Table 5, the proposed method shows the quite satisfactory performance with highest TRP and G* values, comparing with other methods. This means that our method can classify efficiently both minority class and majority class.
TABLEIV
CLASSIFICATION RESULTS FOR IMBALANCED DATASETS WITH THE PROPOSED METHOD.
Dataset
Linear Polynomial RBF
TPR TNR G* F* ACC TPR TNR G* F* ACC TPR TNR G* F* ACC
German 73.33 72.38 72.86 61.68 72.67 48.84 78.10 61.76 48.28 69.59 26.67 94.29 50.14 38.10 74.00
Haberman 70.83 79.10 74.85 61.82 76.92 47.83 68.18 57.10 45.83 61.19 17.39 84.09 38.24 23.53 61.19
Liver 81.40 66.67 73.66 71.43 72.82 79.07 68.33 73.51 70.83 72.82 65.12 85.00 74.40 70.00 76.70
Page-Blocks 100.00 99.25 99.62 94.12 99.29 100.00 97.74 98.87 84.21 97.87 62.50 96.99 77.86 58.82 95.04
Pima 76.25 78.67 77.45 70.52 77.83 68.75 74.00 71.33 63.22 72.17 51.25 83.33 65.35 56.16 72.17
Vehicle1 96.92 87.83 92.26 83.44 90.19 76.92 87.83 82.20 72.46 85.04 47.69 94.71 67.21 58.49 82.68
[image:5.595.310.547.228.376.2] [image:5.595.309.547.388.515.2]TABLEV
COMPARISON BETWEEN THE BEST RESULTS FROM OUR PROPOSED METHOD AND OTHER METHODS.
Dataset
SVM (Linear) Piyanoot et al. (2015) Our Proposed Method
TPR G* F* TPR G* F* TPR G* F*
German 66.67 66.19 54.05 32.54 67.26 42.57 73.33 72.86 61.68
Haberman 0.00 0.00 NaN 32.54 71.03 41.62 70.83 74.85 61.82
Liver 76.74 72.42 69.47 52.65 68.68 19.64 81.40 73.66 71.43
Page-Blocks 87.50 91.41 66.67 19.59 71.86 90.58 100.00 99.62 94.12
Pima 65.00 72.11 64.20 06.59 71.12 58.63 76.25 77.45 70.52
Vehicle1 81.54 78.27 64.24 57.47 65.06 09.53 96.92 92.26 83.44
Vehicle3 87.50 81.72 67.88 38.45 62.56 73.48 95.31 91.80 82.99
When considering the F* value that represents classification performance in terms of both precision and recall for minority class, we found that our proposed method was statistically better than others on almost all imbalanced datasets, except the Haberman dataset that the method from Piyanoot et al. can classify more efficient than ours.
V. CONCLUSIONS
In this research, we propose a method to deal with the imbalanced data classification problem with its main focus on improving the recognition of the minority class, while retaining high efficiency on classifying majority class. In our model, the imbalanced dataset was separating between overlapped region and non-overlapped region, by using Euclidean distance technique. After the data were separated, they were clustered using k-means algorithm. In this step, we applied silhouette technique to find the optimal number of data clusters. Finally, the standard SVM algorithm with linear kernel, polynomial kernel and RBF kernel were applied to build models. The experimental results show that the overlapping ratio between classes has an effect to the performance of the proposed algorithm, although we cluster data in order to reduce degree of overlap. However, the proposed method is still showing good performance on classifying imbalanced data with various degrees of overlap. We found that the appropriate kernel function is linear kernel. This kernel can be used for classifying minority class more efficiently if the main concern is TPR value. While polynomial kernel function is not as good as the linear kernel. Overall, the proposed method shows that the performance is quite satisfactory with highest TRP value and G* value. This means that our method can be used to classify efficiently both of minority class and majority class.
REFERENCES
[1] H. He and E. Garcia, “Learning from imbalanced data,” IEEE Trans. Knowledge and Data Engineering, vol. 21, no. 9, pp.1263–1284, 2009.
[2] C. X. Wang, L. L. Dong, Z. M. Pan and T. Zhang, “Classification for Unbalanced Dataset by an Improved KNN Algorithm Based on Weight,” Information, vol. 15, no. 11(B), pp. 4983-4988, 2012. [3] N.V. Chawla, “Data mining for imbalanced datasets: an overview,”
In: Data Mining and Knowledge Discovery Handbook, Springer US, pp. 875–886, 2012.
[4] M. Galar, A. Fernandez, E. Barrenechea, H. Bustince and F. Herrera, “A review on ensembles for the class imbalance problem: bagging-, boosting-, and hybrid based approaches,” IEEE Trans. Systems, Man, and Cybernetics-Part C, vol. 42, no. 4, pp. 463–484, 2012.
[5] C. Jian, J. Gao and Y. Ao, “A new sampling method for classifying imbalanced data based on support vector machine ensemble,” Neurocomputing, vol.193, pp. 115-122, 2016.
[6] F. Cheng, J. Zhang and C. Wen, “Cost-Sensitive Large margin
Distribution Machine for classification of imbalanced data,” Pattern Recognition Letters, vol. 80, pp. 107-112, 2016.
[7] I. Brown and C. Mues, “An experimental comparison of classification algorithms for imbalanced credit scoring data sets,” Expert Systems with Applications, vol. 39, no. 3, pp. 3446-3453, 2012.
[8] S. Cateni, V. Colla and M. Vannucci, “A method for resampling imbalanced datasets in binary classification tasks for real-world problems,” Neurocomputing, vol. 135, pp. 32-41, : 2014.
[9] V. López, A. Fernández, J. G. Moreno-Torres and F. Herrera, “Analysis of preprocessing vs. cost-sensitive learning for imbalanced classification: Open problems on intrinsic data characteristics,” Expert Systems with Applications, vol. 39, no. 7, pp. 6585-6608, 2012. [10] B. Krawczyk, M. Wozniak and G. Schaefer, “Cost-sensitive decision tree ensembles for effective imbalanced classification,” Applied Soft Computing, vol. 14, pp. 554-562, 2014.
[11] J. Liao, C. H. Shih, T. F. Chen and M. F. Hsu, “An ensemble-based model for two-class imbalanced financial problem,” Economic Modeling, vol. 37, pp. 175-183, 2014.
[12] S. L. Phung, A. Bouzerdoum and G.H. Nguyen, “Learning pattern classification tasks with imbalanced data sets,” In P. Yin (Eds.), Pattern recognition, Vukovar, Croatia: In-Teh, pp.193-208, 2009. [13] N.V. Chawla, K.W. Bowyer, L.O. Hall and W. P. Kegelmeyer,
“SMOTE: synthetic minority over-sampling technique,” Journal of Artificial Intelligence Research, vol. 16, pp. 321–357, 2002. [14] M. Gao, X. Hong, S. Chen and C. J. Harris, “Probability density
function estimation based over-sampling for imbalanced two-class problems,” In Proc. 2012 Int. Joint Conf. on Neural Networks (IJCNN), pp. 1-8, 2012.
[15] Luengo,J., Fernández,A. and Herrera, F., Addressing data-complexity for imbalanced data-sets: A preliminary study on the use of preprocessing for c4.5, In Intelligent Systems Design and Applications, 2009. ISDA'09. Ninth International Conference on IEEE, (2009), 523-528.
[16] M. Galar, A. Fernandez, E. Barrenechea, H. Bustince and F. Herrera, “A Review on Ensembles for the Class Imbalance Problem: Bagging-, Boosting-, and Hybrid-Based Approaches,” IEEE transactions on systems, man, and cybernetics—part C: Applications and reviews, vol. 42, no. 4, 2012.
[17] B. E. Boser, I. M. Guyon and V. N. Vapnik, “A training algorithm for optimal margin classifiers,” In Proceedings of the fifth annual workshop on Computational learning theory, ACM, pp. 144-152, 1992.
[18] S. J. Yen and Y. S. Lee, “Cluster-based under-sampling approaches for imbalanced data distributions,” Expert Systems with Applications, vol. 36, no. 3, pp. 5718-5727, 2009.
[19] K. Chomboon, “Classification technique for minority class on imbalanced dataset with data partitioning method,” Suranaree University of Technology, 2015.
[20] Keel repository of machine learning database [Online]. Available: http://www.keel.es/datasets.php.