Optimization of Gradient-Echo MR for Calcium Detection
Mark Henkelman and Walter Kucharczyk
PURPOSE: To determine optimal MR gradient-echo sequences for the visualization of calcium in neurologic MR. METHOD: The dependence of signal intensity and image contrast on the imaging parameters repetition time, echo time, flip angle, and spoiling were measured for hydroxyapatite samples. Calculations of signal intensity were shown to correspond to these measures. RESULTS: Optimum detectibility was obtained with an echo time of 29 msec and was independent of spoiling. As repetition time ranged from 30 msec to 700 msec, the optimal flip angle ranged from 17° to
66°. CONCLUSIONS: Gradient-echo sequences that optimize the contrast for detection of calcium in neurologic imaging have been determined.
Index terms: Brain, calcification; Brain, magnetic resonance; Magnetic resonance, gradient-echo; Magnetic resonance, technique; Magnetic resonance, tissue characterization
AJNR Am J Neuroradio/15:465-472, Mar 1994
The effect of calcium on tissue signal intensity in magnetic resonance (MR) is variable (1-6). Calcified tissue may be hypointense, isointense, or hyperintense depending on the concentration of the calcium, surface area of the calcium par-ticles, and the MR technique used. lsointense calcified lesions, that is, those that have signal intensity similar to that of surrounding tissue, pose a particularly difficult diagnostic problem. They may be overlooked entirely or the presence of calcium within the lesion may not be appreci-ated. In the former case, the result is a false-negative examination, in the latter case, a finding of potential differential diagnostic significance is lost. Clearly, the ability to determine the presence
or absence of calcium in tissue is diagnostically beneficial.
Gradient-echo imaging has been shown to be more effective than spin-echo techniques in the detection of calcium (1 ). Calcified structures are more consistently demonstrated, typically as
hy-Received March 12, 1993; accepted pending revision May 3; revision
received May 24.
From the Department of Medical Biophysics (M. H.) and Radiology (W. K.}, University of Toronto, Ontario, Canada.
Address reprint requests to Walter Kucharczyk, MD, FRCP(C), De
-partment of Radiology, University of Toronto, Room 127 FitzGerald Building, 150 College Street, Toronto, Ontario, M5S 1A8 Canada.
AJNR 15:465-472, Mar 1994 0195-6108/94/1503-0465
© American Society of Neuroradiology
465
pointense regions in the image. The hypointensity is caused by the low proton density of calcified tissue and, more importantly, by the dephasing imparted to water protons in the local magnetic gradients created by the differences in magnetic susceptibility around calcium particles. Because gradient-echo techniques lack refocusing radio-frequency pulses, intravoxel dephasing accumu-lates, making the lesions appear dark. Diffusion of spins through these inhomogeneities, which is
the dominant mode of signal loss on spin-echo
imaging, is completely masked by intravoxel de-phasing in gradient-echo imaging. The greater the degree of hypointensity of the calcified tissue compared with surrounding normal tissue, the more obvious it will be. It is the purpose of this paper to examine the dependence of signal inten-sity and image contrast on repetition time (TR),
echo time (TE), flip angle, and spoiling at different calcium concentrations and to compare the ex-perimental results with theoretical predictions. Recommendations are then made on an optimal MR technique for the detection of calcium with gradient-echo imaging.
Materials and Methods
466 HENKELMAN
uniformly suspended in 2% agarose gel to avoid sedimentation. Concentrations varied from 0 to 350 mg of calcium per milliliter of suspending medium in steps of 50 mg/mL covering the clinically relevant range of concentrations deter-mined from computed tomography. The tubes were immersed in a water bath to minimize mac-roscopic susceptibility effects. The calcium hy-droxyapatite, herein referred to simly as calcium, is a powder with average grain size of 10 ,urn and solid density of 2.18 g/mL and surface area of 67m2/g.
All imaging was performed on a whole-body MR imager operating at 1.5 T (Signa General Electric Medical Systems, Milwaukee, Wis). Sin-gle sections in the coronal plane were imaged with the following parameters: field of view 20 em, 256 X 256 resolution, various acquisition sequences, and a thin section of 5 mm to ensure that macroscopic intravoxel dephasing did not occur in the section selection direction.
Signal intensity in regions of interest that en-compassed the central 80% of the cross-sectional area of each tube were measured. In all cases, corrections for radio frequency coil homogeneity were made based on measurements at the same geometric locations in a large homogeneous phantom. Corrections for background signal in-tensity were calculated using a method previously described (7). Measurements of background in-tensity were made in the corner of the image away from any artifacts.
Relaxation times were measured as follows: T 1 was measured with repeated saturation-recovery spin-echo sequences with a TE of 12 msec and a TR of 50, 100, 200, 400, 800, 1600, and 3200 msec. The T1 values were extracted using a three-parameter least-squares fit to measure-ments of image intensity. T2 was measured using a single section optimized Carr-Purceii-Meiboom-Gill MR sequence with a TR of 1000 msec and 16 echoes evenly spaced between 0 and 240 msec (8). Single-component T2 values were ex-tracted using two-parameter least-squares fit to the data. Mo values (the relative proton density) were extrapolated from the T1 data using appro-priate corrections for the T2 decay during the TE at 12 msec and were also extrapolated from the T2 data using appropriate corrections for the lack of T1 recovery during a TR of 1000 msec. The Mo values at each concentration of calcium were averaged to determine the proton density de-pendence on calcium concentration.
AJNR: 15, March 1994
T2* values were obtained from a gradient-recalled acquisition in the steady state (GRASS) (9) sequence with a TR of 1500 msec, flip angle of 30°, and TE of 5, 7.5, 10, 12.5, 15, 17.5, 20, 22.5, 25, 30, and 40 msec. The regions of interest from each tube were fit to a single component T2* decay with the same fitting routine as the T2. These data were also analyzed in terms of the signal difference between each calcium con-centration and that of agarose gel without calcium to determine which TE gave maximum contrast. This value of TE (20 msec in the phantom ex-periments) was used for the remainder of the measurements.
With the preliminary characterization of the phantom complete, spoiled GRASS (SPGR) im-ages (or equivalently fast low-angle shot (FLASH) [10]) were taken of the phantom with TR values of 30, 100, and 500 msec representing short, intermediate, and long TR values using 8, 4, and 1 excitations, respectively, to ensure that good signal-to-noise ratio was obtained in every exper-iment. For each TR, images were acquired with flip angles of 5°, 10°, 15°, 20°, 25°, 30°, 40°, 50°, and 60°. Transmitter and receiver gains were kept constant to ensure that quantitative measure-ments could be compared. After completion of the 3 X 9 = 27 SPGR images, the complete experiment was repeated with single-section GRASS and the same timing parameters.
Theoretical signal intensity was calculated for each of the SPGR measurements using previously reported equations for signal intensity for spoiled FLASH or spoiled GRASS sequences (11, 12). The expression used was:
f
z } _ e-RJlCa]TRmox sin(a(z)) dz.
-zmox 1 - COS(a(z))e-RifCa]TR
(1)
AJNR: 15, March 1994
2.0
0.0 '----'---....1-.----1--....L..--.1..---L----l
0 50 100 150 200 250 300 350
A
[Ca] mg/mlc
[Ca] mg/ml'u
Q)
C/J
...._, 35
10
5
MR OF CALCIUM 467
0'----'---....I-.----1--....L..--.1..---L_~
,..-.._
(.)
Q)
C/J ...._,
*
0
8
150
100
or
50D
50 100
50 100
150 200 250 300 350
[Ca] mg/ml
150 200 250 300 350
[Ca] mg/ml
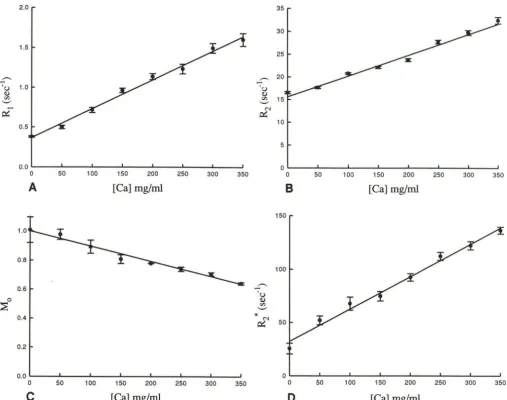
Fig. 1. Measured relaxation rates as a function of calcium concentration for A, T 1; B, T2; D, T2*. C shows the relative spin density, which decreases as the calcium concentration increases. The data points are experimental and the error bars representing the standard deviations of the fitted experimental rates. The straight lines on the graphs are linear regressions for which the parameters are summarized in Table 1.
For the calculations presented in this paper, the radio frequency excitation pulse is taken to be a single-lobed sine pulse multiplied by a Hamming filter ranging from 1.0 at the center of the radio frequency pulse down to 0.08 at the second zero crossing of the sine function. Because the flip angles of importance in this experiment are small, the nonlinearities of the Bloch equations are ig-nored and the flip angle profile a(z) is taken to be the Fourier transform of the radio frequency excitation pulse.
The Tl and T2* values for normal brain were measured in a volunteer and the results were used with the established signal intensity equa-tions to determine optimal gradient-echo
se-quences for visualizing calcium in the brain. The optimal sequence was used to examine a patient, with multiple intracerebral calcifications caused by cysticercosis. TR, TE, and flip angle were varied for comparison purposes.
Results
The physical characterization of the phantom parameters are shown in Fig 1. In all cases, the decay (or recovery) curves deviated from a mono-exponential, as has been reported previously (6).
[image:3.615.54.562.78.478.2]468 HENKELMAN
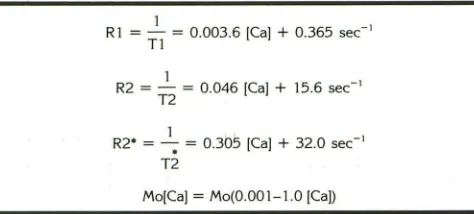
TABLE I: Linear regression relationships characterizing calcium doped gels as a function of solute concentration
1
R1 = - = 0.003.6 ]Ca] + 0.365 sec-1
T1
1
R2 = - = 0.046 ]Ca] + 15.6 sec-1
T2
1 .
R2• = - ; = 0.305 ]Ca] + 32.0 sec-1 T2
Mo[Ca] = Mo(0.001-1.0 [Ca])
Note.- The concentration of calcium [Ca] is expressed in milligram per milliliter of gel solution.
linear functions of the concentration of calcium.
On the GRASS images, the signal difference be-tween various concentrations of calcium and the zero concentration gel phantom were evaluated as a function of TE. Although the TE time for maximum contrast decreases slightly with in-creasing calcium concentration, the contrast at a
TE of 20 msec for all concentrations exceed 90%
of its maximum value. Thus, the remainder of
the experiments were performed with a fixed TE
of 20 msec. It should be noted, however, that the
optimal TE will be longer with lower calcium concentrations and will also depend on the T2* of the background tissue.
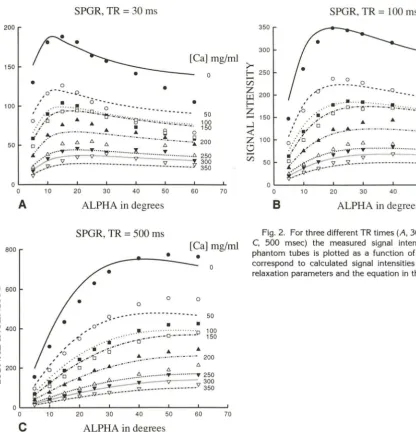
Figure 2 shows the SPGR signal intensity meas-ured in each tube with varying calcium
concen-tration for a short, intermediate, and long TR
value as a function of flip angle. The data points
are measured from the images and the lines are
calculated using the equation presented in the
methods section. The actual R 1 and R2* values
that were measured for this same section and
which are shown in Fig 2 were used for the
calculated lines. The only free parameter is k, the
scaling between the theoretical magnetization
(normalized to 1 for water with a TE of 0 and a
TR at oo) and the measured regions of interest. It
was determined to have a value of 3795 by
least-squares fit to the 216 data points.
In general, there is very good agreement
be-tween the experiment and theoretical
expres-sions. The greatest discrepancies occur with large
flip angles, for which the assumption of the
line-arity of the Bloch equations is least valid.
How-ever, because the calculations are subsequently
used for small flip angles, the agreement is more
than adequate. For short TR times (30 msec), the
maximum signal occurs with small flip angles (5
to 10°). However, for long TR times (500 msec),
the total signal intensity is much larger and the
AJNR: 15, March 1994
optimum flip angle increases to the 25° to 40°
range.
The results with the GRASS sequence that is
not spoiled are shown in Fig 3. For TR of 100
msec and 500 msec, the GRASS signal intensities
did not differ significantly from the SPGR results.
This is expected because the susceptibility effects shorten T2* to a level at which the transverse magnetization at TR greater than 1 00 msec has
been effectively reduced below 2% for calcium
concentrations even as low as 50 mg/mL. Thus, for steady-state sequences such as GRASS, the inhomogeneity serves to dephase the transverse magnetization, making the signal intensities equivalent to SPGR except in the case of very
short TR (30 msec), as shown in Fig 3. The signal
is greater for the low concentration of calcium at larger flip angles in the GRASS sequences than in the SPGR sequence because residual
magnet-ization is maintained and not dephased; with a
TR of 30, some of the transverse magnetization
remaining before any radio frequency excitation is added to the new transverse magnetization generated by the next flip angle pulse. However, in the region where calcium contrast is maximum (flip angle between 5° and 15°), the GRASS and SPGR sequences behave essentially equivalently. Having demonstrated the validity of Equation 1 to describe accurately the experimental results in a phantom, we use the mathematical
expres-sion for signal intensity to optimize the pulse
sequence to obtain maximum calcium contrast in brain imaging. For applications to human brain
imaging, the T1 and T2* of healthy volunteer
brain (average of gray and white matter) were
measured to be 910
±
20 msec and 59±
5msec, respectively. Assuming that the relaxivity of calcium in the brain is the same as that
demonstrated in the calcified gel samples, then
the relaxation rates of calcified brain ([Ca] is the
calcium concentration in milligrams per milliliter)
would be expected to be
R1 = 0.0036 [Ca]
+
1.10 sec-1 and R2*= 0.305 [Ca]
+
17 sec-1.For each choice of TR and [Ca], the flip angle and
TE values that maximize the contrast efficiency
are determined. The contrast efficiency is defined as the signal difference per square root of time
and is given by:
ff. . S(Ca = 0) - S(Ca)
e tctency = .
[image:4.612.56.293.106.213.2]AJNR: 15, March 1994
200
>-
150E-<
-V)
z
w
E-< 100
z
.......:l
<(
z
500
-V)
SPGR, TR = 30 ms
•
[Ca] mg/ml
0
0~--~----~--~----~--~----~--~
800
>-
600t
V)ffi
E-< 400z
-
....:l<(
5
200-V)
0 10
A
20 30 40 50
ALPHA in degrees
SPGR, TR = 500 ms
•
00
---q •••••
60 70
[Ca] mg/ml
0
0
50
0 ~~~----~--~----~--~~--~--~
0 10 20 30 40 50 60 70
c
ALPHA in degreesThe square root of time (the total time to acquire the image) is included to ensure that the signal difference-to-noise ratio achievable per
equiva-lent duration of imaging time are being compared
(13). As has been noted previously (14), the achievable contrast efficiency is relatively
inde-pendent of TR provided TR is less than Tl and
provided optimal flip angles are used. Provided
TE is between 26 and 32 msec, for all calcium
concentrations from 50 to 300 mg/mL, 90% of
the maximum possible contrast will be obtained for flip angle values within the range shown in Fig 4. Fortunately, the flip angles and TEs that maximize the signal-to-noise ratios for differing
concentrations of hydroxyapatite are relatively,
but not totally, independent of calcium concen-tration as shown in Table 2. This allows se-quences to be defined that are near maximally
MR OF CALCIUM 469
SPGR, TR = 100 ms
350
300
>-E-< 250
-V)
ffi
200r
[image:5.615.65.481.75.506.2]z
... 150....:l
<(
z
1000
-V)50
0
0 10 20 30 40 50 60 70
8
ALPHA in degreesFig. 2. For three different TR times (A, 30 msec; B, 100 msec; C, 500 msec) the measured signal intensity for the various phantom tubes is plotted as a function of flip angle. The lines
correspond to calculated signal intensities using the measured
relaxation parameters and the equation in the methods section.
effective in searching for calcification even when
the degree of calcification is not known. Because
the contrast efficiency is independent of TR
(pro-vided the appropriate flip angle is used), the
repetition time can be selected on the basis of
patient throughput, motion artifacts, numbers of
sections required, and image contrast desired for the brain.
The images of the patient examined with a variety of TRs, TEs and flip angles demonstrated
(Fig 5) that abnormal calcified tissue is evident
on all the gradient-echo images, more so on some
than on others. There was little dependence on flip angles with respect to lesion contrast. The
best contrast was on the image for which flip
angle was optimized for TR to give the greatest normal brain signal, but the difference was small
[image:5.615.301.551.79.285.2]470 250 200 :>-
E
-C/Jz
150U..l
E-z
- 100 U..l 0 <t::~ so
-HENKELMAN
Image Intensity Ys Flip Angle (TR = 30 ms)
•
•
•
0 0 0
0 0
•
•
1!1 1!1~ 0
0
•
... ... ...! 6. 6. 6. IJ,
•
0•
0 ... 6.GRASS •
SPGR o
•
0 0 ... 6.•
0 0•
0[Ca] mg/ml
•
0 0
0 100
t 300
0~---L--~~---L--~----~--~--~
0 10 20 30 40 50 60 70
ALPHA in degrees
Fig. 3. For a TR of 30 msec, the SPGR results (open symbols) are compared with the unspoiled GRASS results (solid symbols).
At large flip angles and small calcium concentrations, the un-spoiled sequence gives slightly higher signal intensity. However,
the differences are not sufficiently large to be important.
100
ell 80 <I) <I) ... 00 <I) 60 "0
.s
<t::::c:
400...
~
200
20 50 100 200 500 1000
TR (msec)
Fig. 4. For all calcium concentrations from 0.10 to 0.30 g/ mL, the contrast efficiency is within 90% of its maximum value provided the flip angle (in degrees) for each TR value {in milli-seconds) is selected between the two solid lines.
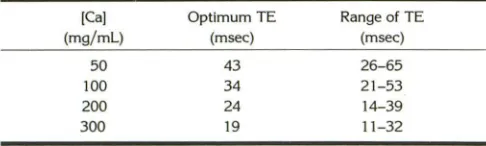
TABLE 2: Maximum lesion contrast in brain as a function of calcium concentration ([Ca)) and echo time (TE)
[Ca) Optimum TE Range of TE
(mg/ml) (msec) (msec)
50 43 26-65
100 34 21-53
200 24 14-39
300 19 11-32
Note.-Maximum image contrast in brain is achieved at the ··optimum TE.'' Any TE within the "range of TE" will achieve ~90% of the maximum
image contrast. Note that TE at 26 to 32 msec is within the 90% range
for all calcium concentrations, and also note that lesser calcium
concen-trations, require longer TEs to achieve the very best image contrast.
AJNR: 15, March 1994
gradient-echo methods tested, those with flip angles smaller than the calculated optimum and at TEs shorter than the optimum made the smaller lesions least evident. Examination of the
images at longer than optimal TEs with which
the smallest lesions were most apparent is
partic-ularly interesting (Figs 5£ and 5F). We presume
that the slight improvement in image contrast for
the smallest lesions at larger TEs indicates that
these have the lowest calcium concentration
(Table 2). At a TE of 66 msec, susceptibility
artifact at the brain-skull interface is so great that the peripheral part of the brain is degraded below diagnostically acceptable levels, and the lesions show susceptibility artifacts (14).
Discussion
Particulate material that is either diamagnetic or paramagnetic leads to susceptibility dephasing
and shortening of T2*. Gradient-echo imaging
does not use a refocusing radio frequency pulse and is therefore the best method of detecting this T2* effect. The voxel containing the particulate material and, potentially, the neighboring voxels
display loss of signal intensity. In clinical MR,
knowledge of this effect may be used to advan
-tage to visualize subtle calcification that may
otherwise escape detection ( 1 ). Intuitively it
stands to reason that the greater the degree of
hypointensity of the area in question relative to the normal surrounding tissue (the image
con-trast), the more easily the lesion will be detected.
Gradient-echo imaging has three important op-erator-selected variables that control image
con-trast: TE, flip angle, and TR. For calcium, the
manner in which signal intensity and image con-trast vary with these parameters is not intuitively obvious.We investigated systematically the de-pendence of signal intensity and image contrast
on each of these variables, both experimentally
and theoretically. The excellent agreement be-tween calculation and measurements in the phan-tom allowed us to predict theoretically a spectrum
of optimal gradient-echo imaging sequences for
detecting calcium in the brain.
The resulting recommended pulse sequences
can be understood qualitatively. Susceptibility dephasing leads to T2* shortening and a loss of
signal in and around calcified lesions. Increasing
TE beyond an optimum leaves the lesion black
[image:6.612.54.297.85.276.2] [image:6.612.54.293.346.531.2] [image:6.612.53.296.623.696.2]AJNR: 15, March 1994 MR OF CALCIUM 471
A B
c
D
E FFig. 5. Cysticercosis with multiple intracerebral calcifications. TR, TE, and flip angle vary between each image. Multiple hypointense lesions are evident on all images representing dystrophic calcification secondary to the cysticercal infection.
A-C, TR and TE are kept constant (TR at 120 msec, TE at 22 msec) and flip angle is varied from 10° (A), to 33° (B), to 70° (C).
Five hypointense lesions are clearly visible on each image. The average contrast (background tissue signal minus lesion signal) is best
appreciated in 8 both qualitatively and quantitatively. The basic type of image contrast of the brain does change markedly; A is proton
density-weighted, 8 has flat contrast, Cis mostly T1-weighted except for cerebrospinal fluid, which has high signal because of steady-state effects. D-F, TR and flip angle are kept constant (TR at 120 msec, flip angle at 33°) and TE is varied from 22 (D) to 44 (E) to 66
msec (F). Five lesions are very evident on every image, a sixth becomes convincing with the longest TE (arrow) (F). For each lesion
contrast is quantitatively better on E and F than on D. Also, the apparent size of the lesion appears to grow as TE gets longer. By TE at 66 msec, (F) some artifactual substructure is appearing within the lesions (14) and susceptibility-induced signal loss at the brain-skull interface degrades the quality of this image to the point where it is diagnostically unacceptable. D would be the best compromise
between lesion visibility and acceptable signal loss of the skull interface. We speculate that the greater image contrast seen with the TE of 44 msec (E) is caused by the calcium present within the lesions was less than 1 00 mg/ ml. Although this cannot be proved in a clinical case, it is consistent with the calculations shown in Table 2.
the images diagnostically useless. Thus, we
rec-ommend 29 msec as an optimum TE for gradient
imaging with a slightly longer value for concen-trations less than 1 00 mg/ mL.
The recommended flip angle is related to the
TR value. For spoiled GRASS or FLASH imaging
at a given TR, there is an optimum flip angle
that maximizes the MR signal (15, 16) given by the Ernst angle: flip angleoptimum
=
arc cos[exp(-TR/T 1 )]. The recommended flip angle as
a function of TR shown in Fig 4 is basically a
[image:7.617.55.560.74.490.2]472 HENKELMAN
gradient-echo sequence have been shown to have insignificant effect because the susceptibility de-phasing effectively spoils the transverse magnet-ization. Thus, the decision of whether to use GRASS or SPGR and the specific selection of TR can be determined by the desired appearance and coverage of the normal brain.
In summary, a gradient-echo sequence can be designed to optimize the image contrast of calci-fied tissue. The sequence can be spoiled or un-spoiled, and should have a TE of 29 msec or longer and a flip angle related to the choice of TR as dictated in Fig 4.
Acknowledgments
Financial support from the National Cancer Institute of Canada, General Electric Medical Systems of Canada, and Berlex Canada is gratefully acknowledged. John Watts assisted with the phantom preparation and imaging exper-iments; Dr Peter Stanchev completed the numerical cal-culations and data fitting.
This work was supported by the National Cancer Insti-tute of Canada and General Electric Medical Systems of Canada. Walter Kucharczyk is supported by a Career In-vestigator Award from Berlex Canada Inc.
References
I. Atlas SW, Grossman Rl, Hackney DB, et al. Calcified intracranial
lesions: Detection with gradient-echo-acquisition rapid MR imaging.
AJNR Am J Neuroradiol1988;9:253-261
AJNR: 15, March 1994
2. Nixon JR, Houser OW, Gomez MR, Okazaki H. Cerebral tuberous sclerosis: MR imaging. Radiology 1989; 170:869-875
3. Lang C, Huk W, Piehl J. Comparison of extensive brain calcification
in postoperative hypoparathyroidism on CT and NMR scan.
Neuro-radiol 1989;31 :29-36
4. Dell LA, Brown MS, Orrison WW, et al. Physiologic intracranial calcification with hyperintensity on MR imaging: case report and experimental model. AJNR Am J Neuroradiol1988;9:1145-1150
5. Holland BA, Kucharczyk W, Brant-Zawadzki M, Norman D, Haas DK,
Harper PS. MR imaging of calcified intracranial lesions. Radiology
1985; 157:353-357
6. Henkelman RM, Watts J, Kucharczyk W. High signal intensity in MR images of calcified brain tissue. Radiology 1991;179:199-206 7. Henkelman RM. Measurements of signal intensities in the presence
of noise in MR images. Med Phys 1985; 12:232-233
8. Poon CS, Henkelman RM. Practical T2 imaging for clinical appl
ica-tions. J Magn Reson Imaging 1992;2:541-553
9. Haase A, Frahm J, Matthaei D, Hanicke W, Merboldt KD. FLASH imaging: rapid NMR imaging using low flip angle pulses. J Magn
Reson 1986;67:258-266
10. Crawley AP, Wood ML, Henkelman RM. Elimination of transverse coherences in FLASH MRI. Magn Reson />'led 1988;8:248-260 11. van der Meulen P, Groen JP, Tinus AMC, Bruntink G. Fast field echo
imaging: an overview and contrast calculations. Magn Reson Imaging 1988;6:355-367
12. Zur Y, Stokar S, Bendel P. An analysis of fast imaging sequences with steady-state transverse magnetization refocusing. Magn Reson
/>'led 1988;6: 175-193
13. Henkelman RM, Hardy P, Poon PY, Bronskill MJ. An optimal MRI sequence for imaging hepatic metastases. Radiology 1986; 161:
727-734
14. Kim JK, Kucharczyk W, Henkelman RM. Dipolar susceptibility
arti-facts from cavernous hemangiomas. Radiology 1993;187:735-741
15. Bendel P. T ,-weighted contrast in rapid low flip-angle imaging. Magn
Reson />'led 1987;5:366-370
16. Ernst RR, Anderson WA. Fourier transform NMR spectroscopy. Rev