David L. Daniels' Leo F. Czervionke' Jean F. Bonneville2 F. Cattin2 Leighton P. Mark' Peter Pech3 Lloyd E. Hendrix' David F. Smith' Victor M. Haughton' Alan L. Vlfilliams'
This article appears in the September/Octo-ber 1988 issue of AJNR and the NovemSeptember/Octo-ber 1988 issue of AJR.
Received August 24, 1987; accepted after revi-sion January 10, 1988.
This work was supported in part by a grant from Berlex Laboratories, Cedar Knolls, NJ, and by Na-tiona I Institute of Health Grant No.1 R01 AR33667-01A2.
1 Department of Radiology, Medical College of Wisconsin, Froedtert Memorial Lutheran Hospital, 9200 W. Wisconsin Ave., Milwaukee, WI 53226. Address reprint requests to D. L. Daniels.
2 Department of Neuroradiology, University Hos-pital of Besancon, 2, Place Saint Jacques, F-25030 Besancon, France.
3 Department of Radiology, Uppsala University Hospital, S-751 85 Uppsala, Sweden.
AJNR 9:947-952, September/October 1988 0195-6108/88/0905-0947
© American Society of Neuroradiology
MR Imaging of the Cavernous
Sinus:
Value of Spin Echo and Gradient
Recalled Echo Images
947
A detailed evaluation of the MR appearance of the pituitary gland-cavernous sinus junction has not been described. In a series of coronal T1-weighted spin echo images without and with IV gadolinium, we noted the variable size and signal intensity of cavernous venous spaces adjacent to the pituitary gland and the inconsistent visuali-zation of the dural membrane just lateral to the gland.
Correlation of coronal T1-weighted spin echo and gradient recalled echo images (the laHer with high-signal-intensity vascular structures) proved to be an effective means of identifying cavernous venous spaces, connective tissue and cranial nerves, and the lateral margins of the pituitary gland, and of differentiating tumor tissue from cavernous venous spaces. Further work is needed to develop criteria to distinguish cavernous sinus compression from actual tumor invasion.
Certain features of the MR appearance of the normal and abnormal cavernous
sinus have been described [1, 2]. Masses in the cavernous sinus can be detected
reliably if they enlarge the sinus, displace or distort the cavernous internal carotid
artery, or obliterate Meckel's cave [1]. However, subtle extension of a sellar tumor
to the sinus may be difficult to detect because of the similar signal intensity of
tumor and cavernous tissues. To establish a basis by which to detect tumor
extension, we set out to determine the MR appearance of the normal pituitary
gland-cavernous sinus junction. We further speculated that gradient recalled echo
(GRE) images showing high-signal-intensity vascular structures (e.g., cavernous
venous spaces) should prove useful for identifying tumors invading the cavernous sinus.
Materials and Methods
Photographs obtained from a prior study of coronal cryomicrotomic sections of the sella and parasellar regions of four fresh frozen cadaver heads were evaluated [1 , 3]. The cavernous venous spaces and connective tissue and the dural membrane at the pituitary gland -cavernous sinus junction were identified by using published anatomic, CT, and MR studies [2,4-8].
Coronal T1-weighted spin echo (SE) images of the sella in 25 patients who had MR studies for temporal bone evaluation, and in nine patients who had studies without and with IV gadolinium for nonsellar cranial disease were evaluated. The technique for gadolinium administration has been described [9]. In addition, coronal T1-weighted SE and GRE images of the sella in five normal volunteers and in three patients with surgically verified tumors (two with parasellar meningiomas, one with a pituitary adenoma) were obtained. One of the patients with a meningioma also had MR with IV gadolinium.
The volunteers and patients were studied with a 1.5-T GE Signa system. Initially, a quick sagittal T1-weighted image was used for localization. Then coronal images were obtained perpendicular to the orbitomeatal line.
948
DANIELS ET AL. AJNR:9, September/October 1988flip angle of 90°, 20-cm field of view, flow compensation, and 3-mm-thick slices.
The MR images of the volunteers and patients were correlated with the cryomicrotomic sections to identify cavernous venous
spaces and the dural membranes at the lateral margins of the pituitary gland. The sigQal intensity of these structures relative to that of the pituitary gland or cerebral tissue was determined, as was their frequency in MR images.
Results and Discussion
The dural and venous structures of the cavernous sinus and foraminal vascularity have been described [4, 5, 10].
Separating the cavernous sinus from the pituitary fossa is a vertical dural membrane that is contiguous with the dia-phragma sellae and the superior dural and inferior periosteal walls of the cavernous sinus [5].
The appearance of the cavernous venous spaces has been
expertly determined in a series of dynamic CT studies [4]. The venous spaces include (a) a constant large space
infer-olateral to the horizontal portion of the cavernous carotid artery, (b) a space often asymmetric and inconsistently seen just medial to the artery, and (c) a space between the artery and the sphenoid bone (i.e., vein of the carotid sulcus) that is seen when the artery does not contact the sphenoid bone.
Cranial nerves have a constant relationship to the carotid artery and inferolateral venous space, with cranial nerves III and IV located superolateral to the artery and cranial nerves V1 and VI superolateral to and cranial nerve V2 inferior to this space [1, 6].
Foramen ovale vascularity is variable [10]. In addition to cranial nerve V3, the foramen ovale contains an emissary
sinus at its anteromedial aspect that connects the cavernous
sinus and pterygoid plexus, an accessory meningeal branch
A
B
of the internal maxillary artery sometimes present at the foramen's anterolateral aspect, and a middle meningeal vein rarely present posteriorly.
In coronal cryomicrotomic sections, the dural membrane between the pituitary gland and cavernous sinus appeared thin and gently curving (Fig. 1). In one specimen, cavernous connective tissue was noted lateral to the membrane (Fig. 1).
The cavernous venous spaces had a variable appearance from side to side and from specimen to specimen, which in
part may have been due to postmortem changes (Fig. 1). In all specimens, venous spaces inferolateral to the cavernous internal carotid artery were present, but in one specimen,
asymmetry of these spaces and connective tissue adjacent to cranial nerves V1 and VI were seen (Fig. 1).
Fig. 1,-Pituitary gland (P)-cavernous sinus junction in a coronal ana-tomic section. A dural membrane (curved arrows) is shown just lateral to p, Note asymmetric venous spaces just medial (1) and inferolateral (3) to cavernous carotid artery (A) and between artery and sphenoid bone (2), Cranial nerves III and IV superolateral to A and cranial nerves Vl and VI inferolateral to A are shown. At lower part of cavernous sinus, cranial nerve V2 is identified below large venous space (3). Note connective tissue (wide arrows) at medial aspect of cavernous sinus and associated with cranial nerves Vl and VI.
c
[image:2.615.317.561.270.388.2] [image:2.615.56.559.503.689.2]AJNR:9, September/October 1988 MR OF THE CAVERNOUS SINUS
949
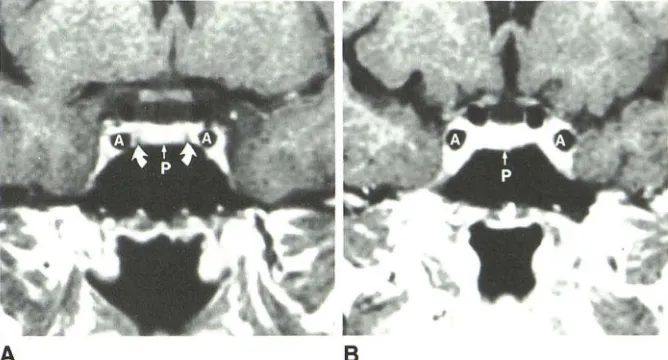
Fig. 3.-A and B, Two examples of enhancing pituitary glands and cavernous sinuses in coro-nal T1-weighted spin echo images after IV gad-olinium administration. Dural membranes defin-ing pituitary gland (P)-cavernous sinus junction are shown as dark bands (curved arrows) in A but are not visualized in B. (A
=
cavernous ca-rotid artery.)A
A review of coronal T1-weighted SE images in 25 patients without sellar disease showed variability in the signal intensity and amount of tissue between the pituitary gland and the cavernous carotid artery, and, inferomedial to the artery, in the same patient and from patient to patient (Fig. 2). The tissue was bilaterally slightly less intense (in four patients) or more intense (in five patients) than the pituitary gland, not
identifiable (in nine patients), or asymmetric in appearance
from side to side (in seven patients). Such tissue was sub-sequently proved to be cavernous venous spaces by using GRE images (see below). A thin dark band that correlated with the dural membrane between pituitary gland and cavern-ous sinus was only seen bilaterally in five patients and unilat-erally in three patients (Fig. 2). The band was usually seen when tissue lateral to it was more intense than the pituitary
gland.
A review of gadolinium-enhanced MR images in nine
pa-tients without sellar disease showed enhancement of venous
spaces that was virtually the same as (four patients) or more
intense than (five patients) the pituitary gland (Fig. 3). The
dark band corresponding to the dural membrane lateral to the
gland was only shown bilaterally in two patients and
unilat-erally in two patients (Fig. 3).
Correlation of T1-weighted SE and GRE images showed that in the latter, cavernous venous spaces and carotid arter-ies had high signal intensity while cavernous neural and connective tissue did not (Fig. 4). The variable signal intensity
of cavernous venous spaces (i.e., greater or less than that of the pituitary gland) in SE images is attributable to different
venous flow rates. Venous spaces inferolateral to the carotid
arteries were consistently seen, but these spaces and those
medial and inferomedial to the arteries varied in size from side to side. In GRE images, cavernous tissue isointense with cerebral gray matter correlated with cranial nerves III and IV together superolateral to the carotid artery, with cranial nerves
V1 and VI together inferolateral to the carotid artery, and with cranial nerve V2 just below the inferolateral venous space (Fig. 4). Small amounts of connective tissue adjacent to the
B
nerves probably were present in some cases. In SE images, most cavernous venous spaces and cranial nerves were isointense and could not be differentiated.
Fat in the dorsum sellae and connective tissue adjacent to the pituitary gland, hyperintense and hypointense with respect to the pituitary gland in SE images, were isointense with gray matter in GRE images (Fig. 4). In the GRE images, the middle meningeal arteries in and above the foramen spinosum, and blood vessels in the foramen ovale were seen (the latter in only two VOlunteers).
Correlation of T1-weighted SE and GRE images helped differentiate tumor from cavernous venous spaces, the latter having high signal intensity in the GRE images. In two pa-tients, cavernous meningiomas deformed the ipsilateral ca-rotid arteries but one did not have high signal intensity, probably because of abnormal flow (Fig. 5). In one patient a pituitary macroadenoma extended laterally to the carotid ar-tery but did not obliterate a venous space below the arar-tery (Fig. 6).
In conclusion, the appearance of the cavernous sinus-pituitary gland margin shows considerable variability in T1-weighted SE images without and with gadolinium DTPA. The dural membrane demarcating the lateral extent of the pituitary gland is not conSistently shown. Correlating T1-weighted SE and GRE images proves to be a reliable technique for dem
-onstrating the lateral margins of the pituitary gland and the cavernous venous spaces. Only with GRE images can these spaces be differentiated from cavernous cranial nerves and connective tissue. Dynamic CT can be used to identify cav-ernous venous spaces, but evaluation of multiple levels would require several IV bolus injections of contrast agent and radiation exposure. GRE images can be used to distinguish sellar and parasellar tumor from cavernous venous spaces.
[image:3.614.224.558.88.268.2]950
B
E
F
A
B
DANIELS ET AL. AJNR:9, September/October 1988
c
G
Fig. S.-A and B, Parasellar meningioma
(large arrows) in coronal T1-weighted spin echo (A) and gradient recalled echo (B) images. The tumor is less intense than and nearly isotense
with pituitary gland (P) in A and B, respectively.
In B, the encased carotid artery (small arrows)
has negligible signal attributable to abnormal
blood flow. However, the proximal ipsilateral and
contralateral carotid arteries (A) have high signal
[image:4.612.56.560.93.487.2]AJNR:9, September/October 1988
o
H
Fig. S.-A and 8, Pituitary adenoma (long
arrow) in coronal T1-weighted spin echo (A) and
gradient recalled echo (8) images. The tumor
extends laterally (short arrow) but does not de-form cavernous internal carotid artery (A) or ob-literate the high-intensity venous space (curved
arrow, 8).
MR OF THE CAVERNOUS SINUS 951
Fig. 4.-A-H, Progressively more anterior coronal T1-weighted spin echo images (A, C, E, G) and respectively corresponding gradient recalled echo images (8, D, F, H) of sellar area. In the most posterior gradient recalled echo image (8), vertical portions of cavernous internal carotid arteries (A), a vein in the basilar plexus (arrow), and the middle meningeal artery (MM) in the foramen spinosum have high signal intensity. In A, these arteries have negligible signal and the vein in the basilar plexus (arrow) could be mistaken for high-intensity fat. (M = Meckel's cave.) In more anterior sections (C and D) demonstrated in the foramen ova Ie are cranial nerve V3 and a high-intensity lateral blood vessel (wide arrow) in C and D, respectively. The signal intensity of fatty marrow (F) is high in C and low in D. In slightly more anterior sections (E and F), the horizontal portions of cavernous internal carotid arteries (A) are demonstrated. Noted in the foramen ovale are cranial nerve V3 in E
and a high-intensity medial blood vessel probably representing an emissary sinus (wide arrow) in F. In the most anterior sections (G and H), cavernous sinus contents are better shown in H than in G.
In H, high-intensity cavernous venous spaces (arrows) and carotid arteries marginate the pituitary gland (P) and cranial nerves III and IV superolateral to the arteries and cranial nerves V1 and VI inferolateral to the arteries. Some connective tissue may be adjacent to these cranial nerves. Cranial nerves V1 and VI are shown just above a prominent venous space.
[image:5.612.56.225.88.450.2] [image:5.612.227.560.543.725.2]952 DANIELS ET AL. AJNR:9, September/October 1988
REFERENCES
1. Daniels DL, Pech P, Mark L, Pojunas K, Williams AL, Haughton VM.
Magnetic resonance imaging of the cavernous sinus. AJNR 1985;6:
187-192
2. Daniels DL, Pech P, Pojunas KW, et al. Magnetic resonance imaging of the trigeminal nerve. Radiology 1986;159:577-583
3. Rauschning W, Bergstrom K, Pech P. Correlative craniospinal anatomy studies by computed tomography and cryomicrotomy. J Comput Assist Tomogr 1983;7:9-13
4. Bonneville JF, Cattin F, Albisetti J, Bouchareb M. The veins of the cavern-ous sinus: usefulness of their demonstration for the diagnosis of invasive
pituitary adenomas. Presented at the annual meeting of the American Society of Neuroradiology, New York, May 1987
5. Bonneville JF, Dietemann JL. Radiology of the sella turcica. New York: Springer-Verlag, 1981:17, 18
6. Bonneville JF, Cattin F, Dietemann JL. Computed tomography of the pituitary gland. New York: Springer-Verlag, 1986:14, 15
7. Umansky F, Nathan H. The lateral wall of the cavernous sinus. J Neurosurg
1982;56: 228-234
8. Harris FS, Rhoton AL. Anatomy of the cavernous sinus, a microsurgical
study. J Neurosurg 1976;45:169-180
9. Kilgore DP, Breger RK, Daniels DL, et al. Normal MR appearance of cranial
tissues after intravenous gadolinium DTPA injection. Radiology 1986;160:757-761
10. Sondheimer FK. Basal foramina and canals. In: Newton TH, Potts DG,