Barry H. Katz 1 Robert M. Quencer1 R. Scott Hinks2
Received July 8, 1988; revision requested Au-qust 24, 1988; revision received November 11,
1988; accepted December 13, 1988. 1
Department of Radiology, University of Miami School of Medicine{Jackson Memorial Medical Cen-ter, Miami, FL 33101. Address reprint requests to 11. M. Quencer, University of Miami M.R.I. Center, 1115 N.W. 14th St. (R-308), Miami, FL 33136.
' Picker International Clinical Science Research Center, Highland Heights, OH 44132.
AJNR 10:815-822, July/August 1989 0195-6108{89/1004-0815
o American Society of Neuroradiology
Comparison of
Gradient-Recalled-Echo and T2-Weighted Spin-Gradient-Recalled-Echo
Pulse Sequences in Intramedullary
Spinal Lesions
Nineteen consecutive patients with spinal intramedullary lesions were studied on a 1.5-T system to compare the quality of T2-weighted spin-echo and gradient-recalled-echo (GRE) pulse sequences. Direct comparisons were made in the sagittal and/or axial planes. Twenty-four studies were performed in the 19 patients. The gradient echoes were usually performed at 300/14 (TR/TE) with a flip angle of 10°. Although no significant diagnostic differences were noted in the sagittal plane, there was a distinct anatomic advantage for GRE imaging over spin-echo imaging in the axial plane. This is believed to be the result of CSF time-of-flight effects in the slice-select direction, which are not compensated for by flow-compensating gradients on the spin-echo images, but which are insignificant in the GRE sequence used in this study. Pathology was seen equally well or better on GRE in 79% (19/24) of the sequences. In the other five cases, the spin-echo image showed a brighter intramedullary signal than that seen on GRE, although GRE showed the lesion in all cases.
Our results indicate that properly optimized GRE imaging on a high-field-strength system can replace spin-echo imaging in the spine when intramedullary disease is suspected and that the benefits of GRE are most striking in the axial plane.
MR imaging has become a widely accepted technique in the evaluation of diseases affecting the spine and spinal cord. For the evaluation of intramedullary lesions, T2-weighted spin-echo (SE) images have been widely used; however, the long scanning time required for SE has several disadvantages, including the potential for increased patient motion and CSF motion artifacts. Recently, gradient-recalled echoes (GREs) have been used as a fast scanning technique to decrease scanning time while achieving a T2 "myelogram" effect [1-6]. Its primary application in the spine has been in the evaluation of extradural disease [6-8]. Our prospective study was carried out to investigate the efficacy of GRE in evaluating intramedullary lesions by directly comparing GRE and SE findings in both the axial and sagittal planes.
Subjects and Methods
We evaluated prospectively the MR scans of 19 consecutive patients with intramedullary spinal cord lesions by a qualitative comparison of the T2-weighted SE and GRE images. All comparisons were made in the same projection (i.e., axial and/or sagittal planes). The scans were obtained with a 1.5-T superconducting magnet* with surface-coil imaging, and all sequences were performed during the same examination period. The patient group comprised 10 men and nine women 11-75 years old (mean, 45.1 years).
The GRE sequences, 250-300/14 (TR/TE), used a TR of 300 msec in 19 of 24 sequences. The flip angle averaged 9.6°; 21 of 24 sequences used a flip angle of 10.0° ± 0.5°. The gradient echoes were done with 5- to 6-mm contiguous slices, no interslice gap, four repetitions, and a 192 x 256 acquisition matrix. All scans were obtained with a multislice technique acquiring eight slices per sequence. The average scan time for GRE sequences was 3.8 min. SE sequences, 2000-2500/80-100/2 (TR range/TE range/excitations), were
done with the motion-artifact suppression technique (MAST) [9, 1
OJ
.
Five- to six-millimeter contiguous slices and a 192 x 256 acquisition matrix were used.
Only pulse sequences that had both an SE and a GRE image in the same plane were included in this study. The evaluation and
comparison of the GRE and SE images were based on both
deline-ation of normal anatomic structures in the sac and cord as well as
appreciation of character and extent of disease. In this comparative study, equality or superiority of image quality was recorded. The distribution of studies in terms of spinal level was cervical, 11; thoracic, seven; and lumbar, one. Of the 19 patients studied, GRE
and SE were compared in a single plane in 14 and in two planes in
five.
Results
The spinal level, axis of examination, and diagnosis in each patient are outlined in Table 1. Comparison of thecal sac and cord anatomy is shown in Table 2. There was a striking disparity in favor of GRE in terms of visualizing normal anat-omy in the axial plane. In seven of eight (88%) patients, axial GRE was superior to axial SE (Figs. 1-4). The studies were
TABLE 1: Gradient-Recalled-Echo and T2-Weighted Spin-Echo Imaging of Intramedullary Spinal Lesions: Summary of Patients and Scanning Locations and Projections
Study Level/ Imaging Plane Diagnosis Case No.
Cervical
1 Sagittal Spondylosis with gliosis/edema
2 Sagittal Spondylosis with cord gliosis/
edema
3 Axial Neurofibromatosis with glioma
4 Axial Multiple sclerosis plaques
5 Sagittal and axial Multiple sclerosis plaques
6 Sagittal Multiple sclerosis plaques
7 Axial Infarct vs multiple sclerosis
8 Sagittal Intramedullary cysts or myelo-malacia secondary to trauma 9 Sagittal and axial Myelomalacia vs intramedullary
cyst secondary to trauma
10 Sagittal Traumatic intramedullary cyst
11 Sagittal and axial Myelitis in AIDS patient
Thoracic
12 Sagittal and axial Neurofibromatosis with hamar-tomajglioma
13 Sagittal Fracture/dislocation with non -pulsatile intramedullary cyst 14 Sagittal Intramedullary cyst secondary
to trauma
15 Sagittal and axial Intramedullary lung metastasis with syringohydromyelia
16 Sagittal Intramedullary hemorrhage
secondary to occult arterio-venous malformation
17 Sagittal Hemorrhagic cord
lesion-arte-riovenous malformation vs hemangioblastoma
18 Sagittal Cord edemajgliosis secondary
to compression from
extra-dural metastases
Lumbar
19 Sagittal Diastematomyelia with
hydro-myelia in tethered cord
judged to be equal in one. In the seven cases in which GRE was superior, there was a sharp, well-defined interface be-tween the intramedullary lesion and normal cord and bebe-tween the cord and CSF. Five of these seven patients were imaged in the cervical spine; the other studies were thoracic. On SE images, the lesionjcord and cord/CSF interfaces were indis-tinct. In the sagittal sequences, only one (6.3%) of 16 cases had a better SE study in terms of quality of anatomy. In 69% (11 /16), SE and GRE were believed to be equivalent (Figs. 3C and 3D), while GRE was superior in 25% (4/16). Thus, anatomically, GRE was at least equal to SE of the spine in the sagittal plane (Figs. 3C, 3D, and 5-7).
Concerning definition of pathology, 50% (12/24) of the total sequences showed no difference in ease of visualization of spinal cord disease. GRE was superior in 29% (7 /24), while SE was better in 21% (5/24). However, in all cases in which the lesion was better visualized on SE, it was also seen on the GRE sequences. The lesion simply was "brighter" on SE in these instances. In addition, in a patient with recurrent intramedullary hemorrhage (Fig. 7, case 16), the gradient echo was sensitive in depicting hemorrhage secondary to the high magnetic susceptibility of blood. The T2 shortening effects of hemosiderin were seen equally well on the SE image.
Discussion
T2-weighted SE imaging has become the method of choice in the evaluation of intramedullary spinal cord lesions. The excellent sensitivity of this pulse sequence has allowed spinal
intramedullary lesions to be diagnosed even in the face of a normal-sized cord. However, several problems are evident
with this technique as a result of the long imaging times required (typically 1 0-15 min) and the phase errors and artifacts [11-14) that are present on long TRjlong TE pulse sequences. GRE pulse sequences can generate "T2-Iike" images without the CSF flow-induced artifacts in relatively short periods of time. Because such sequences have been shown to be useful in the detection of disk disease in the cervical and lumbar spine [6-8], we sought to determine
whether GRE studies were equally helpful in spinal cord disease and whether such an examination could replace SE imaging. Evaluation of spinal cord disease using the GRE parameters described in this article at high field strengths has
not been previously reported.
Enzmann and Rubin [15) concluded that a short TR GRE (gradient-recalled acquisition in the steady state, GRASS)
TABLE 2: Comparison of Gradient-Recalled-Echo (GRE) and Spin-Echo (SE) Imaging of Spinal Cord and Thecal Sac Anatomy
No. of Studies
Study Rating Sagittal Axial
Plane Plane
GRE superior to SE 4 7 SE superior to GRE 1 0
GRE and SE equal 11 1
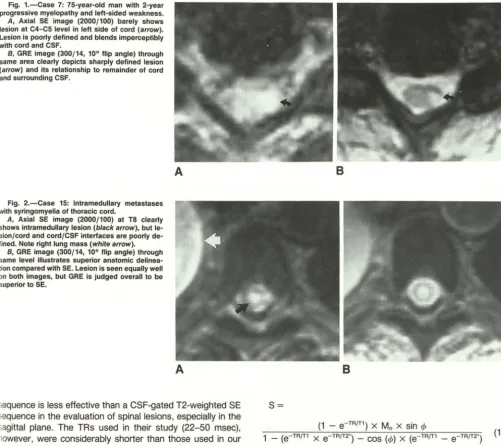
[image:2.613.55.297.370.728.2]Fig. 1.-Case 7: 75-year-old man with 2-year progressive myelopathy and left-sided weakness.
A, Axial SE image (2000/100) barely shows
lesion at C4-C5 level in left side of cord (arrow). Lesion is poorly defined and blends imperceptibly with cord and CSF.
B, GRE image (300/14, 10° flip angle) through
same area clearly depicts sharply defined lesion (arrow) and its relationship to remainder of cord
and surrounding CSF.
Fig. 2.-Case 15: Intramedullary metastases
with syringomyelia of thoracic cord.
A, Axial SE image (2000/100) at TS clearly shows intramedullary lesion (black arrow), but
le-sion/cord and cord/CSF interfaces are poorly
de-fined. Note right lung mass (white arrow).
8, GRE image (300/14, 10° flip angle) through
same level illustrates superior anatomic
delinea-tion compared with SE. Lesion is seen equally well
on both images, but GRE is judged overall to be
superior to SE.
A
A
sequence is less effective than a CSF-gated T2-weighted SE sequence in the evaluation of spinal lesions, especially in the sagittal plane. The TRs used in their study (22-50 msec), however, were considerably shorter than those used in our series (300 msec). The use of the longer TR in our study
results in ill]proved signal-to-noise and reduced artifacts as described below.
The classical GRE pulse sequence (also known as GRASS, f1eld-echo, gradient-echo, or limited flip-angle imaging) is a short TRJTE sequence with a partial flip angle. Optimization of contrast resolution, spatial resolution, and signal-to-noise ratio (SNR) in this technique is critical for lesion detection. The magnitude of the flip angle chosen appears to be the most important parameter in terms of producing proper image contrast (2, 3, 6, 7, 15, 16]. Although the reduced flip angle
is most responsible for the relatively low SNR in GRE (less
transverse magnetization produces less signal), a flip angle of 1 oa or less is best to achieve a T2-like effect with excellent contrast (6, 7, 15]. This is primarily because the reduced flip angle reduces or eliminates the T1 weighting, which normally
competes with T2 weighting and decreases contrast. The signal in GRE imaging is based on the following
equa-tion:
8
8
S=
(1 - e-TRfT1) x Mo x sin rJ>
(1) 1 _ (e TR{f1 X e TRfT2") _ COS (rj>) X (e TR{f1 _ e TR{f2")
where Ma is the proton density and rJ> is the flip angle (1, 4, 6]. This simplifies to:
S = Ma X sin rJ>
x
(1 - e-TRfT1)x
e-TEfT2.1 - COS rjJ X e TR{f1 (2)
when TR
»
T2*, as it is in our sequence since e-TErr2· approaches zero. By decreasing the flip angle toward zero (i.e., 1 0°), cos rJ> approaches one and the equation reduces to:Ma X sin rJ>
x
(1 - e-TRfT1)x
e-TEfT2"S = (1 - e TRfT1) (3)
The terms (1 - e-TRfT1) cancel and we are left with:
[image:3.618.57.558.84.530.2]A
8
c
D
As seen in equation 4, the signal strength and contrast are
dependent on proton density (larger Mo yields brighter signal)
and T2* (longer T2* yields brighter signal). At the short TE used in this study (14 msec), the signal is primarily determined
by proton density with a lesser contribution from T2*. T2* is
a time constant that describes a signal decay from several sources including T2, static field inhomogeneity, chemical shift, and magnetic susceptibility. In routine T2-weighted SE
imaging, the terms other than T2 cancel owing to the
refo-cusing effect of the 180° RF pulse.
The differences between short TR and long TR GRE se
-quences can be explained as follows. The use of a short TR
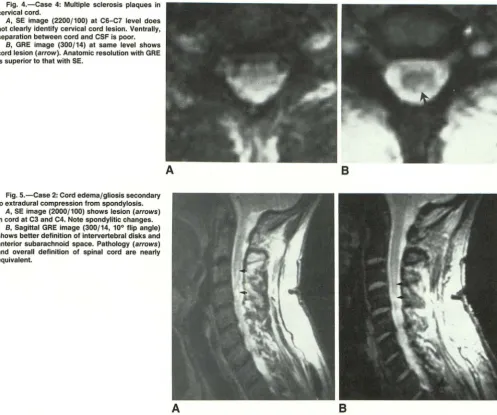
Fig. 3.-Case 12: 11-year-old patient with neu
-rofibromatosis and presumed hamartoma/glioma in distal cord.
A, SE image (2100/80) at T12 shows high signal within canal, but it is not certain whether abnor-mality (arrows) lies within cord. CSFjcord interface is not identified.
8, GRE image (300/14, 10° flip angle) at same level shows anatomy and intrinsic cord lesion well (arrow).
C and D, SE (C) and GRE (D) sagittal images
through distal cord and conus show increased intrinsic cord signal (arrows) without evidence of
abnormal cord enlargement. These two images are essentially identical in quality.
leads to the buildup of a "steady state" of transverse ma
g-netization. This occurs when the sequence is repeated so
rapidly that the signal does not fully decay from one excitation
to the next and is refocused by successive RF pulses. This
effect is seen in the dependence of the signal on e-TRfT2
', as
shown in equation 1 above. The pulsatile flow of CSF alters
this steady state in two ways. First, phase errors caused by
flow effects alter the steady-state signal when unsaturated
protons enter a given slice and the fully magnetized protons
exit the slice. Both effects result in flow artifacts in the phase
[image:4.617.60.563.81.583.2]y-Fig. 4.-Case 4: Multiple sclerosis plaques in cervical cord.
A, SE image (2200/100) at C6-C7 level does
not clearly identify cervical cord lesion. Ventrally, separation between cord and CSF is poor.
8, GRE image (300/14) at same level shows cord lesion (arrow). Anatomic resolution with GRE is superior to that with SE.
Fig. 5.-Case 2: Cord edema/gliosis secondary to extradural compression from spondylosis.
A, SE image (2000/100) shows lesion (arrows)
in cord at C3 and C4. Note spondylitic changes.
B, Sagittal GRE image (300/14, 10° flip angle) shows better definition of intervertebral disks and anterior subarachnoid space. Pathology (arrows) and overall definition of spinal cord are nearly equivalent.
A
A
state transverse magnetization is effectively eliminated. Phase errors caused by flow are minimal because the TE is so short
that only small phase shifts can accumulate. In addition,
time-of-flight effects are eliminated because the reduced flip angle
removes the T1 dependence, and there is likewise no steady-state magnetization to be disrupted by flow through the plane.
These factors result in a GRE sequence that is relatively
i sensitive to CSF flow effects and has improved image quality and lesion detectability.
The inherently low SNR usually seen with GRE was com-pensated in our study by the following four considerations.
(1) The high-field-strength magnet improves SNR in
approxi-mately a linear relationship compared with a
lower-field-strength system [17]. (2) The use of a 192
x
256 acquisitionatrix yields adequate spatial resolution with a 15% increase
in SNR compared with a 256 x 256 data matrix. Also, the use of this matrix reduces the scan time such that four
repetitions can be used with a relatively short examination
(4 min). (3) By increasing TR from 25-50 msec to 300 msec, the SNR improves, allowing better visualization of cord
B
B
[image:5.615.60.558.83.498.2]lesions. Short TR sequences (25-30 msec) are generally adequate for extradural disease but do not offer adequate signal-to-noise to effectively evaluate intramedullary disease [6, 7, 15]. (4) A short TE also improves the SNR, just as it does in routine SE sequences. Other investigators have used similar TEs in their GRE imaging [6, 7, 15, 16]. The use of a short TE minimizes the effect of T2* on image contrast. Thus, our GRE images are primarily proton-density weighted with a small contribution from T2*. We can visualize the central gray matter including the dorsal and ventral horns in the axial plane (Fig. 8). Intramedullary lesions such as tumors, cysts, or multiple sclerosis disrupt these anatomic details (Figs. 1, 2, 3A, 38, and 4) and produce patchy or well-defined, rounded lesions. Given the excellent anatomic depiction of spinal anat-omy with GRE, especially in the axial plane, a variety of spinal
cord lesions can be detected easily. In fact, in our three
patients with multiple sclerosis plaques, both the anatomy and pathology were better visualized on GRE than on SE images. Given similar SNRs, one would expect that lesions
A
B
A
B
on GRE (proton density) as a result of increased water content in these lesions. The signal intensity in proton-density imaging is related to the relative quantity of mobile protons in a particular tissue or lesion. Although the observed T2 signal
Fig. 6.-Case 19: Hydromyelia in a tethered cord in patient with postoperative diastemato-myelia.
A and B, Syringohydromyelia (arrows) in teth
-ered cord is seen equally well on both SE, 2000/
100 (A), and GRE, 300/14, 10° flip angle (B), pulse
sequences.
Fig. 7.-Case 16: Recurrent intramedullary h e-matoma in patient with presumed occult arterio
-venous malformation.
A, T1-weighted SE image (2000/100) shows
mixed signal intensity at TB level as a result of
methemoglobin and hemosiderin in both sub
-acute/chronic hemorrhages. Truncation artifact
(arrow).
B, GRE image (300/14, 10° flip angle) shows
lesion equally well. Note improved visualization of
intervertebral disks secondary to lack of chemical· shift artifact. Also, truncation artifact seen on SE
is not present on GRE image.
and measured T2 values in a lesion also correlate positively with the amount of water present, other properties of water contribute to the T2 relaxation and signal intensities observed.
[image:6.615.54.559.80.692.2]macromolecular proteins, the relative amounts of free vs
[image:7.613.58.561.492.683.2]bound water molecules, and intermolecular dipole-dipole interactions [17]. Although T2 can be measured easily [17 -19], proton density is less easily quantified. On the basis
of our observations, however, with respect to GRE and
T2-weighted SE images, we believe there is a roughly linear
relationship between signal intensities in cord lesions. Overall, pathology was seen at least as well on GRE (proton density) as on SE sequences in 79% of the sequences. In the 21% (5/24) of cases in which the lesion was better seen on T2 (as evidenced by a "brighter" signal), all of these lesions were also easily visible on GRE imaging. In these few cases,
the T2 differences between lesion and cord (image contrast) were apparently greater than the respective proton-density
differences. This difference in contrast can be overcome by
significantly improving the SNR, which consequently improves
the contrast-to-noise ratio. The contrast-to-noise ratio is the
determining factor in lesion delectability.
It became obvious early in our study that there was a
remarkable difference between the anatomic quality of the
!mages in the axial plane in favor of GRE. This was consistent
with the findings of other authors [7, 15]. To understand the
reasons for the superiority of GRE in the axial plane, it is
important to discuss the inherent problems associated with
T2-weighted SE imaging in the cervical and thoracic spine.
Nongated T2-weighted images in the cervical spine produce
considerable phase shifts and time-of-flight signal loss as a
result of CSF pulsation, blood flow in cervical vessels, and
swallowing movements. Cardiac pulsations also play a role
with CSF flow directed caudally in systole and cranially during
diastole. It has become clear that some sort of flow
compen-sation is necessary to alleviate these artifacts [11-14], and
many centers use either cardiac-gated spinal MR [11-14] or
motion-compensating gradients on T2-weighted SE images
[9, 1 0]. In the latter method, extra "lobes" or gradients are
added in both the slice-select and read directions to refocus
A
the additional phase shifts experienced by flowing material. Although this technique can reduce or eliminate phase errors, it cannot correct for time-of-flight errors caused by flow through the image plane. In axial imaging, the CSF motion is flowing in the slice-select direction (i.e., craniocaudad). Con-sequently, considerable time-of-flight effects are present in the axial plane in SE, causing degradation of the image. Our GRE sequences, on the other hand, were devoid of these time-of-flight artifacts. Time-of-flight effects can occur with the limited flip-angle technique if (1) the flip angle is large enough for T1 saturation effects to occur or (2) the TR is short enough for "steady-state" magnetization to be acquired (TR = 25-1 00 msec), then flow can disrupt this steady state. Both these mechanisms are avoided in the GRE protocol described here. A small flip angle (1 0°) is used to avoid T1 saturation and a relatively long TR (300 msec) is used to avoid a major signal contribution from transverse steady-state magnetization. In addition, the use of a short TE with a medium TR (as in our sequence, 300/14) reduces the flow-induced phase errors so that they will not contribute to motion artifacts. This results in improved diagnostic quality and ex-plains the superior lesionjcord and cordfCSF interfaces seen on the axial GRE images (Figs. 1, 2, 3A, 3B, 4, and 8). An interesting caveat to this theory is illustrated by a case of arachnoiditis seen in Figure 9 (not among our series of 19 patients) in which the axial T2 image is equivalent to the GRE image. There are two reasons for this: (1) CSF flow and its associated artifacts are less significant in the lumbar region than in the cervical and thoracic areas and (2) intradural arachnoiditis alters CSF flow dynamics, thus diminishing CSF movement and causing fewer flow-induced artifacts.
The effects of partial-volume averaging must also be con
-sidered when comparing axial and sagittal images. Because most cord lesions extend in a craniocaudad direction along gray- andjor white-matter tracts, the lesions would be seen in the axial plane even if thick sections were used. On the
B
Fig. B.-Demonstration of normal axial anatomy
of lower thoracic spine by GRE. Note excellent
definition of central gray matter including dorsal
(solid straight black arrow) and ventral (open ar·
row) gray columns. Ventral roots are well visual·
ized (curved arrow). Dorsal white matter (white
arrow) can be seen easily.
Fig. 9.-Arachnoiditis of lumbar spine at L2-L3 level.
A, Axial T2-weighted SE image, 2000/100 (A), and GRE image, 300/14, 10° flip angle (8), are
equal in quality. This is believed to result from sluggish CSF flow in lumbar spine, which is made
especially stagnant in this case of arachnoiditis. Note clumped nerve roots (arrows), which adhere
CSF, especially if thick cuts are used. For these reasons, small lesions could be missed by either technique in the
sagittal plane.
We believe that sagittal GRE is at least as good as
T2-weighted SE for both normal anatomy and disease. This was
true in 94% of sequences (14/15) (Figs. 3C, 3D, and 5-7).
The direction of CSF flow is in the frequency-encoded
direc-tion with sagittal imaging, assuming that the phase-encoded
direction is horizontal. There is no significant flow in the
slice-select direction in this situation. Thus, there are no significant
flow artifacts that cannot be removed by
motion-compensat-ing gradients. This explains why the quality of the SE images
in the sagittal plane is roughly equivalent to the quality of the
[image:8.612.318.557.191.741.2]limited flip-angle (GRE) images.
Figure 7 illustrates two additional benefits of GRE. First,
chemical shift is less apparent on GRE than on SE pulse
sequences. Chemical shift is produced by spatial
misregistra-tion at interfaces between fat- and water-containing
struc-tures due to differences in their Larmor frequencies. Because
fat is hypointense on GRE relative to soft tissues, the chemical
shift is less visually apparent than it would be on SE, where
fat is relatively hyperintense (1]. Second, truncation artifacts
may also be diminished with GRE. These are caused by
variable overshoot and undershoot oscillations at the abrupt
transitions in signal magnitude of high-contrast boundaries.
This is seen more when using 128 phase-encoding steps than
192 or 256 phase-encoding steps [20]. On GRE, the relative
contrast between cord and CSF is less than on T2, making these artifacts less apparent.
On the basis of our findings, we suggest that properly
optimized GRE imaging on high-field-strength systems can
replace T2-weighted SE images in the spine (particularly in
the cervical and thoracic areas) when a myelopathy is present
and intramedullary disease is suspected. Sagittal T1, as well
as sagittal and axial GRE, images can be obtained in
approx-imately 30 min, including setup time. This protocol may
alle-viate many of the problems associated with long imaging
times, particularly with patients who are uncomfortable or
uncooperative.
A few limitations of GRE in the spine should be addressed.
First, it may be more difficult to accurately stage hematomas
with the GRE than with the SE technique. Although the
magnetic susceptibility effects of blood play a role in staging with GRE, the proton-density effects of this technique are
also important. Second, as a result of the natural fat
suppres-sion of GRE (1], fatty structures, including tumors, may be
missed. Thus, we recommend that a sagittal T1 image
accom-pany all GRE sequences in the spine to alleviate these
poten-tial pitfalls. In addition, we have found that in patients with
extensive metallic wiring in the posterior elements of the spine
from previous surgery, visualization of the spinal cord at the
level of surgery may be inadequate. This, too, is due to
ferromagnetic effects. In these patients, conventional SE
se-quences may be helpful. Finally, there is a limitation on the
number of slices obtainable with our multisection GRE tech -nique compared with SE. The GRE sequence acquires eight slices and covers approximately one-half the area of our
routine SE sequence. Thus, it would take 7.6 min to cover
the identical area compared with SE. This still represents an
bodies is adequate for diagnostic purposes, and this is the
approximate area covered by one GRE sequence.
In conclusion, we believe that properly optimized GRE
imaging at high fields can replace SE sequences in the spine
when an intramedullary lesion is suspected. The GRE se
-quences offer better anatomic and pathologic delineation in
the axial plane, secondary to its superior contrast-to-noise
ratio, and are at least equivalent to SE in the sagittal plane.
REFERENCES
1. Wehrli FW, Drayer BP. Introduction to fast-scan magnetic resonance. BNI
0 1987;3(4):2-14
2. Mills TC, Ortendahl DA, Hylton NM, Crooks LE, Carlson JW, Kaufman L.
Partial flip angle MR imaging. Radiology 1987;162:531-539
3. Buxton RB, Edelman RR, Rosen BR, Wismer GL, Brady TJ. Contrast in
rapid MR imaging: T1 and T2 weighted imaging. J Comput Assist Tomogr
1987;11(1):7-16
4. Perkins TG, Wehrli FW. CSF signal enhancement in short TR gradient
echo images. Magn Reson Imaging 1986;4:465-467
5. Wehrli FW, Shimakawa A, Gullberg GT, MacFall JR. Time of flight MR flow
imaging: selective saturation recovery with gradient refocusing. Radiology 1986;160:781-785
6. Enzmann DR, Rubin JB. Cervical spine: MR imaging with a partial flip
angle, gradient-refocused pulse sequence. Part 1: General considerations
and disk disease. Radiology 1988;166:467-472
7. Hedberg MC, Drayer BP, Flam RA, Hodak JA, Bird CR. Gradient echo
(GRASS) MR imaging in cervical radiculopathy. AJNR 1988;9:145-151,
AJR 1988;150:683-689
8. Watanabe AT, Teitelbaum GP, Bradley WG, Whitemore AR. Comparison
of gradient echo and spin echo transaxial imaging of the lumbar spine.
Presented at the annual meeting of the American Society of Neuroradi
ol-ogy, Chicago, May 1988
9. Pattany PM, Phillips JJ, Chiu LC, et al. Motion artifact suppression tech
-nique (MAST) for MR imaging. J Comput Assist Tomogr 1987;11(3):
369-377
10. Quencer RM, Hinks RS, Pattany PH, Horen M, Post MJD. Improved MR imaging of the brain by using compensating gradients to suppress motio
n-induced artifacts. AJNR 1988;9:431-438, AJR 1988;151(1): 163-170
11. Enzmann DR, Rubin JB, Wright A. Use of cerebrospinal fluid gating to improve T2 weighted images. Part I. The spinal cord. Radiology 1987; 162:763-767
12. Rubin JB, Enzmann DR, Wright A. CSF-gated MR imaging of the spine: theory and clinical implementation. Radiology 1987;163:784-792 13. Rubin JB, Enzmann DR. Imaging of spinal CSF pulsation by 20FT MR:
significance during clinical imaging. AJNR 1987;8:297-306, AJR 1987;
148:973-982
14. Rubin JB, Enzmann DR. Harmonic modulation of proton MR precessional
phase by pulsatile motion: origin of spinal CSF flow phenomena. AJNR
1987;8:307-318, AJR 1987;148:983-994
15. Enzmann DR, Rubin JB. Cervical spine: MR imaging with a partial flip
angle, gradient-refocused pulse sequence. Part II. Spinal cord disease.
Radiology 1988;166:473-478
16. Holtas S, Stahlberg F, Cronquist S, Larsson EM. Low flip angle MR imaging
of the cervical spine. Presented at the annual meeting of the American
Society of Neuroradiology, Chicago, May 1988
17. Thomas SR, Dixon RL, eds. NMR in medicine: the instrumentation and
clinical applications. New York: American Institute of Physics, 1986:20
1-213,224-227
18. Darwin RH, Drayer BP, Riederer SJ, Wang HZ, MacFall JR. T2 estimates in healthy and diseased brain tissue: a comparison using various MR pulse
sequences. Radiology 1986;160:375-381
19. Bottomley PA, Foster TH, Argersinger RE, Pfeifer LM. A review of normal
tissue hydrogen NMR relaxation times and relaxation mechanisms from
1-100 MHz: dependence on tissue type, NMR frequency, temperature, spe-cies, excision, and age: General Electric technical information series.
Milwaukee, WI: General Electric, 1984: 1-34
20. Levy LM, DiChiro G, Brooks RA, Dwyer AJ, Wener L, Frank J. Spinal cord
artifacts from truncation errors during MR imaging. Radiology 1988;