Rosalind B
.
Dietrich
1William G. Bradley
2Edward
J
.
Zaragoza
IV
1Ronald J
.
Ottd
Ricky K. Taira
1Gabriel H. Wilson
1Hooshang Kangarloo
1This article appears in the January/February 1988 issue of AJNR and the April 1988 issue of
AJR.
Received January 21, 1987; accepted after re-vision July 13, 1987.
1 Department of Radiological Sciences, UCLA School of Medicine, Los Angeles, CA 90024. Ad-dress reprint requests to R. B. Dietrich.
2 Huntington Medical Research Institutes,
Pasa-dena, CA 91105.
AJNR 9:69-76, January/February 1988 0195-6108/88/0901-0069
© American Society of Neuroradiology
69
MR Evaluation of Early Myelination
Patterns in Normal and
Developmentally Delayed Infants
This study demonstrates the ability of MR imaging to show progression of myelination in 64 infants and young children (ages 4 days to 36 months). T2-weighted spin-echo pulse sequences, frequently used for routine screening of intracranial disease, were used. Gray-white matter differentiation was seen in all patients, and changes occurring with age were documented. Three distinct patterns were seen, and age ranges were established for each pattern in developmentally normal children: (1) infantile (birth-6 months); (2) isointense (8-12 months); and (3) early adult (10 months onward). There was a statistically significant difference between the age ranges of the normal and developmentally delayed children showing all three patterns.
These data should be helpful for identifying and following sequentially both infants with clinically suspected developmental delay and those with dysmyelinating or demye-linating disease.
Myelination is a dynamic process
starting
during
intrauterine life
and
continuing
after birth and can thus be used as an
index
of brain maturation
. This
is
particularly
true in the first
2
years, when changes
are occurring
most rapidly.
Since
MR
imaging of the brain in
infants
and young children is being performed
with
increasing
frequency when developmental delay is
suspected
clinically
,
it
offers a
unique
opportunity to study myelination
in
vivo
in
normal and abnormal
children
both
sequentially and
relative to
a known standard. Such children
are
routinely
screened
using combinations of long
and
short TR and long and
short
TE
spin-echo pulse
sequences. It is
therefore imperative for the radiologist to
be
familiar with the
normal appearance of the progression of
myelina
t
ion
on these sequences
if
delay
in myelination or abnormalities involving
the white matter are
to
be
detected
and
accurately diagnosed at
the earliest
possible
time.
It is
also important that the
normal appearance of
the
brain
of infants, which is
different
from that of the adult
,
not be mistaken for myelination abnormalities.
Previous studies
evaluating
the brain of
a small
number
of infants
using
spin-echo pulse sequences suggest isointensity
between gray and white matter in the
first
3
months of life
[1-3]
.
Following
a transient
appearance
of white matter
hyperintensity
relative
to
gray
matter
at 4 to 6
months
,
gray-white differentiation
has
reportedly reverted
to
an early adult
pattern
at
approxi
mately
9
months
to 1
year
[3].
As our preliminary
observations were discrepant with these findings
,
we
reviewed
all
MR
studies
of
the brains of children
under
3 years old obtained in the
previous 2 years
.
This
study establishes the spin-echo
MR
appearance of the
progression of myelination and
the gray-white matter
differentiation
patterns in
developmentally normal infants
from birth to 3 years and
demonstrates
the ability
of MR
to
detect
slower
progression
of the myelination process
in
developmentally
delayed children.
Materials
and
Methods
70
DIETRICH ET AL.
AJNR:9, January/February 19881984 and November 1986 were reviewed. Studies demonstrating severe structural anomalies, hydrocephalus, or demyelinating dis-ease, or those that were suboptimal due to motion artifacts, were excluded. The study population thus consisted of 64 children, ages 4 days to 36 months (mean age, 12.4 months), whose age distribution is shown in Figure 1. Thirty-nine were boys and 25 were girls.
Technique
All studies were performed with either a 0.3-T permanent magnet' or a 0.35-T superconducting magnet.' T2-weighted spin-echo pulse sequences (SE 2000/80 or 84) were obtained for all patients, 58 in the axial plane and six in the coronal plane. The thickness of the slices obtained was either 5-mm contiguous cuts or 7 -mm cuts with 3-mm gaps between adjacent cuts. Additional short TR, short TE pulse sequences (SE 300 or 500/18, 28, or 30) were obtained for the majority of patients. All patients were scanned with standard adult head coils. Patients were routinely sedated before scanning with either chloral hydrate 50-75 mg/kg orally, or a combination of De-merol 2 mg/kg, Thorazine 1 mg/kg, and Phenergan 1 mg/kg admin-istered intramuscularly 30 min before scanning.
Analysis
Subjective analyses of the relative intensity of the gray and white matter (i.e., opinions of observers about relative signal intensities in a given MR slice) were made in the regions of the anterior and posterior limbs of the internal capsule, anterior and posterior centrum semiovale, frontal and temporal lobes, and posterior fossa. These evaluations were carried out by two of the authors simultaneously in each case, with discussion as necessary to agree on the grade assigned to minimize observation variation. The readers graded all cases without prior knowledge of patient age or clinical history. The signal intensity of each area was graded from 0 to 10 (0
=
air, 10=
subcutaneous fat).
Although our grading system is subjective, we believe it is a more accurate reflection of assessment of gray-white matter differentiation than are quantitative T1 and T2 measurements or computer-density measurements because of the small size of the areas that would be sampled compared with the slice thickness of the scans obtained.
Clinical correlation was obtained in all cases and developmental delays noted. The patient population was divided into two groups:
(1) children with normal neurologic development (34 cases) and (2) children with clinical evidence of developmental delay (30 cases).
The images obtained of the developmentally normal group were reviewed in chronological order to establish the normal appearances in progression of myelination with age. Images of the children with developmental delay were also evaluated to see if there was a significant delay in the progression of the myelination patterns or abnormal myelination patterns as compared with the normal group.
Results
Images obtained in both groups were of diagnostic quality
.
In
all patients
scanned
, gray-white matter differentiation was
demonstrated on SE
2000/80
or 84
sequences
using both
the
0
.
3-T and
0.35-T magnets. Although developmentally
normal children showed a spectrum
of
relative intensities
of
gray and
white matter,
the gray-white
matter patterns
ob-• Fonar 9-3000 body imager, Melville, NY.
t Diasonics MT/S whole body imager, Milpitas, CA.
PATIENT AGE RANGE
8.0
fIl
(l) 5.0·
fIl Delayed
(\j
-NOnDal U
[image:2.613.316.556.81.275.2]4.0·
...
0I-. 3.0· (l)
.0
2.0·S
.
~
.
...
.
lllulL
U
...
:J
Z
1.0·JJlW,
0.0·0 3 8
"
12 15 18 III 24 27 30 33 38AGE (MONTHS)
Fig. 1.-Age range of clinically normal and developmentally delayed infants.
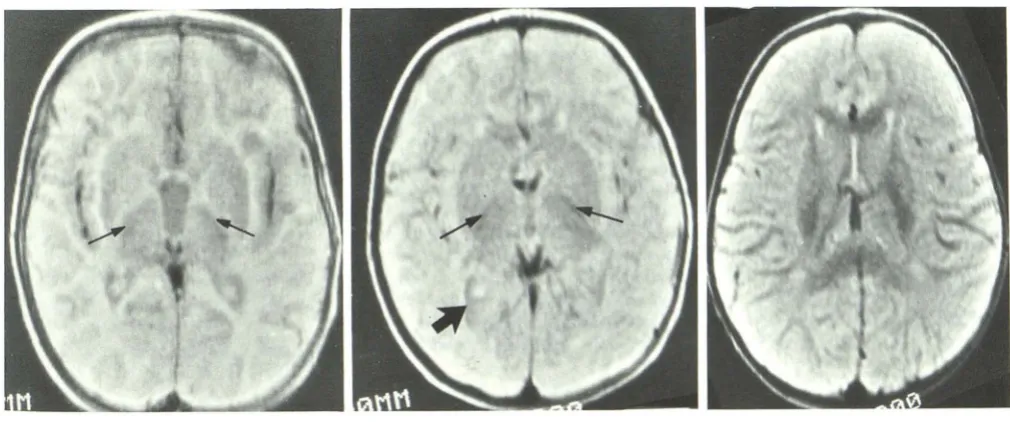
served fell into three distinct groups (see Ta
b
le 1). In the first,
white matter had higher Signal intensity than gray matter
(subjective rating of white matter was two grades or more
higher t
h
an gray matter at t
h
e leve
l
of the centru
m
semiova
l
e).
Th
i
s pattern was observed in all
c
hil
d
ren
u
nder 7 m
o
nt
h
s
old
and was thus classified as the infantile patt
e
rn (Figs. 2 and
3). N
o
child in this age group demonstrated
iso
intensity
be-tween the gray and white matter
.
An early adult pattern
(subjective rating of gray matter two grades
o
r more higher
than white matter) was seen in all n
o
rmal children over 12
months old (Fig. 5).
The youngest child with this pattern was 10 mo
n
ths old
.
Children between the ages of 8-12 months demonstrated a
transient iso
i
ntense phase with poor differe
n
t
i
at
i
on of gray
and white matter (sub
j
ective rating of gray and w
h
ite matter
differed by l
e
ss t
h
an two grades) (F
i
g.
4).
T
his transient
pattern was rare
l
y seen throughout the entire brain at one
time. Patients more frequently showed an infantile-isointense
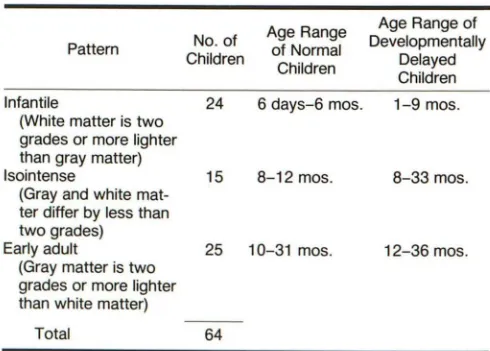
TABLE 1: PaHerns of Gray-White MaHer Differentiation
Pattern
Infantile
(White matter is two grades or more lighter than gray matter) Isointense
(Gray and white mat-ter differ by less than two grades) Early adult
(Gray matter is two grades or more lighter than white matter)
Total
No. of Children
24
15
25
64
Age Range Age Range of Developmentally of Normal
Delayed Children
Children 6 days-6 mos. 1-9 mos.
8-12 mos. 8-33 mos.
[image:2.613.311.556.556.732.2]AJNR:9, January/February 1988
INFANT EARLY MYELINATION PATTERNS
71
A
8
c
Fig. 2.-lnfantile pattern in 6-day-old boy. Axial MR images (SE 2000/84). Supratentorial white matter has diffusely higher signal intensity than gray matter (arrowheads) at all levels.
A, Level of centrum ovale.
8, Level of basal ganglia.
C, Level of temporal lobes and posterior fossa. Areas of myelination (arrows in 8 and C) already present in cerebellum and thalami.
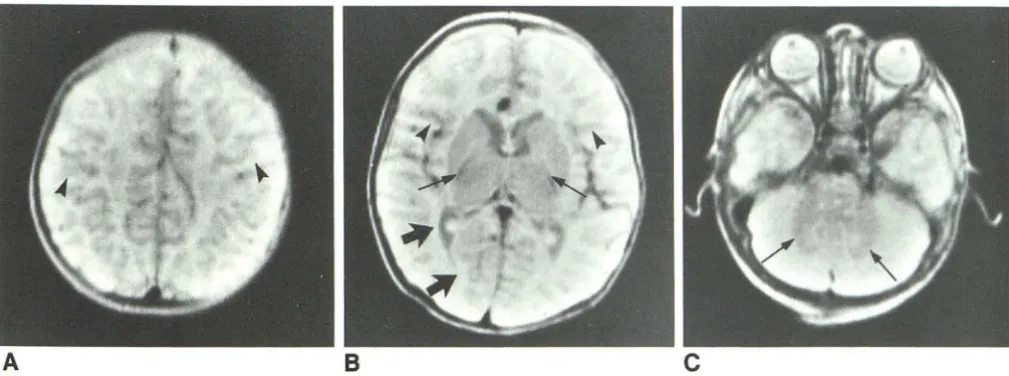
Fig. 3.-lnfantile pattern in 3-month-old boy. Axial MR images (SE 2000/84).
A, Level of centrum ovale white matter has higher signal intensity than gray matter (arrowheads in A and 8), as in the 6-day-old boy (Fig. 2).
8, Development of myelination in posterior limb of internal capsule (thin arrows) and optic radiation (thick arrows) is seen as low signal intensity.
C, Myelinated area of cerebellum (arrows) is larger than in 6-day-old boy.
transition
phase or an isointense-adult
transition
phase
.
In
one 11-month-old child all
three
patterns were identified
con-comitantly (Fig. 6). When more than one pattern was
seen
in
different areas of
the
brain of
the same child
,
the more
immature
pattern was always present
in the
areas of
later
myelination
.
As the process of myelination progressed, the previously
non myelinated
,
high signal intensity
,
infantile
supratentorial
white matter developed lower signal intensity. This
generally
followed
established patterns
[2-7] (Fig. 7); that is,
myelina-tion
first
seen
in
the thalamus
followed
by
the
posterior
limb
of the internal
capsule,
the optic radiat
i
ons
, the anterior limb
of
the
internal
capsule
,
centrum ovale
,
and finally
subcortical
extension to the frontal and temporal
lobes
.
In
children under
1
month old, both the posterior and anterior internal capsule
had high signal intensity
,
as
did all the white matter
.
As
myelination progressed in specific areas
,
the affected white
matter
,
which
had high
signal intensity prior to this
time,
developed
decreasing signal intensity
.
In all normal children
over
1 month old, the development of myelination was seen
[image:3.615.54.557.79.273.2] [image:3.615.53.558.339.527.2]72
DIETRICH ET AL.
AJNR:9, January/February 1988A
B
Fig. 4.-lsointense pattern in 10-month-old girl. Axial MR images (SE 2000/84). Signal intensities of gray and white matter are similar at all levels.
A, Myelination present in white matter of centrum semiovale (arrows).
B, Myelination is seen in anterior (arrowheads) and posterior limbs of internal capsule and optic radiations (arrows).
C, There is no significant difference between white matter and gray matter in the cerebellum.
A
B
c
Fig. 5.-Early adult pattern. Axial MR images (SE 2000/84) in 1-year-old boy. White matter now has lower signal intensity than gray matter at all levels.
In B we believe that the bilateral linear hyperintense signal in medial portion of occipital white matter represents subependymal glial cells.
internal
capsule
and radiation to the precentral gyrus (6
months)
,
the parietal and
frontal central
white matter (8
months)
,
and the white matter of
the
temporal lobes (1 year).
After
the
age
of 1 year, the portion of central white matter
myelinated increased progressively as myelination occurred
in
the
subcortical fibers
,
and the gray-white matter signal
intensity differentiation increased
.
Despite
patho
lo
g
i
c
reports of intrauterine myelination of the
inferior cerebellar peduncles
,
myelination in the posterior
fossa
has
reportedly not been visualized by MR until age 3
months [3).
In our
series,
however
,
areas
of
myelination
were
seen
in
this region as early as
6 days and progressively
increased in size
with
age
.
Developmentally Delayed Children
When developmental delay was present
,
the infantile
pat-tern
age range extended to 9 months, and the isointense
pattern extended to 33 months in this series (Figs. 8 and 9)
.
Figures
8-10
depict the age ranges
for
each of these patterns
[image:4.612.57.560.86.267.2] [image:4.612.57.560.332.549.2]AJNR:9. January/February 1988
INFANT EARLY MYELINATION PATTERNS
73
A
B
C
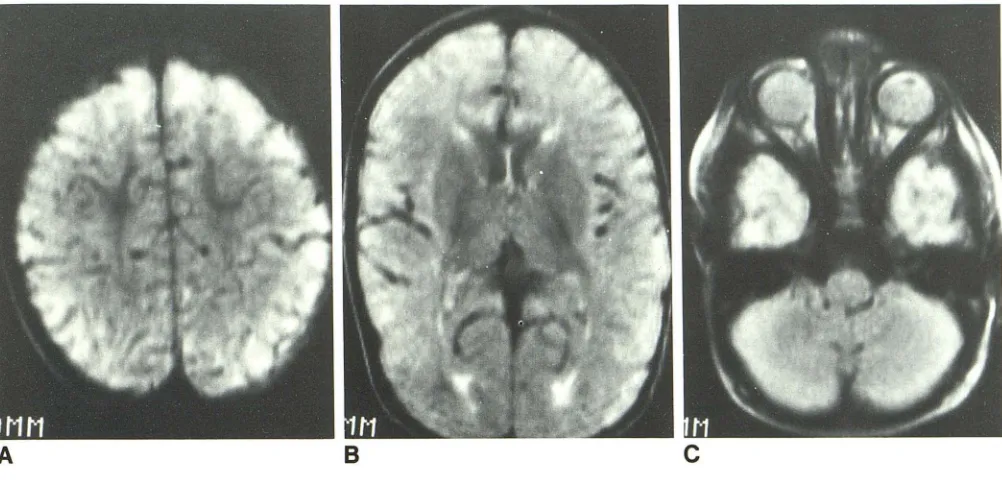
Fig. S.-Transition pattern in 11-month-old boy. Axial MR images (SE 2000/84).
A, At level of centrum ova Ie, white matter is beginning to show lower signal intensity than gray matter. B, At level of basal ganglia, white and gray matter of occipital and frontal lobes show isointensity.
C, At level of temporal lobes, white matter has higher signal intensity than gray matter, characteristic of infantile pattern.
Case 1
This 8-month-old boy (Fig. 11) was noted by his pediatrician
to
have hypotonia and delayed motor milestones. He was
the
7 Ib 8 oz product of a full-term gestation following an
uncom-plicated pregnancy, labor, and delivery
.
Newborn examination
was within normal
limits.
At 4 months the baby demonstrated
persistent head lag and decreased muscle tone
.
At 8 months
the head lag was still present and the child was unable to sit.
MR showed an infantile-type gray-white matter
differentia-tion pattern. Myelinadifferentia-tion was present in the posterior fossa
and thalami. A small
amount
of myelination was also
seen
in
the posterior limb of the internal capsule consistent with a
developmentally normal child of approximately 1 month
.
Case 2
This 18-month-old girl (Fig. 12) demonstrated congenital
nephrosis and failure
to
thrive. She was the 7 Ib 12 oz product
of a full-term gestation
following
an uncomplicated pregnancy
,
labor
,
and delivery. The baby did well until age
2
months
,
when she had
two seizures.
Evaluation at
that time
revealed
acute renal failure
,
and biopsy documented
congenital
ne-phrosis. She has been maintained on peritoneal dialysis
since
that time. Developmentally
,
at 18 months
she could transfer
objects well but could not roll over or sit alone. She was
diffusely hypotonic and had bilateral
symmetric
hyperreflexia
.
An MR study revealed myelination
in
the posterior
fossa
and optic radiations
.
A small amount of myelination was
also
present in the anterior limb of
the internal capsule consistent
with a
normally developing
child of
5-6
months
.
Case 3
This 20-month-old
girl
(Fig
.
13) presented
with
fever
and
cervical
adenopathy. She was
the
8 Ib 1
oz product of a
normal pregnancy
,
labor,
and
delivery
,
and
was previously
healthy
.
At the time of admission
she
had
been symptomatic
for
6
weeks.
Routine blood tests revealed hemaglobin
of
6
.
5
,
and a cervical node biopsy
showed
histiocytosis
X.MR
studies
demonstrated
early
adult-type gray-white
mat-ter differentiation patmat-tern
.
Although myelination
was
present
in the parietal white matter
,
this
was
less extensive than
would be
expected
at
20 months
and
was more consistent
with a developmentally normal
child of 12 months.
Discussion
Although the process of myelination
has been
well
docu-mented pathologically
,
in
the past
with a small
number
of
autopsy
infant
brains
[4-9]
and
more recently
by
a more
extensive series
[10]
,
until the advent of
MR
,
it was
not
possible
to
study
myelination in vivo or sequentially
. Elegant
neurochemistry
studies
have
shown myelogenesis to be a
dynamic
process starting
during
intrauterine
life
and
continu-ing
after
birth. Generally
, the most archaic phylogenetic
sys-tems are myelinated
first
, myelination
proceeding
roughly in
a rostral
direction
,
the cortical
association
fibers being the
last
[4]. The initiation of
myelination
appears
in
different sites
at different times,
but has
begun in most areas by 8 months
of age.
Myelination proceeds at different rates in different
[image:5.612.58.559.82.322.2]74
DIETRICH ET AL.
AJNR:9, January/February 1988post. limb into capsule
Fig. 7.- Diagram adapted from [10]
demon-strating the time sequence of myelination seen
in infant brains at autopsy. White zone =
10-50% myelination; black zone = 50-90%
myeli-nation.
optic rad.
8 10 12 14 16 18 20 22 24
distal rad. to
precentral gyrus
ant. limb int.
capsule
occipital pole
post. parietal
pole
frontal pole
temporal pole
32 w k s ·S i ~ t h 2
1 yr. 2 yrs.
%
CIII
Age (months)
11.0
rn
(l)
11.0·
rn
ro
u
4.0·...
0
~ 3.0· (l)...0
2.0·S
~
Z
1.0·0.0· 0
10 50 90
INFANTILE
PATTERN
UeaD
tor
NL=
2.9UeaD
tor
DD=
4.9P-Value
<
0.025 T-Value = 2.2131
..
1.1.1. .. , .. , .. ,
~
.
,~.:~~.:~,
.. , .. ,
3 II II 12 111 16 21 24 27 30 33 36
AGE (MONTHS)
Fig. B.-Infantile pattern. Age distribution of normal and clinically
de-velopmentally delayed children.
within any site at all ages
.
By age 2 years
,
the myelination
process
,
although incomplete
,
has progressed rapidly from
the
newborn period. Figure 7
i
s adapted from work by Brody
et al.
[10]
and depicts the time of initiation and completion of
myelination in the
specific
areas analyzed
.
With the routine T2
-
weighted spin-echo pulse sequences
normally used to
evaluate
adult pathology
,
it is possible to
distinguish gray and white matter by MR in infants and to
demonstrate early
progression of myelination
.
The progession
of myelination
shown
by MR using spin-echo pulse sequences
correlated
well with the previously documented pathologic
mapping
.
At birth and generally
for
the first 8 months
,
there
is
reversal of
the normal
adult pattern
seen
on T2-weighted
images
,
white
matter being more
intense
than
gray
matter
.
It
is important
that radiologists
performing
MR a
r
e familiar
with
6.0
rn
(l)
6.0·
rn
a:j
U
4.0·
...
0
~ 3.0· 11)...0
2.0·S
~
Z
1.0·0.0·
0
ISOINTENSE
PATTERN
• , I i i I •
Uean
tor
NL = 9.8Uean
tor
DD = 17.7P-Value
<
0.01 T-Value = 2.610Delayed
- Normal
II
j j j
I
I I
. ,-, . • -r-r"l ~ I""""'YI ' i , • i i i • I i ' I i i I
3 6 II 12 15 16 21 24 27 30 33 36
AGE (MONTHS)
Fig. 9.-lsointense pattern. Age distribution of normal and clinically developmentally delayed children.
[image:6.612.56.528.74.513.2]AJNR:9, January/February 1988 INFANT EARLY MYELINATION PATTERNS 75
also be extremely useful as serial progression and thus
pos-sible delay in this progression may be seen on sequential
scans.
Despite the fact that the isointense phase is only a transient finding, a significant number of the children we evaluated
(23.4%) demonstrated this pattern. This is probably due to
the fact that the age range of this pattern in normal children
is from 8 to 12 months. At this time infants are achieving
well-established milestones such as sitting, crawling, and walking.
It may be that this is the time when parents first express
concern about possible developmental delay, and thus
chil-dren of this age range are more frequently evaluated.
6.0
en
(l)
11.0·
en
nj
U
4.0· 'H
0
H 3.0· (l)
..0
2.0·S
~
Z
1.0·0.0· 0
EARLY ADULT
PATTERN
Uean tor NL = 1B.5
Uean tor DD = 24.4
P-Vl1lue
<
0.05 T-Vl1lue = 2.026Delayed
- Normal
~utIULUIJ
lWLJ
3 6 " 12 15 III 21 24 27 30 33 36
Arm (MONTHS)
Fig. 10.-Early adult pattern. Age distribution of normal and clinically developmentally delayed children.
The early adult pattern was seen in normal children as early
as 10 months of age. Our findings of progression of this
pattern subcortically and the development of secondary
branching correlated with previously reported findings [3).
The statistically Significant differences in the age distribution
of normal and developmentally delayed children in three gray
-white matter pattern groups implies that the demonstration
of a more immature pattern of gray-white matter differentia
-tion or myelination than would be expected at a particular chronological age in infants should raise the suspicion of
developmental delay due to a delay or arrest in the myelination
process. MR is a noninvasive technique that may prove
extremely useful in the evaluation and serial follow-up of such
patients.
The discrepancy between our findings and those of pre
-vious reports using spin-echo T2-weighted sequences may
be due to several factors. If high-field-strength magnets are
used it may well be necessary to use sequences with longer
TR (in order to counter the increase in T1) before gray-white
matter differentiation can be seen, as has recently been
reported [13). In one prior study using a low-field-strength
magnet, the images obtained were less T2-weighted (SE
1080/40) than those obtained in our series, and this too may
have impaired its visualization [1). Two other studies, however
[2, 3], reported images that were obtained with similar pulse
sequences using similar field strength magnets. Different
observations may be related to a small number of infants
under 6 months old scanned in these particular studies or
possibly to poor visualization of gray-white matter
differentia-tion due to patient motion, radio frequency artifacts, or
inap-propriate windowing during photography.
In conclusion, good gray-white matter differentiation and
progression of myelination can be seen on T2-weighted
spin-echo MR images in normal infants. This series thus estab
-Fig. 11.-Case 1. a-month old boy with devel-opmental delay. Infantile pattern with myelination
only present in the thalami bilaterally (arrows).
Fig. 12.-Case 2. 18-month-old girl with
devel-opmental delay. Isointense pattern with myelination present in posterior limb of internal capsule (thin
arrows) and optic radiations (thick arrow).
Fig. 13.-Case 3. 20-month-old girl with developmental delay. Early adult pattern
consistent with a developmentally normal
[image:7.613.55.299.264.436.2] [image:7.613.56.561.485.696.2]76
DIETRICH ET AL.
AJNR:9, January/February 1988lishes the normal early myelination changes using this pulse
sequence
.
There was a
statistically
significant difference
be-tween
the age ranges of the normal and developmentally
delayed children showing the infantile
,
isointense, and adult
patterns. Demonstration of a pattern more immature than is
normally
seen at
a particular
age
correlated with clinical
developmental delay.
REFERENCES
1. Johnson MA, Pennock JM, Bydder GM, et al. Clinical NMR imaging of the
brain in children. Normal and neurologic disease. AJNR 1983;4: 1 013-1026
2. Lee BCP, Lipper E, Nass R, Ehrlich ME, de Ciccio-Bloom E, Auld PAM.
MRI of the central nervous system in neonates and young children. AJNR
1986;7 :605-616
3. Holland BA, Haas OK, Normal 0, Brant-Zawadzki M, Newton TH. MRI of
normal brain maturation. AJNR 1986;7:201-208
4. Yakovlev PI, Lecours AR. The myelogenetic cycles of regional maturation
of the brain. In: Minkowski A, ed. Regional development of the brain in
early life. Oxford: Blackwell, 1967:3-69
5. Davison AN. Myelination and diseases of the nervous system: abnormalities of myelin composition. Myelination. Springfield, IL: Thomas, 1970: 163-183
6. Dobbing J, Sands J. Quantitative growth and development of human brain.
Arch Dis Child 1973;48:757-767
7. Lucas Keene MF, Hewer EE. Some observations of myelination in the
human central nervous system. J Anat 1931;6:1-13
8. Benjamins JA, McKhann GM. Development, regeneration, and aging of the
brain. In: Siegal GJ, Albers RW, Agranoff BW, Katzman R, eds. Basic neurochemistry. Boston: Little, Brown, 1981 :445-469
9. Larroche JC. Development of the central nervous system. In: Develop-mental pathology of the neonates. Amsterdam: Excerpta Medica,
1977:319-354
10. Brody BA, Kloman AC, Gilles FH. An autopsy study of infant myelination.
J Neuropathol Exp Neurol 1987;46(3):283-301
11. Brant-Zawadzki M, Enzmann DR. Using computed tomography of the
brain to correlate low white-matter attenuation with early gestational age
in neonates. Radiology 1981; 139: 1 05-1 08
12. Quencer RM. Maturation of normal primate white matter: computed
tom-ographic correlation. AJNR 1982;3:365-372
13. Nowell MA, Hackney DB, Zimmerman RA, Bilaniuk LT, Grossman RI,
Goldberg HI. Optimal pUlse-sequence parameters for MR imaging of the

![Fig. 7.-Diagram 50% in strating infant adapted from [10] demon-the time sequence of myelination seen brains at autopsy](https://thumb-us.123doks.com/thumbv2/123dok_us/1174220.639737/6.612.56.528.74.513/diagram-strating-infant-adapted-sequence-myelination-brains-autopsy.webp)