J. Exp. BioL (1969), SO, 79-86 yg With 1 text-figure
Printed in Great Britain
THE ACID-BASE STATUS OF THE BLOOD OF
THE DEVELOPING CHICK EMBRYO
BY C. DAWES AND K. SIMKISS*
Department of Physiology and Biochemistry, The University, Reading, Berks.
(Received 27 May 1968)
INTRODUCTION
The avian embryo develops within a cleidoic egg which largely insulates it from the environment. There is an exchange of respiratory gases into the air space of the egg and into the surrounding air via the pores in all parts of the eggshell, but as development progresses and the metabolism of the embryo increases this exchange appears to become incomplete. Thus, in the egg of the domestic fowl, Visschedijk (1962) found that the carbon dioxide in the air space increased up to 5-6% during the time when the chorio-allantoic membrane was acting as a respiratory surface and rose further to 6-6% during the period of pulmonary respiration before hatching. Shortly before the shell was pipped there was an average carbon dioxide concentration of about 8% in the air space. The carbon dioxide tension of the blood of avian embryos has never been measured, but it appears likely, from the air space analyses, that the embryo would be in a state of progressive respiratory acidosis during the latter half of its development. This possibility would be in agreement with the observations of Beattie (1964), who found evidence for a rapid release of carbon dioxide from chick embryos at the time of hatching.
A number of attempts have been made to measure the pH of chick embryonic blood. According to Cohn & Mirsky (1929) oxygenated blood from 8-day embryos had a pH of 7-03 which rose to 7-23 on the 20th day of incubation. Their data are, however, extremely variable and they had to dilute the blood with saline in order to have a sufficiently large sample to analyse. More recently Abramovici (1967) has used microelectrodes to follow the changes in pH of the body fluids of chick embryos. He obtained values of 7-4-7-5 on days 9-10 and a steady pH of 7-64 + 0-05 for the remaining period of incubation. These values were obtained from plasma rather than whole blood so that there is the possibility of some slight change in pH during the preparation of the specimens.
The sparse evidence available suggests, therefore, that although there may be a rise in carbon dioxide tension the pH of the blood does not fall during development. In most vertebrates this would be interpreted as a renal compensation for respiratory acidosis and would be accompanied by an excretion of hydrogen ions in the urine (Pitts, 1963). It has, in fact, been shown on a number of occasions that the allantoic fluid of the avian embryo changes from a slightly alkaline pH of over 7-4 during the first 2 weeks of incubation to a pH of 5-8 on the 14-15^ day of incubation (Shkylar,
1937; Walker, 1943; Abramovici, 1967). The understanding of these acid-base disturbances is complicated by two facts. First, there are many developmental phenomena which complicate any simple analysis of the acid-base changes. Thus, there is a doubling of the 'total solids' content of the blood between day 10 and the end of incubation (Schechtman, 1952), and the main buffer of the blood, haemoglobin, also increases. On day 9 the haemoglobin content is 4-8 g.%, rising steadily to 5*5 g-% (d a v I2)> 8'2 g-% (day 15) and IO-I g.% (day 18) (Barnes & Jensen, 1959). The composition of the haemoglobin also changes (Simons, 1966). Superimposed upon these changes in blood buffers is a second complicating factor, namely that the embryo resorbs the inner parts of the calcareous eggshell during the latter part of incubation. About 100 mg. of calcium are obtained and used by the embryo for bone formation (Simkiss, 1967) but nothing is known about the use of the associated carbonate. It has been assumed (Romanoff, 1967) that it is converted into carbon dioxide but this greatly oversimplifies the situation and ignores the fact that it is an important buffer for the developing embryo.
Almost none of these intriguing changes in the chemistry of the avian embryo have been related to the way in which the developing bird defends itself against the various acidotic and alkalotic influences to which it is normally exposed. The following investigation was therefore undertaken in order to determine the pH, PC O t and bicarbonate levels of embryonic blood at various stages of incubation. These analyses provide a basis for delimiting the extent of the problem, and by combining them with estimates of 'base excess' it is also possible to relate any disturbance and its com-pensation to respiratory or non-respiratory influences.
MATERIALS AND METHODS
Fertile eggs of the domestic fowl (White Leghorns) were used throughout this work. They were incubated at 1030 F. in commercial 'still-air' incubators using normal practice. The degree of development of the embryos was determined firstly by timing their period of incubation and secondly by measuring their 3rd toe length and relating this to the developmental stages of Hamburger & Hamilton (1951). The results are expressed as 'days of incubation', but it should be realized that this is only partly a chronological scale and also involves reference to a scale of normal development.
Blood was collected anaerobically from the embryos by opening the shell and inserting a heparinized capillary tube into the heart. It is not possible to collect sufficient blood for analysis before the 1 ith day of incubation so that the experimental observations are restricted to the latter half of the incubation period. The cardiac puncture technique is a satisfactory way of collecting blood up until the last few days of incubation when the animals are inclined to struggle. This was avoided in hatchlings by immediately decapitating the animals and collecting fresh blood from the bleeding surfaces into the heparinized capillary tubes.
Acid-base status of chick embryo blood 81
volumetric analysis. The pH of the equilibrated blood was determined with a Radio-meter microelectrode maintained at 380 C. The pH of normal blood was also measured with the same instrument. The log. Poo,/pH relationship of blood is normally linear and this was confirmed for embryonic blood. It is therefore possible to plot the pH and log. PCo, values for the equilibrated samples and thus to determine graphicallyPco, of the normal blood from its pH value. The slope of the log P ^ / p H line is
a measure of the buffering ability of the blood and the position of the line is a measure of the base excess. This is defined as ' the titratable base on titration to normal pH at normal PQQ and normal temperature' (Sigaard-Andersen, 1965).
Base excess and bicarbonate values can be determined from the log P ^ / p H lines using nomograms prepared for human blood. Alternatively it is possible to calculate the bicarbonate values of embryonic blood by applying the Henderson-Hasselbalch equation
using a value of 6-09 ior pKx (Helbacka, Casterline, Smith and Shaffner, 1964) and
0-032 for a (Severinghaus, Stupfel & Bradley, 1956).
In the above experiments values of Pco, were obtained by graphical analysis. The carbon dioxide tension has also been determined directly, however, by using a Severinghaus microelectrode. Although this electrode only requires about 70 fil. blood it is often not possible to obtain this extra sample when all the above analyses are also performed. The experiment was therefore performed in a separate set of analyses (series B, Table 1) on the 13th, 15th and 18th days of incubation and on 2-day-old hatchlings.
RESULTS
The changes in pH, Pco,i bicarbonate and base excess levels of embryonic blood are shown in Fig. 1 for the series A experiments. The actual values (means + S.D.) are shown in Table 1. The day-to-day variations in the values are not significantly different, as assessed by Students t test, except for the changes in bicarbonate and base excess levels during days 13-16 (P < o-ooi) and for the fall in pH on day 19 (P < o-oi).
Continuous sampling of the blood from individual embryos showed very little variation in pH with time, providing the blood flowed easily during the cardiac puncture. The variations in Pc o, were checked by comparing the values of carbon dioxide determined graphically from the nomograms of Sigaard-Anderson (series A) with actual determinations using the carbon dioxide electrode (series B). The results are shown in Table 1. The two sets of readings were compared using Students t test and showed no significant difference although the values obtained from the carbon dioxide electrode were generally slightly higher than the readings obtained graphically. The values of Pco, plotted in Fig. 1 show that there is a continuous rise from 11 to 19 days with the greatest rate of increase being in the 12- to 14-day period. After
19 days the carbon dioxide tension of the blood falls quickly until hatching.
The increase in blood bicarbonate (Table 1) is due to two effects. First, there is a direct increase due to the increase in carbon dioxide tension, and secondly, there is an increase due to the addition of extra base to the blood. This second effect is by far the most important in the present work and can be isolated from the effects of
Embryo age days
I
I
I2 I3
13-14 I4 I5 16 I7 18 I9 20 2
1
22 23
1 ault: 1. Lnunges zn pn, rcos, ozcaroonare ana oase excess levels 01 tne olooa OJ cnt~~ cmvryw uurq uewewpnienr (Figures refer to mean values f S.D. The number of observations involved are shown in parentheses after each mean.) Series A Series B Series A Series B Bicarbonate
(m-equiv.11.) L
83
Q, of 40 mm. Hg.
Acid-base status of chick embryo blood carbon dioxide variations by correcting all values to a standard PQ These corrected values are shown as ' base excess' levels in Fig. 1.
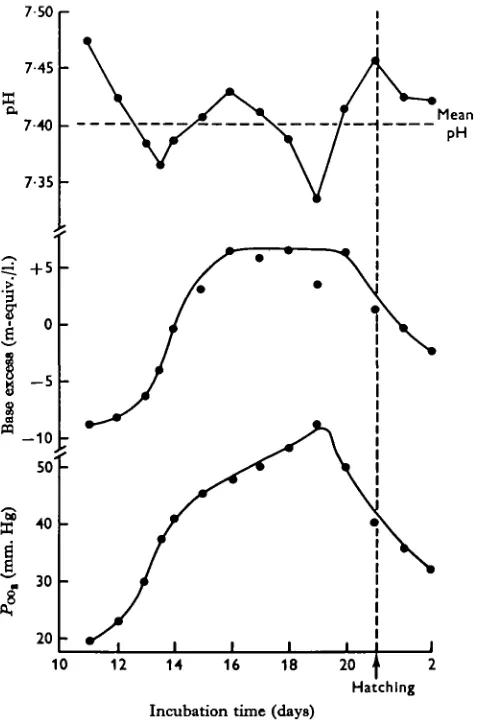
The pH of the blood remains throughout the incubation period within narrow limits. The mean value of 129 readings taken between the n t h and 21st days of incubation was 7*401 + 0-050. There are, however, two tendencies for it to fall, reaching 7-365 ±0-036 on days 13-14 and 7-334 + 0-040 on day 19 (Fig. 1). These values were highly significantly different (P < o-ooi) from the mean values of all readings as assessed by Students t test.
[image:5.451.111.351.176.536.2]Incubation time (days)
Fig. i. The changes in blood pH, base excess and carbon dioxide tension during the develop-ment of chick embryos. The time of hatching is arbitrarily fixed at 21 days and the data for 1- and 2-day-old hatch]ings are also included. The circles represent mean values, the standard deviations of which are shown in Table 1, series A.
DISCUSSION
It is apparent that the following are the main acid-base changes in the blood during incubation.
(1) A continuous rise in Poo, from a value of about 19 mm. Hg on day 11 to about 57 mm. Hg on day 19.
(2) A rapid rise in bicarbonate content which occurs mainly during the period from 12 to 16 days when the level changes from about 16 to 33 m-equiv./l.
(3) A similar rapid change in base excess from —8 to + 6-8 m-equiv./l. during the same 4-day period.
It is thus apparent that the large change in blood bicarbonate (17 m-equiv./l. in 4 days) is mainly due to a change in base excess (15 m-equiv./l. in 4 days) which indicates an influx of extra bicarbonate into the blood. This influx of base lags slightly behind the rise in Pco, by about 24 hr., although it should be realized that this analysis is based entirely upon averaged data. The ratio of HCO3/aCO2 passes from a value of 24^2 on day 11 to a minimum of i9'0 in the period 13—14 days, before rising again to a value of 23-4 on day 17. The ratio of the buffer components HCO8/ H2CO8 determines the pH of the blood so that the fall in pH on day 13-14 can be interpreted as due to the lag in the increase of bicarbonate (Fig. 1).
The level of base excess in the blood reaches a plateau between days 16 and 20, although the Pc 0, continues to rise until day 19. Again therefore the ratio HCO8/aCOg falls to i7"7, so that there is a corresponding minimum pH value on day 19 (Fig. 1). After this time the PQQM starts to fall as the embryo assumes pulmonary respiration
and pips the shell. Thus, for a short time the ratio HCO3/aCOa rises and the embryo is in a temporary state of alkalosis. This soon passes, however, as the bicarbonate level of the blood decreases from about 34 m-equiv./l. on day 20 to 25 m-equiv./l. on the day after hatching.
The changes in blood pH can therefore largely be explained on the basis of two variables, i.e. the carbon dioxide tension and the blood bicarbonate levels.
Acid-base status of chick embryo blood 85
been expected with increased muscular activity, i.e. the blood pH rises and -Pco, falls.
The changes in blood bicarbonate levels are largely due to an influx of extra 'non-respiratory' bicarbonate as the base excess curves indicate. The increase occurs in the period from day 12 to day 16 and is most likely to come from either the resorption of the eggshell, the activity of the kidney, or both. The chorio-allantoic membrane first touches the eggshell on about day 10 of incubation but does not reach its maximum size until about day 14. Throughout the remainder of the incubation period the chorio-allantois lines the inner part of the calcarous eggshell and resorbs mineral from it. About 100 mg. calcium enter the chick embryo by this route (Johnston & Comar, 1955), so that about 150 mg. of carbonate ions would also be made available to the blood. If it is assumed that this enters the embryo and is spread evenly through-out 20 g. of tissue this would raise the bicarbonate concentration by 250 m-equiv./l. The pH in such a case can be calculated from the Henderson-Hasselbalch equation on the basis of a maximum Poo, of 60 mm. Hg (Table 1), i.e.
pH = 6-i+log. 2 5° , = 8-2.
0-03 x 60
It is apparent from the pH measurements shown in Table 1 that this value is never attained. Thus, the carbonate of the shell does not remain in solution within the tissues and the embryo must, in some way, control its bicarbonate content. The limits of normal variation found in this study are from 15 m-equiv./l. on day 11 to a maximum bicarbonate concentration of about 35 m-equiv./l. on day 18 (Fig. 1). In this respect it is interesting to note that Harsch & Green (1963) found a corre-sponding change in the electrolyte content of plasma between the n t h and 18th days of incubation. Their analyses showed that the sodium and potassium content rose from 145 to 154 equiv./l., while the chloride concentration fell from n o to 98 m-equiv./l. during this period. Thus, as they pointed out, there must be a corresponding increase of about 21 m-equiv./l. in some unknown anion. The rise of 20 m-equiv./l. in blood bicarbonate levels found in the present study would thus account for this anion deficiency and so maintain the electro-neutrality of the blood.
SUMMARY
1. The pH, carbon dioxide tension, bicarbonate and base excess levels of chick embryos have been measured during the period of 11 days of incubation until the 2nd day post hatching.
2. The carbon dioxide tension rises continuously from a value of about 20 mm. Hg on day 11 to a maximum of almost 60 mm. Hg on day 19.
3. The bicarbonate content rises rapidly from the 12th day (16 m-equiv./l.) until the 16th day (33 m-equiv./l.).
4. The pH falls to minimum values on the 13-14^ day and the 19th day.
5. These variations are discussed in relation to the physiology of the developing embryo and its acid-base metabolism.
REFERENCES
ABRAMOVICI, A. (1967). L'evolution du pH du plasma et des liquides extraembryonnaires de l'embryon de Poulet au cours du developpement normal. C. r. hebd. Seanc. Acad. Set., Paris 365, 336-9.
BARNES, A. E. & JESSES, W. N. (1959). Blood volume and red cell concentration in the normal chick embryo. Am. J. Pkysiol. 197, 403-5.
BEATTIE, J. (1964). The oxygen uptake and carbon dioxide output of late chick embryos. Br. Poultry Set. 5, 260-76.
CLARK, A. M. (1951). Carbonic anhydrase activity during embryonic development. J. exp. Biol. 38,
332-43-COHN, A. E. & MrBSKY, A. E. (1929). The hydrogen concentration of the blood of chicken embryos as a function of time. J. gen. Phytiol. 12, 463—8.
HAMBURGER, V. & HAMILTON, H. L. (1951). A aerie* of normal stages in the development of the chick embryo. J. Morph. 88, 49-92.
HARSCH, M. & GREEN, J. W. (1963). Electrolyte analyses of chick embryonic fluids and heart tissues. J. cell. comp. Pkysiol. 63, 319-26.
HELBACKA, N. V., CASTERLINE, J. L., SMITH, C. J. & SHAFFNER, C. S. (1964). Investigation of plasma
carbonic acid pK. of the chicken. Poult. Sei. 43, 138-44,
JOHNSTON, P. M. & COMAR, C. L. (195s). Distribution and contribution of calcium from the albumen, yolk and shell to the developing chick embryo. Am. J. Pkysiol. 183, 365-70.
PITTS, R. F. (1963). Pkysiology of the Kidney and Body Fluids. Chicago: Year Book Medical Publishers. 243
PP-ROMANOFF, A. L. (1967). Biochemistry of the Avian Embryo. New York: John Wiley. 398 pp. SCHECHTMAN, A. M. (1952). Physical and chemical changes in the circulating blood. Ann. N. Y. Acad.
Sci. 55, 85-9S.
SEVERINGHAUS, J. W., STUPFBL, M. & BRADLEY, A. F. (1956). Accuracy of blood pH and pCO, deter-minations. J. appl. Pkysiol. 9, 189-96.
SHKYLAR, N. M. (1937). A study of physico-chemical changes in the egg during embryonic development in birds. Ukj. biochem. J. 10, 379-406.
SIGAARD-ANDERSEN, O. (1965). The Acid-Base Status of the Blood, 3rd ed. Munkgaard, Copenhagen. 134
PP-SIMKISS, K. (1967). Calcium in Reproductive Physiology. London: Chapman and Hall. 264 pp. SIMONS, J. A. (1966). The ontogeny of the multiple molecular forms of haemoglobin in the developing
chick under normal and experimental conditions. J. exp. Zool. 16a, 219—30.
VISSCHEDIJK, A. H. J. (1962). Praenatale gastnsseling biy de kip. Uitgevery, G. van Dyk. N. V. Breuke-len, 159 pp.