3 4 5 6 7 8 9 10 11 12 13 14 15 16 17 18 19 20 21 22 23 24 25 26 27 28 29 30 31 32 33 34 35 36 37 38 39 40 41 42 43 44 45 46 47 48 49 50 51 52
GUIXIN YE, ZHANYONG TANG, DINGYI FANG, XIAOJIANG CHEN,
Northwest University, ChinaWILLY WOLFF,
Lancaster University, U. K.ADAM J. AVIV,
Naval Academy, U.S.A.ZHENG WANG,
Lancaster University, U. K.Pattern lock is widely used for identification and authentication on Android devices. This article presents a novel video-based side channel attack that can reconstruct Android locking patterns from video footage filmed using a smartphone. As a departure from
previous attacks on pattern lock, this new attack does not require the camera to capture any content displayed on the screen. Instead, it
employs a computer vision algorithm to track the fingertip movement trajectory to infer the pattern. Using the geometry information extracted from the tracked fingertip motions, the method can accurately infer a small number of (often one) candidate patterns to
be tested by an attacker. We conduct extensive experiments to evaluate our approach using 120 unique patterns collected from 215
independent users. Experimental results show that the proposed attack can reconstruct over 95% of the patterns in five attempts. We discovered that, in contrast to most people’s belief, complex patterns do not offer stronger protection under our attacking scenarios.
This is demonstrated by the fact that we are able to break all but one complex patterns (with a 97.5% success rate) as opposed to 60% of
the simple patterns in the first attempt.
We demonstrate that this video-side channel is a serious concern for not only graphical locking patterns but also PIN-based passwords, as algorithms and analysis developed from the attack can be easily adapted to target PIN-based passwords. As a countermeasure, we
propose to change the way the Android locking pattern is constructed and used. We show that our proposal can successfully defeat
this video-based attack. We hope the results of this article can encourage the community to revisit the design and practical use of Android pattern lock.
CCS Concepts: •Information security→Side-channel attacks;Privacy; Passwords; •Privacy→ Privacy leakage;
Additional Key Words and Phrases: Pattern lock, Fingertip movement, Video-based attack, Sensitive information, Object tracking,
Authentication mechanism
Extension of Conference Paper: a preliminary version of this article entitled “Cracking Android Pattern Lock in Five Attempts" by G. Yeet al.appeared in The Network and Distributed System Security Symposium (NDSS), 2017 [Ye et al. 2017].
The extended version makes the following several additional contributions over the conference paper, providing new contributions to the original paper: (1) It evaluates the security strength of patterns using an alternative security metric (section7.1.3); (2) It provides new evaluations to understand the impact of the screen size and the camera model on the success of the attack (section7.7); (3) It extends the attacking method to break PIN-based passwords, demonstrating the applicability of the attack on PIN-based passwords (section7.9); (4) It includes a limited study to evaluate the effectiveness of the attack, where the video footage only captures the fingertip (section7.10); (5) It proposes a simple, yet effective countermeasure. By making some small modifications to the way a pattern lock is generated, the success rate of the attack will drop significantly (section8.2); (6) It extends the related work to discuss some of the recent studies on the security of Android pattern lock in depth (section10).
Authors’ addresses: Guixin Ye, Zhanyong Tang, Dingyi Fang, Xiaojiang Chen, Northwest University, China, [email protected], {zytang,dyf, xjchen}@nwu.edu.cn; Willy Wolff, Lancaster University, U. K., [email protected]; Adam J. Aviv, Naval Academy, U.S.A., [email protected]; Zheng Wang, Lancaster University, U. K., [email protected].
Permission to make digital or hard copies of all or part of this work for personal or classroom use is granted without fee provided that copies are not made or distributed for profit or commercial advantage and that copies bear this notice and the full citation on the first page. Copyrights for components of this work owned by others than ACM must be honored. Abstracting with credit is permitted. To copy otherwise, or republish, to post on servers or to redistribute to lists, requires prior specific permission and/or a fee. Request permissions from [email protected].
© 2017 Association for Computing Machinery. Manuscript submitted to ACM
53 54 55 56 57 58 59 60 61 62 63 64 65 66 67 68 69 70 71 72 73 74 75 76 77 78 79 80 81 82 83 84 85 86 87 88 89 90 91 92 93 94 95 96 97 98 99 100 101 102 103 104
ACM Reference Format:
Guixin Ye, Zhanyong Tang, Dingyi Fang, Xiaojiang Chen, Willy Wolff, Adam J. Aviv, and Zheng Wang. 2017. A Video-based Attack for Android Pattern Lock.ACM Comput. Entertain.9, 4, Article 39 (October 2017),30pages.https://doi.org/0000001.0000001
1 INTRODUCTION
Graphical-based passwords, like the Android pattern lock, are widely used as a protection mechanism to prevent sensitive information leakage from mobile devices. It is preferred by many users over PIN- or text-based passwords, as psychology studies show that the human brain remembers and recalls visual information better than numbers and letters [De Angeli et al. 2005;Standing et al. 1970;Weiss and De Luca 2008]. According to a recent study, 40% of the Android users use patterns to protect their devices instead of a PIN [Bruggen 2014]. Pattern lock is also used by many critical applications for authentication. For example,Alipay, the largest third-party online-payment platform with over 450 million users in China, uses pattern lock as part of the login authentication. Considering its widespread usage, a security breach of the pattern lock could lead to serious consequences.
Security experts have demonstrated several ways to launch an attack for pattern lock in the past. These include thermal [Abdelrahman et al. 2017], smudge [Aviv et al. 2010] and WiFi attacks [Zhang et al. 2016]. However, these previous attacks all rely on assumptions that are often too strong to realize in practice, and as a result, the attack is unlikely to be successfully launched. For examples, thermal and smudge attacks can be easily disrupted by other on-screen operations after drawing the PIN or pattern, and they are less effective on lock patterns that contain multiple overlaps; wireless based attacks, on the other hand, require the environment to remain static, because any moving object nearby can interfere the wireless signal.
Recently, video-based analysis is shown to be effective in reconstructing PIN- or text-based passwords. Some of the early successes in this area rely on video footage filmed using a camera directly facing the screen or the keyboard [Balzarotti et al. 2008;Kuhn 2002]. Latest work shows that this limitation can be lifted by exploiting spatial-temporal dynamics of the hands during typing [Shukla et al. 2014]. Despite the success of video-based attacks on PIN-and text-based passwords, no work so far has exploited video-based side-channels to crack pattern lock. To do so, the attacker must deal with the fundamental difference between graphical patterns and PIN-or text-based passwords1. He must be able to map the user’s fingertip movements to a graphical structures and to translate the graphical structure into locking patterns. To overcome these challenges requires new methods and analysis to be constructed in the new application context of pattern lock.
In this article, we present a novel approach to crack Android pattern lock using video footage that captures the user’s fingertip motions when drawing the pattern. Unlike prior work on pattern lock attacks such as the thermal [Abdelrahman et al. 2017] and smudge attacks [Aviv et al. 2010], our approach does not require the video footage or images to be captured by a camera directly faced the screen. Furthermore, the video can be filmed at a distance of two meters away from the user in public places. Such a distance is less likely to raise suspicion compared to shoulder surfing [Rogers 2007] that requires a closer observation distance to have a clear sight of the content displayed on the screen. A recent study has shown that shoulder surfing is not perceived as a serious threat by many mobile users because to launch the attack an adversary has to stay close to the target [Eiband et al. 2017]; and as a result, many users do not take extra protection when entering sensitive information in public spaces. As a departure from prior approaches, our attack is more likely to succeed because the adversary can stay further away from the target and the attack does not rely on any information on the screen.
1A pattern essentially is a graphical shape with continuous points. This is different from a PIN-or text-based password consisting of discrete characters
105 106 107 108 109 110 111 112 113 114 115 116 117 118 119 120 121 122 123 124 125 126 127 128 129 130 131 132 133 134 135 136 137 138 139 140 141 142 143 144 145 146 147 148 149 150 151 152 153 154 155 156
Approach.To infer the user’s locking pattern, the attack uses a computer vision algorithm to track the fingertip
motions from the video. Using the geometry information extracted from the fingertip motions, it then maps the tracked fingertip locations to a small number of candidate patterns to be tested on the target device. We show that an adversary can employ a set of empirical heuristics and algorithms developed in other domains to overcome a range of practical issues to successfully launch the attack. This set of issues include how to translate the video footage from the camera’s perspective to the user’s, how to identify the start and the end of pattern drawing, how to rank candidate patterns, etc.
Results.We thoroughly evaluate our approach on a large number of locking patterns, including 120 unique patterns
collected from independent users. The experiment results show that our approach is highly accurate in inferring candidate patterns and as a result, an attacker can unlock the target device with a success rate of over 95% (up to 97.5%) in five attempts. We demonstrate that, in contrast to many people’s belief, complex locking pattern is less secure than a simpler one under our attacking methodology. We also show that the algorithms and analysis developed in this attack can be used to target PIN-based passwords with a high success rate. As a countermeasure, we propose to change the way how a locking pattern is formed and used. We show that by adding some randomness to pattern drawing, our countermeasure can significantly increase the difficulties for launching the video-based attacks.
Contributions.The key contribution of this article are summarized as follows.
— This is the first work to exploit the video side-channel to automatically reconstruct Android pattern lock using computer vision algorithms. (Section4).
— We identifya new vulnerability. In our attacking scenario, filming can be carried out at a distance of two meters away from the user and the camera does not need to directly face the target device (Section3). Such a camera setting makes our attack less likely to raise suspicion, but is more likely to succeed when compared to direct observation, e.g. shoulder surfing.
— We discovera counter-intuitive finding. The experimental results suggest that complex patterns are more vulnerable under video-based attacks (Section7.1). This finding debunks many people’s conception that more complex patterns lead to stronger protection. Therefore, this work sheds new insights on the practical use of pattern lock.
— We presenta new countermeasure. We show that by making some small modifications to how the pattern lock is formed, a simple yet effective countermeasure can be proposed to significantly reduce the risk of the presented attack.
2 ANDROID PATTERN LOCK
Pattern lock is a popular authentication mechanism for Android touch-screen devices such as mobile phones, smart watches and tablets. Many users prefer to use pattern lock because they are easier to be recalled over alphanumeric characters [Standing et al. 1970;Weiss and De Luca 2008]. To unlock a device protected with pattern lock, the user is asked to draw a predefined sequence of connected dots on a pattern grid2(see Figure2e).
There are several rules for creating an Android pattern: (1) a pattern must consist of at least four dots; (2) each dot can only be visited once; and (3) a previously unvisited dot will become visited if it is part of a horizontal, vertical or diagonal line segment of the pattern. Considering these constraints, the total number of patterns on a 3×3 grid is 389,112 [Uellenbeck et al. 2013]. Given the large number of possible patterns, performing brute-force attacks is
2In this article we use the Android default pattern grid with3×3 dots, unless otherwise stated.
157 158 159 160 161 162 163 164 165 166 167 168 169 170 171 172 173 174 175 176 177 178 179 180 181 182 183 184 185 186 187 188 189 190 191 192 193 194 195 196 197 198 199 200 201 202 203 204 205 206 207 208
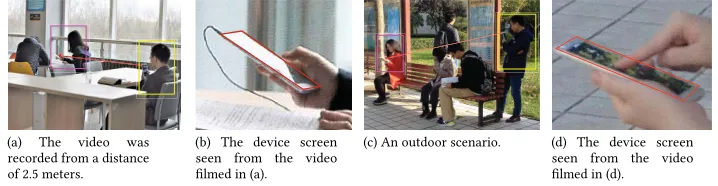
(a) The video was recorded from a distance of 2.5 meters.
(b) The device screen seen from the video filmed in (a).
[image:4.612.148.507.100.193.2](c) An outdoor scenario. (d) The device screen seen from the video filmed in (d).
Fig. 1. Examples of scenarios in which a mobile phone camera is used to film the unlocking process. In these scenarios, the camera does not need to have a clear sight of the screen.
ineffective, especially for the patterns with complex structures [Kelley et al. 2012;Mazurek et al. 2013], because the device will be automatically locked after five failed tries. Previous works also show that a brute-force attack is likely to fail on patterns with complex structures [Kelley et al. 2012;Mazurek et al. 2013].
3 THREAT MODEL
In our threat model, we assume an adversary wants to access some sensitive information from or to install malware on a target device that is protected by pattern lock. This type of attack is mostly likely to be performed by an attacker who can physically access to the target device for a short period of time (e.g. via attending a meeting or a party where the user is present). To quickly gain access to the device, the attacker would like to obtain the user’s locking pattern in advance.
The attack starts from filming how the user unlocks the device. Video recording can be done on-site or ahead of time. Because filming can be carried out from a distance of as far as 2 meters using a mobile phone camera (or about 9 meters using a DSLR camera) and the camera does not need to directly face the target device, this activity often will not be noticed by the user. Moreover, given that many users use the same pattern across devices and applications, the pattern obtained from one device may also be used to break the user’s other devices.
Examples of Attacking Scenarios. Figure1illustrates two day-to-day scenarios where filming can be performed
without raising suspicion to many users. The filming camera had a left- or right-front view angle from the target device indoor or outdoor and did not directly face the screen of the target device. Due to the filming distance (2-3 meters), the recoded video typically does not have a clear vision of the content displayed on the screen as shown in Figure1.
Assumptions. Our attack requires the video footage to have a vision of the user’s fingertip that was involved in
pattern drawing as well as part of the device. We believe this is a reasonable assumption because in practice many users often do not fully cover their fingers and the entire device when drawing a pattern. This is particularly true when holding a large-screen device by hands. To launch the attack, the attacker needs to know the layout of the grid, e.g. whether it is a 3×3 or a 6×6 grid. This can be simply decided by seeing target device.
4 OVERVIEW OF OUR ATTACKING SYSTEM
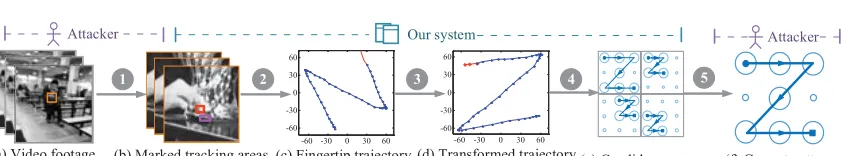
In this section, we give an overview of our attacking system which analyzes the user’s fingertip movement to infer the locking pattern3. The system takes in a video segment that records the entire unlocking process. It produces a small number of candidate patterns to be tested on the target device. Figure2depicts the five key steps of our attack:
3A simple variant method of the system can also break PIN-based passwords. This is demonstrated in Section7.9
209 210 211 212 213 214 215 216 217 218 219 220 221 222 223 224 225 226 227 228 229 230 231 232 233 234 235 236 237 238 239 240 241 242 243 244 245 246 247 248 249 250 251 252 253 254 255 256 257 258 259 260
-60 -30 0 30 60
-60 -30 0 30 60
-60 -30 0 30 60
-60 -30 0 30 60
(a) Video footage
1 2
(b) Marked tracking areas (c) Fingertip trajectory (camera’s perspective)
3
(d) Transformed trajectory (user’s perspective)
4
(e) Candidate patterns
5
(f) Correct pattern
[image:5.612.80.503.85.163.2]Attacker Our system Attacker
Fig. 2. Overview of the attack. Our system takes in a video segment that records the unlocking process (a). The adversary first marks two areas of interest on the first video frame (b): one contains the fingertip involved in pattern drawing, and the other contains part of the device. Our system then tries to track the fingertip’s location w.r.t. to the device. The tracking algorithm produces a fingertip movement trajectory from the camera’s perspective (c) which is then transformed to the user’s perspective (d). Finally, the resulted trajectory in (d) is mapped to several candidate patterns (e) to be tested on the target device (f).
1 Video Filming and Preprocessing:The attack begins from filming how the pattern is drawn. This can be done
at a distance of 2 – 3 meters away from the user using a mobile phone rear camera. After recording, our system can automatically cut out a video segment that contains the entire unlocking process (Section5.1). The attacker then need to mark two areas of interest from a video frame: one area consists of the fingertip used to draw the pattern, and the other consists of part of the device (see Figure2(b)).
2 Track Fingertip Locations:Once the areas of interest are highlighted, a computer vision algorithm will be applied
to locate the fingertip from each video frame (Section5.2.2). The algorithm aggregates the successfully tracked fingertip locations to produce a fingertip movement trajectory. This is illustrated in Figure2(c). Keep in mind that at this stage the tracked trajectory is presented from the camera’s perspective.
3 Filming Angle Transformation:This step transforms the tracked fingertip locations from the camera’s perspective
to the user’s. We use an edge detection algorithm to automatically calculate the filming angle which is then used to perform the transformation (Section5.3). For example, Figure2(c) will be transformed to Figure2(d) to obtain a fingertip movement trajectory from the user’s perspective.
4 Identify and Rank Candidate Patterns:In this step, our software automatically maps the tracked fingertip
movement trajectory to a number of candidate patterns (Section5.4). We rank the candidate patterns based on a heuristic described in Section5.4.2. For instance, the fingertip movement trajectory in Figure2(d) could be mapped to a number of candidate patterns shown in Figure10. We show that our approach can reject most patterns to leave no more than five candidate patterns to be tried out on the target device.
5 Light Weight Trials:In this final step, the attacker tries the candidate patterns one by one on the target device.
5 IMPLEMENTATION DETAILS
5.1 Video preprocessing
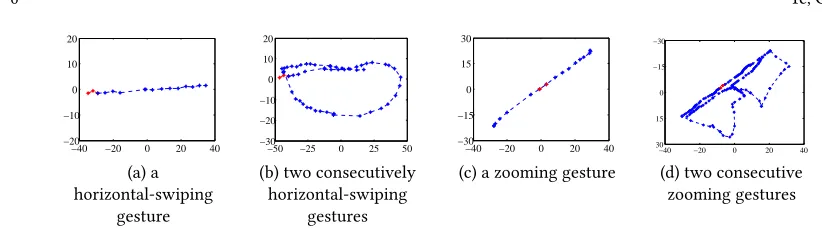
This step aims to identify the unlocking process from the video footage. While all our participants (see Section6.1) consider this as a straightforward manual task, we developed asimple yet effectiveheuristic to automatically detect the video segment in some typical scenarios. Our heuristic is based on the following observations: (1) before or after unlocking, users often pause for a few seconds; (2) two consecutive on-screen operations (e.g. swiping, zooming etc.) typically expose some spatial-temporal motion characteristics.
In our initial test, we find that there exists at least 1.5 seconds pause before or after pattern drawing due to delay of the user or the device. We also found that identical on-screen activities often follow closely. These consecutive on-screen
261 262 263 264 265 266 267 268 269 270 271 272 273 274 275 276 277 278 279 280 281 282 283 284 285 286 287 288 289 290 291 292 293 294 295 296 297 298 299 300 301 302 303 304 305 306 307 308 309 310 311 312
−40 −20 0 20 40
−20 −10 0 10 20
(a) a horizontal-swiping
gesture
−50 −25 0 25 50
−30 −20 −10 0 10 20
(b) two consecutively horizontal-swiping
gestures
−40 −20 0 20 40
−30 −15 0 15 30
(c) a zooming gesture
−40 −20 0 20 40
30 15 0 −15 −30
[image:6.612.105.516.76.194.2](d) two consecutive zooming gestures
Fig. 3. Spatial-temporal characteristics for performing an on-screen gesture once (a, c) and twice (b, d).
Algorithm 1:Unlocking process identification heuristic
Input:
IV: Video footage
f r ameCount: Pause threshold before or after unlocking Output:
<start,end>: Start and end of the unlocking video segment
1: f r ames[]←дetV ideoF r ames(IV)
2: LEN←дet F r amesLen(f r ames[])
3: fori=1 :LEN−f r ameCountdo
4: sL←has F inдer tipChanдed(f r ames[i:i+f r ameCount])
5: if!sLthen
6: s N o=i+f r ameCount 7: forj=s N o:LENdo
8: ifcheckLoop(f r ames[j:LEN])then
9: e N o=i
10: break;
11: else if!has F inдer tipChanдed(f r ames[j:j+f r ameCount])then
12: e N o=i
13: break;
14: end if
15: end for
16: break;
17: end if 18: end for
19: <star t,end>←дetT arдetV ideo(f r ames[],s N o,e N o)
operations have some spatial-temporal motion characteristics that are different from pattern drawing. Figure3shows the spatial-temporal motion structure for two gestures, swiping and zooming, when they are performed once (a, c) and twice (b, d). This diagram indicates that the spatial-temporal motion of two identical on-sreen activities contains one or more looping structures for which pattern drawing does not have.
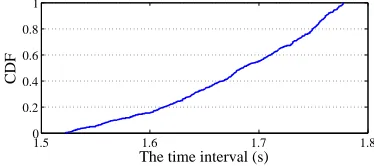
Our heuristic for identifying the pattern drawing process is described in Algorithm1. The input to the algorithm is a video capturing the unlocking process, and the output of the algorithm is a time-stamp tuple,<start, end>, which marks the start and the end of a video segment. To locate the video segment, we first filter out on-screen activities where the fingertip location does not change within a timeframe of 1.5 seconds (lines 4 and 11). This allows us to exclude some basic on-screen activities such as clicking. Figure4shows that all our participants paused at least 1.5 seconds before or after pattern drawing due to delay of the user or the device. We use the number of video frames,
frameCount, as a proxy to estimate the time interval between two on-screen operations. Here, a time interval of 1.5s
313 314 315 316 317 318 319 320 321 322 323 324 325 326 327 328 329 330 331 332 333 334 335 336 337 338 339 340 341 342 343 344 345 346 347 348 349 350 351 352 353 354 355 356 357 358 359 360 361 362 363 364
1.5 1.6 1.7 1.8
0 0.2 0.4 0.6 0.8 1
The time interval (s)
[image:7.612.192.379.98.181.2]CDF
Fig. 4. The cumulative distribution function (CDF) of the time interval between pattern drawing and other on-screen activities.
translates to 45 frames or 90 frames when the video was shot at 30 or 60 frames per second (FPS) respectively. We also use the spatial-temporal characteristics described above to exclude two consecutive swiping or zooming gestures (line 8). Finally, we exploit the observation that users typically paused at least 1.5s before or after unlocking to locate the start and end points of pattern drawing (line 19).
Limitations. Our heuristic is not perfect. It is likely to fail if the user was typing using a Swype-like method (i.e.
entering words by sliding a finger from the first letter of a word to its last letter) during video recording. In this case, our method will identify multiple video segments of which one may contain the pattern unlock process. If multiple segments are detected, the algorithm will ask the user to confirm which video segment to use. In this scenario, the first identified segment is likely to be the correct one. In practice, an experienced attacker would wait patiently to avoid this complicated situation by finding the right time for filming (e.g. for a screen lock, the time is just after the device is retrieved). The attacker could also watch the video to manually cut it to ensure to obtain the correct video segment.
5.2 Track fingertip locations
After cutting out the video segment of pattern drawing, we need to track the finger motions from the video segment. We achieve this by employing a video tracking algorithm calledTracking-Learning-Detection (TLD)[Kalal et al. 2011]. This algorithm automatically detects objects defined by a boundary box. In our case, the objects to be tracked are the user’s fingertip and an area of the device. These are supplied to the algorithm by simply highlighting two areas on the first frame of the video segment (see Figure2b). The algorithm tries to localize the fingertip from each video frame and aggregates the successfully tracked locations to produce a fingertip movement trajectory as an output (see Figure2c).
5.2.1 Generate The Fingertip Movement Trajectory.The TLD algorithm [Kalal et al. 2011] automatically detects objects based on the examples seen from the first frame. For each tracked object, the algorithm generates a confidence between 0 and 1. A tracking is considered to be successful if the confidence is greater than a threshold. We set this threshold to 0.5 which is found to give good performance in our initial design experiments using 20 patterns4. TLD has three modules: (1) a tracker that follows objects across consecutive frames under the assumption that the frame-to-frame motion is limited and objects are visible; (2) a detector to fully scan each individual frame to localize all appearances of the objects; and (3) a learner that estimates errors of the detector and updates the detector to avoid these errors in future frames.
In some specific cases, the algorithm may fail to detect the objects in many video frames due to poor selections of interesting areas. If this happens, our system will ask the user to re-select the areas to track. We have also extended TLD to report when a fingertip position is seen on the footage. This temporal information is recorded as the number of
4To provide a fair evaluation, the patterns used in our initial test runs in the design phase are different from the ones used later in evaluation.
365 366 367 368 369 370 371 372 373 374 375 376 377 378 379 380 381 382 383 384 385 386 387 388 389 390 391 392 393 394 395 396 397 398 399 400 401 402 403 404 405 406 407 408 409 410 411 412 413 414 415 416
x=265.00 y=364.00 x=156.00 y=454.00 ∆x=109.00 ∆y= -90.00
(a) The first video frame
x=275.62 y=324.86 x=156.22 y=456.98 ∆x= -119.40 ∆y=132.12
(b) A middle video frame
x=310.70 y=278.00 x=157.40 y=437.94 ∆x= -153.30 ∆y=159.94
(c) The last video frame
-60 -30 0 30 60 -60
-30 0 30 60
[image:8.612.114.526.99.175.2](d) Fingertip trajectory
Fig. 5. Tracking the fingertip movement trajectory. For each video frame, the system tracks two areas: one surrounds the fingertip and the other covers the edge of the device. The fingertip position is determined by computing the relative coordinates of the central points of the two areas. The red points highlighted in the final results (d) are the touching points tracked from the three video frames.
video frames seen with respect to the first frame of the video segment. This is used to separate two possibly overlapping line segments described in Section5.4.
5.2.2 Camera Shake Calibration.By default, the TLD algorithm reports the position of a tracked object with respect to the top-left pixel of the video frame. However, videos recorded by a hand-held device are not always perfectly steady due to camera shake. As a result, the top-left pixel of a video frame may appear in a different location in later frames. This can drastically affect the precision of fingertip localization, leading to misidentification of patterns.
Our approach to cancel camera shake is to record the fingertip location with respect to a fixed point of the target device. To do so, we track two areas from each video frame. One area is an edge of the device and the other is the fingertip. Both areas are highlighted on the first frame by the user. The location of a successfully tracked fingertip is reported as the relative coordinates of the two center points of the marked areas. This approach can also be used to calibrate the minor motions of the target device during pattern drawing.
Example:To illustrate how our camera-shake calibration method works, consider Figure5where two areas are firstly
marked by two bounding boxes in subfigure (a). Both areas will then be automatically detected by the TLD algorithm in following video frames as shown in subfigures (b) and (c). The coordinates of the two center points of each box are the values ofxandy, and their relative positions are represented by△X and△Y. For each frame where both areas are successfully tracked, we compute the relative coordinates, (△X,△Y), which are reported as the location of the tracked fingertip.
5.3 Filming angle transformation
In practice, the filming camera will not directly face the target device to avoid raising suspicion by the target user. As a result, the fingertip movement trajectory generated by the tracking algorithm will look different than the actual pattern. For example, for the pattern presented in Figure2(a), if the video is filmed from the attacker’s front-left to the target device (i.e. with a filming angle of approximate 45 degrees), we get the trajectory shown in Figure2(c). Using this trajectory without any postprocessing will lead to misidentification of candidate patterns. Therefore, we must transform the resulting trajectory to the user’s view point. To do so, we need to estimate the angle between the filming camera and the target device. Our approach is described as follows.
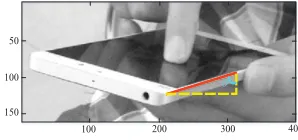
We use an edge detection algorithm called Line Segment Detector (LSD) [Grompone et al. 2010] to detect the longer edge of the device. The filming angle is the angle between the detected edge line and a vertical line. This is illustrated in Figure6. In Section7.5, we show that a minor estimation error of the filming angle has little impact on the attacking success rate. By default, we assume that the pattern grid is presented in the portrait mode5. If this is not the case, i.e.
5The pattern grid of the Android native pattern lock is always presented in the portrait mode regardless of the orientation of the device.
417 418 419 420 421 422 423 424 425 426 427 428 429 430 431 432 433 434 435 436 437 438 439 440 441 442 443 444 445 446 447 448 449 450 451 452 453 454 455 456 457 458 459 460 461 462 463 464 465 466 467 468
100 200 300 400
150 100 50
[image:9.612.211.360.97.167.2]T
Fig. 6. Filming angle calculation. The filming angle,θ, is the angle between the edge line of the device and a vertical line.
the pattern grid is shown in the landscape mode, we need to use the shorter edge of the device to calculate the filming angle. We believe that an attacker interested in a particular target device would have some knowledge of how the pattern grid is presented under different orientation modes and be able to identify the device orientation by watching the video. There are also other methods to be used to identify the filming angle [Torralba and Oliva 2002].
Based on the estimated filming angle,θ, we use the following formula to transform the tracked fingertip movement trajectory from the camera’s view point to the user’s:
S=TS′ , T =
cosθ −sinθ sinθ cosθ
(1)
whereT is a Transformation Matrix,S′is the coordinate of a point of the tracked trajectory, andSis the resulting coordinate after the transformation. For each video frame, our algorithm individually calculates the filming angle and perform the transformation, because the filming angle may change across video frames.
5.4 Identify and rank candidate patterns
In this step, the fingertip movement trajectory will be mapped to a number of candidate patterns to be tested on the target device. Our goal in this step is to exclude as many patterns as possible and only leave the most-likely patterns to be tried out on the target device. Our approach is to use the geometry information of the fingertip movement trajectory, i.e. the length and direction of line segments and the number of turning points, to reject patterns that do not satisfy certain criteria. In this section, we first describe how to identify overlapping line segments and extract length and direction information before presenting how to use the extracted information to identify and rank candidate patterns.
5.4.1 Extracting Structure Information.A pattern can be defined as a collection of line segments where each line segment has two properties: the length of the line,l, and the direction of the line,d. We define a pattern,P, as a collection of line segment prosperities,P={L,D}. HereL={l1,l2,· · ·,ln}is a collection of the lengths of all line segments (that are numbered from 1 ton) of the pattern, andD={d1,d2,· · ·,dn}is the collection of directions for all line segments in L. We extract the length and the direction of each line segment from the tracked fingertip movement trajectory and store them into arraysL[] andD[] respectively.
Identify Line Segments.The first step of geometry information extraction is to identify individual line segments from
469 470 471 472 473 474 475 476 477 478 479 480 481 482 483 484 485 486 487 488 489 490 491 492 493 494 495 496 497 498 499 500 501 502 503 504 505 506 507 508 509 510 511 512 513 514 515 516 517 518 519 520
-100 -50 0 50 100 -100
-50 0 50 100
A
B C
D S
E
(a) tracked fingertips
6 $
% &
' (
(b) pattern example
Fig. 7. The tracked fingertip movement trajectory (a) of a pattern (b).
-100 -50 0 50 100
-40 -20 0 20 40
Line 1 Line 2 Line 3 timeframes
(a) overlapping lines
90 100 110
24 25 26
Line 1 Line 2
1 8
111013
9 12
8 8 8
8 8 8
8 8 8 8 8
1
1
1 1
1110013
9 12 14
(b) zoom-in view
Fig. 8. Separating two overlapping line segments.
Table 1. Mappings from line slopes and fingertip-horizontal movements to direction numbers
Direction No. 1 2 3 4 5 6 7 8
slope (L→R) +∞ 2 1 21 0 −12 −1 −2
Direction No. 9 10 11 12 13 14 15 16
slope (R→L) −∞ 2 1 12 0 −1
2 −1 −2
overcome this problem by using the temporal information (that is recorded by the tracking algorithm) to separate two overlapping points.
Example:As an example, consider a fingertip movement trajectory shown in Figure8(a). The red rectangle on the
figure is a timeframe consisting of 20 tracked points. If we zoom in on the timeframe, we get Figure8(b) where a point is labelled with a frame number according to when the point was seen, starting from 1 for the earliest point. In this example, there are more than 6 overlapping points in the timeframe, which are marked by a green circle. We use the center point (No.10) of the overlapping points as the turning point to separate the two line segments.
Extract the Line Length. The physical length of a line segment depends on the sizes of the screen and the pattern
grid, and the space between two touch dots. To ensure our approach is independent of the device, we normalize the physical length of a line segment to the shortest line found on the tracked trajectory. For the example as shown in Figure7(a), the line lengths for segments, SA, AB, BC, CD, and DE, are 2ls,ls,2ls,l,2ls, respectively. Here segments AB and CD have the shortest length,ls. The physical length of a line segment is calculated by computing the Euclidean distance between the start and the end points of a segment.
Extract Direction Information. In addition to the line length, we also want to know to which direction the finger
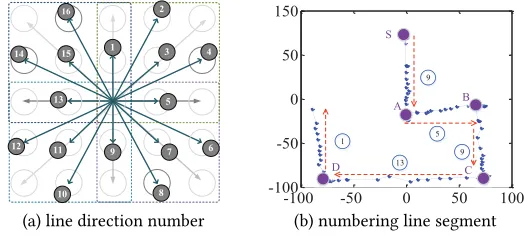
moves. This information is useful for inferring which dots are selected to unlock the pattern. Figure9(a) shows all possible 16 directions on a 3×3 pattern grid. The directions are numbered from 1 to 16 in clockwise. For each line segment of the tracked trajectory, we calculate its line slope and the horizontal movement of the finger (i.e. left→right or vice versa). This information will then be checked against Table1to determine the direction number of the line segment. The horizontal movement of the fingertip is determined by first using the temporal information to find out the start and the end points of the line and then comparing the horizontal coordinates of the two points. The line slope is also computed based on the coordinates of the start and the end points of the line segment. Figure9(b) gives the direction number of each tracked line segment of a fingertip movement trajectory.
521 522 523 524 525 526 527 528 529 530 531 532 533 534 535 536 537 538 539 540 541 542 543 544 545 546 547 548 549 550 551 552 553 554 555 556 557 558 559 560 561 562 563 564 565 566 567 568 569 570 571 572
16
1
14 3 4
5
6 7
8 11
13 15
12
2
10 9
(a) line direction number
-100 -50 0 50 100
-100 -50 0 50 150
9
5
13 1
9
S
A B
C D
[image:11.612.155.418.100.218.2](b) numbering line segment
Fig. 9. All possible line directions (a) and an example trajectory (b).
5.4.2 Map the Tracked Trajectory to Candidate Patterns. In this step, we use the extracted geometry information to map the fingertip movement trajectory to a small number of candidate patterns which will then be ranked using a heuristic.
Identify Candidate Patterns. Our implementation simply enumerates all possible patterns for a given pattern grid to
identify candidate patterns, starting from the top-left touch point. We reject patterns that do not meet the requirements that the correct pattern is expected to have. The requirements are the number of line segments (this is checked by counting the number of turning points), and the length and the direction for each line segment. This is anautomatic
process performed by our software system without any user involvement. We consider two line segments having the same length and slope if the difference between them is less than a threshold. Specifically, the relative length threshold,lenдthTh, is set to 1.12 and the slope threshold,directionTh, is set to 0.25. To determine the thresholds, we have evaluated a range of possible settings using 30 patterns in our initial design experiments6. We found that our chosen thresholds lead to good performance – our attack only fails on 1 out of the 30 patterns due to blur motions of the video footage.
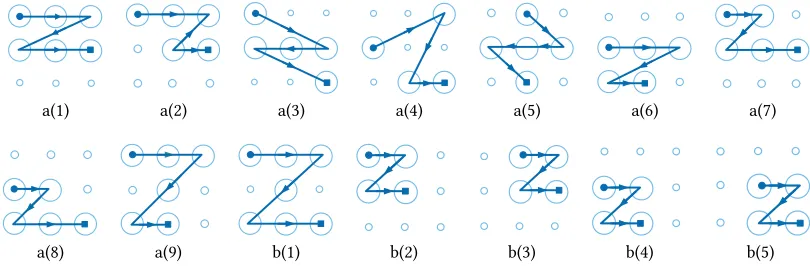
Example: We use the pattern depicted in Figure2as an example to describe our algorithm. Figure10gives several
possible mappings for the fingertip movement trajectory shown in Figure2(d). For this particular trajectory, the collections of lengths and directions areL={l,√2l,l}andD={5,11,5}respectively. Any pattern that does not meetL orDshould not be considered as a candidate pattern for this trajectory. For this reason, Figure10a(1)–a(9) will be rejected. Take Figure10a(1) as an example, the line lengths and directions for all four line segments of this pattern are {l,
√ 5
2l,l}and{5,12,5}respectively.
Rank Patterns.Candidates patterns are then ranked using a simple heuristic. The heuristic assumes a pattern starting
from a left dot of the grid is more likely to be the correct pattern over a pattern starting from a right dot. This assumption is supported by recent studies which show that people tend to select a left dot as the starting point to construct a pattern [Løge 2015;Uellenbeck et al. 2013]. If two candidate patterns start from the same dot, we consider the pattern with a longer total line length is more likely to be the correct pattern. We also considered other additional ranking heuristics by giving a higher priority to patterns that starts from a left dot and has a longer line or starting from the median dot and has shorter line. In total, we considered five ranking heuristics that give a higher priority to patterns
6In most cases, our participants start from the center of the dots when drawing a pattern.
573 574 575 576 577 578 579 580 581 582 583 584 585 586 587 588 589 590 591 592 593 594 595 596 597 598 599 600 601 602 603 604 605 606 607 608 609 610 611 612 613 614 615 616 617 618 619 620 621 622 623 624
a(1) a(2) a(3) a(4) a(5) a(6) a(7)
[image:12.612.120.525.99.232.2]a(8) a(9) b(1) b(2) b(3) b(4) b(5)
Fig. 10. Possible mappings for the trajectory presented in Figure2(d).
of different starting dots and line lengths. Different ranking heuristics would rank the candidate patterns in different order; and we found that our chosen heuristic can lead to a successful attack using the least number of attempts on our test data. We stress that since our attack generates no more than five candidates on a 3×3 grid, the order of which candidate patterns to be tested first has negligible impact on the success rate. This is because the Android system by default allows more than five fail attempts and an attacker can test all the five patterns in a short period of time.
6 EXPERIMENTAL SETUP
6.1 Data Collection
The patterns used in our evaluation were collected from users who use at least one Android device (a smartphone or a tablet) on a daily basis. Our participants include 95 females and 120 males who were undergraduate or postgraduate students in our institution. The majority of our participants are in an age group of under 30.
To collect the patterns, we have conducted a “pen-and-paper" survey by asking participants to fill in an anonymized questionnaire. The questionnaire and survey were approved by the research ethics board (REB) of the host institution. We have made sure that our survey complied with strict privacy regulations. For example, we did not collect any personally identifiable information other than the gender and age group of the participant. Our participants were well informed on the purpose of the study and how the data will be managed and used. The survey forms were distributed as voluntary homework so that the participants can take the survey form away to fill in. Users were invited to return the survey form anonymously within three weeks to a dedicated, locked mailbox, if they wish to participate in the study. To avoid a user submits multiple copies of the same form, each survey form is given a unique, randomly generated 32-digital number.
We have distributed over 1,000 survey forms to be taken to fill at home, for which 220 forms have been returned. The return rate of our questionnaires is in line with the standard survey return rate of 20% [Fox et al. 1988]. By excluding 5 incomplete forms, we have obtained 215 valid forms. These result in 120 unique patterns7.
Overall, 37.6% of our participants confirmed that they use pattern lock as the screen lock to protect their Android devices on a daily basis; and 33% of those who do not use a pattern as their screen lock said that they are often required to use a pattern for authentication by an application likeAlipay. Furthermore, 60% of our participants also indicated that the pattern they provided is currently being used or have been used in the past by themselves. Other participants (often those did not use a locking pattern on a daily basis) indicated that they have provided a pattern which they
7Available to be downloaded from:https://dx.doi.org/10.17635/lancaster/researchdata/113
625 626 627 628 629 630 631 632 633 634 635 636 637 638 639 640 641 642 643 644 645 646 647 648 649 650 651 652 653 654 655 656 657 658 659 660 661 662 663 664 665 666 667 668 669 670 671 672 673 674 675 676
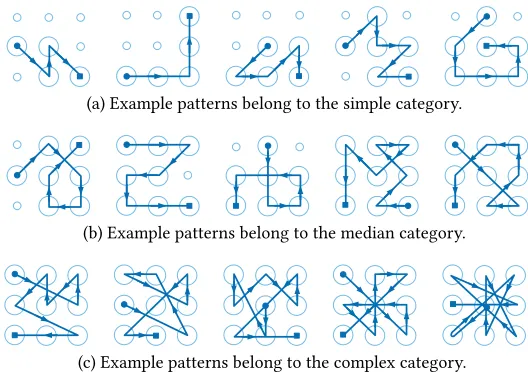
(a) Example patterns belong to the simple category.
(b) Example patterns belong to the median category.
[image:13.612.151.415.98.284.2](c) Example patterns belong to the complex category.
Fig. 11. Examples of patterns collected from our participants. Patterns are grouped intosimple,medianandcomplexcategories,
according to their complexity scores.
would like to use if a locking pattern is required. While we cannot guarantee that the self-reported patterns are actually used, most of participants confirm that the supplied patterns are the ones that have been used in the past, are currently being used, or somethings they would like to use for sensitive applications. Based on this information, we are confident that the patterns we collected represent some of the real world patterns. Finally, all participants believe that a complex pattern provides stronger protection than a simple counterpart.
6.2 Pattern Complexity Classification
We quantify the complexity of a pattern using the complexity (strength) score proposed in [Sun et al. 2014]. The complexity score,CSP, of a pattern,P, is defined as:
CSP =SP×log2(LP+IP+OP) (2)
whereSP is the number of connected dots,LP is the total length of all line segments that form the pattern,IP is the number of intersections (which are also termed as "knight moves" in some prior work [Von Zezschwitz et al. 2015]) andOPis the number of overlapping linear segments. To calculate the line length, we assume the length between two horizontally or vertically adjunct dots is one. Thus, our method is independent of the size of the screen and the grid.
Intuitively, the more connected dots (SP), line segments (LP), intersections (IP) and overlapping line segments (OP) that a pattern has, the more complex it is. There are other methods to quantify the complexity score of pattern locks, including the methods proposed by Songet al.[Song et al. 2015] and Andriotiset al.[Andriotis et al. 2014]. These methods in general suggest that patterns with more connected dots and intersections are considered to provide stronger security strengths [Aviv and Susanna 2016].
Pattern Grouping. Based the complexity score, we divide the collected patterns into three complexity categories:
simple,medianandcomplex. A simple pattern has a score of less than 19, a median complex pattern has a score between
677 678 679 680 681 682 683 684 685 686 687 688 689 690 691 692 693 694 695 696 697 698 699 700 701 702 703 704 705 706 707 708 709 710 711 712 713 714 715 716 717 718 719 720 721 722 723 724 725 726 727 728
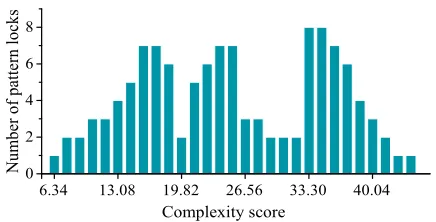
6.34 13.08 19.82 26.56 33.30 40.04 0
2 4 6 8
N
um
ber
of
pattern
locks
[image:14.612.215.433.92.203.2]Complexity score
Fig. 12. The distribution of complexity scores for the collected patterns.
Table 2. Screen sizes for the test phones
Screen size MI4 Honor7 Note4
Height(cm)×Width(cm) 13.9×6.9 14.3×7.2 15.4×7.9
according to their complexity scores. Based on this definition, the complexity scores of the patterns we collected range from 6.4 to 46.8.
6.3 Video Recording and Preprocessing
Recording Devices.We used three smartphones for video recording: an Apple iPhone4S, a Xiaomi MI4 and a Meizu2.
Each mobile phone was used to record 40 patterns with a 1080p HD resolution of 30 FPS under different settings described as follows.
Video Recording Setup. By default, we used the Android 3×3 native pattern grid, but we evaluated our approach
using other pattern grids with different sizes in Section7.6. We recorded each pattern under three filming angles, 45, 90 and 135 degrees, by placing the camera on the left-front, front, and right-front of the target device respectively. By default, videos were recorded at a distance of 2 meters from the target device and we evaluated the impact of the filming distance in Section7.2.
Recording Participators.We recruited ten postgraduate students (five male and five female students) from Northwest
University to reproduce the 120 patterns and the 60 most complex patterns (see Section7.1) on three target mobile phones: a Xiaomi MI4, a Huawei Honor7 and a Samsung Note4. Table2lists the screen size for each target mobile phone.
Video Filming and Pattern Drawing. Before recording, our participants were given the opportunity to practice a
pattern several times (on average, 10 trials), so that they can draw the pattern at their natural speed. In the experiments, our participants could use any of their fingers for drawing, and they could use more than one finger for drawing. Most of our participants used their index fingers for drawing, one user used his middle finger and one used index and middle fingers for drawing. When drawing the pattern, some participants sat, while others stood, some hold the device by hands, while others placed it on a table. Each pattern was drawn on three target devices and recorded under three filming angles. Thus, for the 120 patterns collected from users, we recorded 1,080 videos in total.
729 730 731 732 733 734 735 736 737 738 739 740 741 742 743 744 745 746 747 748 749 750 751 752 753 754 755 756 757 758 759 760 761 762 763 764 765 766 767 768 769 770 771 772 773 774 775 776 777 778 779 780
have also asked our participants to draw five locking patterns used by five different users, and compared the drawing speedup after 10 trails against the drawing speed of the pattern owners. We found that 10 trails are sufficient to achieve a similar drawing speed.
Video Preprocessing. For each video stream, we used the algorithm described in Section5.1to cut out the video
segment of the unlocking process. We left around 200 to 300 milliseconds of the video segment before and after the pattern unlocking process. To track the fingertip locations, we used Windows Movie Make to highlight two areas of interest on the first frame of the video segment: one area surrounds the fingertip, and the other contains an edge of the phone (see Section5.2.2).
Experimental Tools and Platform.Our prototyped attacking system built upon a TLD library [Kalal [n. d.]]. The
developed software ran on an Intel Core i5 PC with 8GB RAM. The operating system is Windows 10. Our implementation can be ported onto Android or Apple iOS systems, which is our future work. On our evaluation platform, our software takes less than 30 seconds to process a video to produce candidate patterns.
7 EXPERIMENTAL RESULTS
In this section, we first present the overall success rate for cracking the 120 patterns collected from our participants plus the top 60 most complex patterns on a 3×3 pattern grid. We then analyze how the success rate is affected by various filming conditions: the filming distance and angle, the camera shake effect, lighting, the screen size of the mobile device, and the filming cameras. Next, we conduct a limited study to understand how our attack performs when the video only captures the user’s fingertip. Finally, we demonstrate that our video-based attack can also be used to crack PIN-based passwords.
7.1 Overall Success Rate
Result 1:We can successfully crack over 95% of the patterns in five attempts and complex patterns are less secure compared
to simple patterns under our attack.
In this experiment, videos were recorded from a distance of 2 meters away from the target device. This mimics a scenario where the adversary sits at the next table to the user in a public space (e.g. a restaurant). The smartphones used for filming in this experiment were hand-held.
7.1.1 Evaluation using collected user patterns.Figure13shows the success rate for cracking different types of patterns within 1, 2, 3, 4 and 5 attempts. We used the 120 patterns that have been collected through our user studies in this experiment. For all the patterns used in this evaluation, our approach does not generate more than five candidate patterns. For complex patterns, we are able to crack all except one (with a 97.5% success rate)in the first attempt. For simple and median patterns, the success rate increases with more tries. Using five attempts, we are able to crack all simple patterns and all but one median patterns. The reason that we failed on one median and one complex patterns is because of some blur motions of the video footage (probably caused by the video compressing algorithm), which leads to many tracking failures. But we are able to crack the same pattern using a video filmed by a different device. It is important to note that the native Android system allows up to five failed tries before locking the device [Egelman et al. 2014]. This means, in practice, our approach is able to successfully crack most locking patterns.
781 782 783 784 785 786 787 788 789 790 791 792 793 794 795 796 797 798 799 800 801 802 803 804 805 806 807 808 809 810 811 812 813 814 815 816 817 818 819 820 821 822 823 824 825 826 827 828 829 830 831 832
S i m p l e M e d i a n C o m p l e x 0 %
2 0 % 4 0 % 6 0 % 8 0 % 1 0 0 %
C
ra
ck
in
g
su
cc
es
s
ra
te
T h e c o m p l e x i t y o f p a t t e r n l o c k s
1 a t t e m p t
2 a t t e m p t s
3 a t t e m p t s
4 a t t e m p t s
[image:16.612.331.506.97.185.2]5 a t t e m p t s
Fig. 13. For each pattern category, the figure shows the success rate using no more than 1, 2, 3, 4 and 5 attempts.
1 2 3 4 5
0 10 20 30 40
Num
b
er
of
patter
n
s
Number of candidate patterns
Simple Median Complex
Fig. 14. The distribution of candidate patterns for each category.
complexity score: 43.8
complexity score: 44.7
complexity score: 46.8
Fig. 15. Three most complex patterns on a3×3grid based on Equation2.
like shoulder surfing [Rogers 2007], their unique graphical structures help our algorithms to narrow the possible options down. This is confirmed by Figure14. It shows that for most median and all complex patterns, our system produces one candidate pattern – the correct one for most of our test cases.
7.1.2 Evaluation on the most complex patterns. We also evaluated our approach using the top 60 most complex patterns (according to Equation2) on a 3×3 grid. To evaluate our approach on a wide range of patterns, we exclude patterns that are simply a rotation to an already chosen pattern. Figure15illustrates three highly complex patterns which have a complexity score between 43.8 and 46.8. The three patterns use all the nine dots of the grid and have a larger number of line segments, intersections and overlapping lines when compared to simpler patterns. Because of their complex graphical structures, remembering these patterns using direct observation techniques would be difficult. In this experiment, we can crack all the complex patterns in one attempt. This result reinforces our claim that complex patterns are less secure under video-based attacks.
7.1.3 Evaluation using alternative security metric.In addition to using the complexity metric defined by Equation2, we also evaluate our attack based on how likely a pattern will be used by users. For this purpose, we use the guessing probability proposed in [Aviv and Susanna 2016]. This metric measures the pattern’s strength by considering how likely a pattern is to be guessed. The guessing probability is the likelihood estimation from the hidden Markov model trained on collected, real-world data [Uellenbeck et al. 2013]. The larger the likelihood, the more likely the pattern would have been selected by a user. We choose this metric because a similar security metric based on statistical analysis of real-world passwords haven been widely used in prior studies of text-based passwords [Bonneau 2012;Kelley et al. 2012].
833 834 835 836 837 838 839 840 841 842 843 844 845 846 847 848 849 850 851 852 853 854 855 856 857 858 859 860 861 862 863 864 865 866 867 868 869 870 871 872 873 874 875 876 877 878 879 880 881 882 883 884
High Median Low 0%
20% 40% 60% 80% 100%
Cracking
success
rate
[image:17.612.114.365.97.191.2]Likelihood of patterns to be used 1 attempts 2 attempts 3 attempts 4 attempts 5 attempts
Fig. 16. The success rate when grouping patterns
based on Equation3.
1 1.5 2 2.5 3 3.5
0% 20% 40% 60% 80% 100%
Distance (Meter)
Cracking success rate
1 attempt 2 attempts 3 attempts 4 attempts 5 attempts
Fig. 17. Impact of the filming distance.
Table 3. % of identical patterns in each category using Equations2vs3
Group simple v.s. high median v.s. median complex v.s. low
% of overlap 72.5% 67.5% 80%
(i.e. more commonly used patterns) will appear after those with a lower probability (less commonly used patterns) on the sorted list. Next, we give each pattern a numeric number (termedguessing number), starting from 1 for the first pattern of the sorted list, and we increase the number by 1 as we move down to next (more commonly used) pattern on the sorted list. We then use the following formula to calculate the frequency score,fP, of a pattern,P:
fP =log10GP (3)
whereGP is the guessing number of patternP.
Less commonly used patterns have a smaller guessing number and thus will have a lower frequency score using Equation3. With this metric in place, we divide our 120 patterns collected from our participants into three groups:low,
medianandhigh. Patterns in thehighgroup are more likely to be used by users than the patterns in thelowgroup. The
highgroup has a value of less than 4.2, themediangroup has a score between 4.2 and 5.1, and thelowgroup must have a score greater than 5.1. Using this partition strategy, each group has around 40 patterns. Table3counts the percentage of identical patterns for each group classified using Equations2and3respectively. As can be seen from the diagram, while there is a significant degree of overlap, the resulted categorizations are not identical using the two different metrics.
Figure16illustrates the cracking success rate for different categories under numbers of attempts. As can be seen from the diagram, the success rate with one attempt for the patterns in thehighgroup is 42.5%. This success rate is lower than patterns in other groups. This is because the patterns in thehighfrequently used group are typically simple and symmetry patterns, for which our tracking algorithm produces more than one candidate pattern. This is in line with our observation using the complexity metric defined in Equation2. Nonetheless, our attack can successfully crack over 90% of the pattern of each group. This confirms that the video-side channel is a real threat for the Android locking pattern.
7.2 Impact of Filming Distances
Result 2:We can crack over 80% of the patterns in five attempts, if the video was filmed using a smartphone within a
distance of 2.5 meters away from the target.
[image:17.612.226.460.101.191.2]885 886 887 888 889 890 891 892 893 894 895 896 897 898 899 900 901 902 903 904 905 906 907 908 909 910 911 912 913 914 915 916 917 918 919 920 921 922 923 924 925 926 927 928 929 930 931 932 933 934 935 936
Table 4. Tracking precision vs filming distance
Distance 1 m 2 m 3 m 3.5 m
fingertip 100% 98.7% 80.9% 68%
device edge 100% 99.4% 90.6% 69%
the filming distance increases. There are minor discrepancies in the success rate between this diagram and Figure13 because we used less patterns in this experiment. When the filming distance is less than 2 meters, our approach can crack all patterns in five attempts. The success rate drops significantly when the filming distance is greater than 2.5 meters. Beyond this point, the quality of the video filmed by a mobile phone tends to drop significantly with many object deformations. The degradation of the video quality makes it difficult for the TLD algorithm to successfully track objects across video frames. This is confirmed by Table4which shows that the tracking precision for the fingertip and the device edge drops from around 99% to 68% when the filming distance increases from 2 meters to 3.5 meters. The increased tracking failures result in an increased number of missing points on the tracked trajectory, leading to a deteriorative performance in identifying candidate patterns. Nonetheless, our approach can achieve a high success rate when the filming distance is within 2.5 meters. Such a distance allows an attacker to record the video without raising suspicions in many day-to-day scenarios.
We also evaluated our approach on videos filmed using a entry-level single-lens reflex (SLR) camera, Nikon D90, with a low-end 105mm lens. The SLR camera was placed from a distance of 9 meters away from the target device. For this set of videos, we are able to achieve the same performance when compared to using videos filmed by a mobile phone camera with a 2-meter filming distance. Therefore, in practice, an attacker can also use a professional video recording device to launch the attack from a further distance.
7.3 Impact of Camera Shake
Result 3:Our method can tolerate a certain degree of camera shake in the hand-held mode.
In this experiment, we used an IPhone4S smartphone to record how a pattern is drawn on a Huawei Honor7 phone. This experiment was carried out under three settings:fixed,hand-heldandshaky, where the filming device was respectively fixed using a tripod, hand-held, and hand-held but with constant movements of approximate 2cm in the horizontal or the vertical directions. The recording device was placed on the left-front, front, and right-front of the target device. In the experiment, we affixed the target device on a table using double-sided tapes.
We use a reference point to quantify camera shake. The point is the center position of an area of the target device. The area is marked by a boundary box on the first frame (see Figure5). We calculate the difference (in terms of pixels) for where the reference point was seen in two consecutive video frames. We then use the difference to measure the degree of camera shake. Figure18shows the cumulative distribution function (CDF) of camera shake under the three different filming settings. Here, the wider the distribution is, the less steady the filming is. The shaky mode is least stable where the difference of the reference point between two video frames can be up to 250 pixels.
Figure19shows that our approach has the same performance under the hand-held and the fixed modes. The modest camera shake under the hand-held mode has little impact on performance thanks to our camera-shake calibration method. We observe deteriorative performance under the shaky mode, but the performance degradation is modest (80% vs 97% in 5 attempts). In reality, an attacker would avoid drastic camera shake by firmly holding the video recording device.
937 938 939 940 941 942 943 944 945 946 947 948 949 950 951 952 953 954 955 956 957 958 959 960 961 962 963 964 965 966 967 968 969 970 971 972 973 974 975 976 977 978 979 980 981 982 983 984 985 986 987 988
−1500 −100 −50 0 50 100 150
0.2 0.4 0.6 0.8 1
The distance between video frames
CDF
fixed hand−held
[image:19.612.296.467.97.190.2]shaky
Fig. 18. CDF for different video recording modes.
1 2 3 4 5
0% 20% 40% 60% 80% 100%
Cracking
success
rate
The number of successful attempts
[image:19.612.105.279.104.199.2]shaky hand-held fixed
[image:19.612.134.439.248.303.2]Fig. 19. Impact of camera shake.
Table 5. Lighting Conditions
Scenarios Indoor Indoor Indoor Outdoor
Time nighttime nighttime daytime daytime
Light Source warm LED white fluorescent sunlight sunlight
Light Intensity (Lux) 55−70 70−100 150–240 500–9500
7.4 Impact of Lighting Conditions
Result 4:Low-light has a negative impact on the success rate of the attack
In this experiment, videos were recorded under different lighting conditions both indoor and outdoor. The experi-mental settings are given in Table5. For each setting, we tested all the 120 patterns on a Xiaomi MI4 phone and used an iPhone4S phone to record the video. The filming camera was placed on the left-front, front, and the right-front of the target device from a distance of 2 meters. Figure20shows that the success rate increases when video filming was performed in a brighter lighting condition as the light intensity changes from 55 lux to 9500 lux. This is expected as low-light leads to increased video noise, blurred motions and poor focus, which all have a negative impact on the TLD algorithm. Nonetheless, our attack can still crack over 70% of the patterns in a filming environment of low light. We stress that the impact of the lighting conditions are also camera-dependent where some cameras can better tolerate low-lights than others.
7.5 Impact of Filming Angle Estimation
Result 5:Our attack performs well when the error of filming angle estimation is less than 5 degrees.
Recall that our attack needs to transform the fingertip movement trajectory to the user’s perspective based on an estimation of the filming angle (Section5.3). Because our filming angle estimation algorithm gives highly accurate results, we did not find the estimation error to be an issue in our experiments. Nonetheless, it is worth studying how the estimation error affects the success rate of our attack. To do so, we deliberately added an error of 5-10 degrees to the estimation in this experiment.
Figure21shows the results of this experiment. When the error is less than±5 degrees, there is little impact on
complexpatterns and no impact at all onsimpleandmedianpatterns. However, an estimation error of more than 10
degrees can significantly affect the success rate. Given such errors, the resulting trajectory after transformations will be significantly different from the correct pattern. For example, when the estimation error is 10 degrees from the true value, on average, 0.8, 2.6 and 4.2 line segments per pattern respectively will be incorrectly labelled forsimple,median
989 990 991 992 993 994 995 996 997 998 999 1000 1001 1002 1003 1004 1005 1006 1007 1008 1009 1010 1011 1012 1013 1014 1015 1016 1017 1018 1019 1020 1021 1022 1023 1024 1025 1026 1027 1028 1029 1030 1031 1032 1033 1034 1035 1036 1037 1038 1039 1040
5 5 7 0 1 5 0 - 2 4 0 5 0 0 - 9 5 0 0 0 %
2 0 % 4 0 % 6 0 % 8 0 % 1 0 0 %
C
ra
c
k
in
g
s
u
c
c
e
ss
r
a
te
D i f f e r e n t l i g h t c o n d i t i o n s ( L u x )
[image:20.612.90.521.82.465.2]S i m p l e M e d i a n C o m p l e x
Fig. 20. The cracking success rate within five attempts under different lighting conditions.
0 degree 5 degrees 10 degrees
20% 40% 60% 80% 100%
0%
Estimation errors of filming angles
Cracking success rate
[image:20.612.338.509.98.191.2]Simple Median Complex
Fig. 21. Impact of estimation errors of filming angles.
Simple Median Complex
60% 80% 100%
0% 20% 40%
Cracking success rate
4*4 5*5 6*6
(a) success rate for different locking grids
1 a t t e m p t 5 a t t e m p t s 2 0 a t t e m p t s 0 %
2 0 % 4 0 % 6 0 % 8 0 % 1 0 0 %
C
ra
ck
in
g
s
u
cc
es
s
ra
te
O u r s A v i v ' s
(b) success rate for a 4×4 locking grid
Fig. 22. Success rates for different locking grids.
andcomplexpatterns. This explains why the success rate for complex patterns drops significantly when the filming
angle estimation error is greater or equal to 10 degrees.
7.6 Evaluation on Other Pattern Grids
Result 6:A pattern grid with more dots provides stronger protection but our attack can still crack most of the patterns.
There are a few applications (such as CyanLock) and customized ROMs available to increase the size of the pattern grid from 3×3 to 4×4, 5×5, and 6×6. Although a 3×3 grid remains a popular choice (as it is supported by the native Android OS), it is worth studying whether having more touch dots on a pattern grid leads to stronger security. In this experiment, we first ranked all possible patterns for each grid setting in ascending order according to their complexity scores. We then equally divided the patterns into three groups, simple, medium and complex, and asked our participants to randomly select 20 patterns from each group for evaluation. We report the success rate of our attack within five attempts. In the experiments, we have adapted our algorithms for each grid setting by adjusting the algorithm parameters (such as the line direction numbers).
[image:20.612.330.518.244.330.2]1041 1042 1043 1044 1045 1046 1047 1048 1049 1050 1051 1052 1053 1054 1055 1056 1057 1058 1059 1060 1061 1062 1063 1064 1065 1066 1067 1068 1069 1070 1071 1072 1073 1074 1075 1076 1077 1078 1079 1080 1081 1082 1083 1084 1085 1086 1087 1088 1089 1090 1091 1092
1 2 3 4 5
0% 20% 40% 60% 80% 100%
Number of attempts
Cracking success rate
MI4 Vivo X7 Note4 IPhone6 Nikon
(a) camera brands
1 2 3 4 5
0% 20% 40% 60% 80% 100%
Number of attempts
Cracking success rate
Canon Nikon iPhone8 iPhone7
[image:21.612.73.492.97.195.2](b) iPhones and SLR cameras
[image:21.612.94.480.245.303.2]Fig. 23. The cracking success rate for different target screen sizes and filming cameras.
Table 6. Filming camera specs
Parameters Nikon D90 Canon XC10 iPhone8 iPhone7 IPhone6 Vivo X7 MI4 Note4
Frame Rate (fps) 24 30 30 30 30 30 30 30
Pixels 12.3mp 12mp 12mp 12mp 8mp 13mp 13mp 16mp
Focus (mm) 8 10 5 5 4.15 4 4 4.2
Sensitivity (ISO) 400 500 2500 2500 3200 3200 3000 5000
of the patterns within five attempts. One of the purposes of introducing pattern grids with more dots is to allow users to use more complex patterns. However, this experiment suggests that complex patterns remain less security on these grids under our attack.
We also compared our attack against the guessing based attack presented by Avivet al.[Aviv et al. 2015]. This experiment is conducted on a 4×4 locking grid using 30 patterns from the dataset used in [Aviv et al. 2015]. The result is shown in Figure22(b). Our attack achieves a success rate of over 80% (up to 97%), while the attacking mechanism proposed by Avivet al.gives a success rate of under 20%. It is to note that our attack fails to reconstruct one pattern using 20 attempts because our approach produces more than 20 candidate patterns to be tested. Nonetheless, our attack significantly outperforms the attack described in [Aviv et al. 2015] by effectively exploiting the visual information of pattern structures.
7.7 Impact of Different Camera Brands
Result 7:The difference in cameras has little impact on the success rate.
Intuitively, the effectiveness of our attack can be affected by the video-quality of the filming camera. To understand the impact of the filming camera, we asked 10 participants to draw 90 randomly chosen patterns (30 patterns per pattern category). We record the drawing using eight devices, including two SLR cameras and six mobile phones. Table6 gives these recording devices and their main performance specs. In this experiment, our target device is a Huawei Honor7 mobile phone. The filming distance is 2 and 9 meters from target device when using a mobile phone and a SLR respectively.
Figure23(a) shows that our method can reconstruct all patterns within five trials when using a Nikon SLR, an iPhone6 and a Note4 phone as the recording device. Furthermore, our attack remains effective when using other mobile cameras by giving a success rate of over 97% under five attempts. Figure23(b) compares the success rate of our attack when using two other generations of iPhones and different SLR cameras. Again, our method can crack all the testing patterns within five attempts regardless of which filming device is used, albeit a more recent mobile camera does help