Accepted Manuscript
Title: Impact of long term care and mortality risk in
community care and nursing homes populations
Authors: Hugo Lopes, C´eu Mateus, Nicoletta Rosati
PII:
S0167-4943(18)30028-1
DOI:
https://doi.org/10.1016/j.archger.2018.02.009
Reference:
AGG 3630
To appear in:
Archives of Gerontology and Geriatrics
Received date:
3-12-2017
Revised date:
11-2-2018
Accepted date:
12-2-2018
Please cite this article as: Lopes, Hugo, Mateus, C´eu, Rosati, Nicoletta, Impact of long
term care and mortality risk in community care and nursing homes populations.Archives
of Gerontology and Geriatrics https://doi.org/10.1016/j.archger.2018.02.009
1
Impact of long term care and mortality risk in community care and nursing homes
populations
Hugo Lopes, PhD(c)1; Céu Mateus, PhD2; Nicoletta Rosati, PhD3
1 Escola Nacional de Saúde Pública, Universidade NOVA de Lisboa. Lisbon, Portugal.
2 Health Economics Group, Division of Health Research, Lancaster University, Furness College, LA1 4YG UK
3 Instituto Superior de Economia e Gestão, Universidade de Lisboa, and CEMAPRE, Lisbon, Portugal.
Corresponding author: Hugo Lopes, e-mail: [email protected] Phone:
(+351)919968241
Highlights
The Portuguese National Network for Long-Term Care was created in 2006
Individuals receiving home care have a higher mortality rate
Most individuals present no changes in their cognitive and physical status
Quality and safety may improve if patient-reported outcomes measures are implemented
Objectives: To identify the survival time, the mortality risk factors and the individuals’
characteristics associated with cognitive and physical status at discharge, among the Portuguese
long-term care (LTC) populations.
Settings: Home-and-Community-Based Services (HCBS) and three types of nursing home (NH).
Participants: 20,984 individuals admitted and discharged in 2015.
Measurements: The Kaplan-Meier survival analysis and the Cox Proportional Hazards Models
were used to study the mortality risk; the Wilcoxon signed-rank test to identify the number of
individuals with cognitive and physical changes between admission and discharge; two
cumulative odds ordinal logistic regressions to predict the cognitive and physical dependence
levels at discharge
2
Results: The mortality rate at HCBS was 30%, and 17% at the NH, with a median survival time
of 173 and 200 days, respectively. The main factors associated with higher mortality were older
age, male gender, family/neighbour support, neoplasms and cognitive/physical dependence at
admission. In NH/HCBS, 26%/18% of individuals improve their cognitive status, while in physical
status, the proportion was 38%/27%, respectively. Finally, older age, being illiterate and being
classified at the lowest cognitive and physical status at admission decrease the likelihood of
achieving a higher level of cognitive and physical independence at discharge.
Conclusions: The adoption of a robust and complete assessment tool, the definition of guidelines
to enable a periodical assessment of individuals’ autonomy and the adoption of benchmark metrics allowing the comparison of results between similar units are some of the main goals to
be taken into account for future developments of this care in Portugal.
Keywords: Nursing Homes; Home and Community-Based Services; Mortality risk; Outcomes assessment; Portugal
Background
Needs assessments nowadays play a fundamental role in the planning process of healthcare and
social services and are even considered a means in the clinical context to reach a specific diagnosis [1]. Being the main premise of the long-term care (LTC) sector “care over cure”, it is
important to define metrics of needs assessment in several areas to help healthcare providers to
(re)design patient care, develop clinical pathways and predict with higher accuracy their
rehabilitation outcome at discharge.
Although several studies analysed the differences between Nursing Homes (NH) and Home and
Community-Based Services (HCBS) populations in order to identify factors determining
admissions into each setting of care, it is not easy or consensual to define the best areas for
outcome assessment. Usually, outcome measures are related either to mortality or to changes of
cognitive and physical dependence levels. Thus, to assess these outcomes, it is important to
incorporate different individual-mix factors, including socio-demographic characteristics, medical conditions as well as the physical and cognitive status [1–4].
Regarding the mortality assessment, because the number of deaths in LTC is usually high, it is important to estimate the expected length of survival after an individual’s admission and identify
the main mortality predictors so that policy makers can optimize the planning of services provision.
For that matter, in spite of different magnitudes between studies, several authors concluded that
the most relevant mortality risk factors include older age, male gender, the absence of a social
3
respiratory diseases) and high levels of cognitive and physical dependence [5–11]. After assessing the mortality rate, some authors found no differences between NH and HCBS, either
after adjusting for baseline variables (age, gender, race, education, race, education, marital
status, length of stay, cognition, and comorbidity) [12] or when comparing patients receiving care at NH, HCBS or combined care [13]. Others found a higher mortality among those at NH [6,14–
16].
Concerning the physical outcomes, whereas some authors found no significant differences in the deterioration in performing activities of daily living (ADL) between the two settings of care [12,17– 19], others found better outcomes among HCBS individuals [13,20–22] and others concluded that only the NH population showed some ADL improvements [23]. As for changes in cognitive status,
although some authors found no statistical differences between the two settings of care [12,23],
others found better outcomes among those at HCBS [13,20].
Besides the overall differences in outcomes between these two populations, several findings can
be highlighted concerning the influence of different variables as predictors of physical and
cognitive changes. Older age seems to be related to a higher cognitive impairment [24,25];
moreover, some studies concluded that younger age positively influences the physical
improvement [2,4,16,18,26] but others found no significant effect [27–30]. In most health facilities with similar rehabilitation programmes, men and women are expected to achieve similar progress
and outcomes. Despite gender being an independent risk factor for cognitive function [24,25],
some authors found no statistically significant association between gender and changes in cognitive [19] and physical status [26,29–31]. Others concluded that women were twice as likely
to show physical improvements compared to men [2]. Within HCBS individuals, one study
concluded that women were more likely to achieve functional recovery [4], while others concluded
the opposite [16,28].
Since LTC patients are usually elderly people with chronic diseases, what often influences their
dependence levels, accurate information regarding medical diagnoses is essential for care
planning and monitoring for predicting their rehabilitation outcomes. As concluded by several
studies, individuals with fewer chronic diseases are more likely to achieve better outcomes
[2,4,31]. Finally, whereas global limitations in motor functions at admission combined with cognitive impairment can influence the overall levels of disability at discharge [2–
4,16,26,29,31,32], limitations in the ability to perform at admission single ADL like the use of a
wheelchair [33], walking [34] or transfers (to the toilet and/or to the bed/chair) [35], can also be
seen as important outcome predictors.
The long-term care in Portugal
In Portugal, the National Network for Long-term Integrated Care (Rede Nacional de Cuidados
Continuados Integrados, RNCCI) was created in 2006 as a partnership between the Ministry of
Health and the Ministry of Employment and Social Solidarity [36]. As defined by the Portuguese
legislation, the RNCCI is organized into two main settings of care [36]: HCBS and NH.
4
As for the HCBS, the care is provided between 8am and 8pm at home under the responsibility of
the primary care centre teams, to people with functional dependence but who do not require acute
care. Of the several services provided, stands out the personal hygiene, medical, nursing and
rehabilitation care, occupational therapy, education and psychosocial support involving both
patients and their caregivers [37,38]. Individuals with care needs during the night, in need for only
social support or without informal caregivers, are excluded.
In order to respond to different needs, the NH in Portugal are organized into three types of care
units [36]. Although services like personal hygiene, drugs prescription and administration,
psychological and social support are provided to all patients [37,38], the intensity of nursing,
medical and physiotherapy care differs according to the type of care units, namely [36,37]: (i)
Convalescence Units (Unidades de Convalescença, UC), which provide nursing, medical and
physiotherapy care on a daily basis for individuals discharged from hospitals in need of
convalescence care up to 30 consecutive days; (ii) the Medium-Term and Rehabilitation Units
(Unidades de Média Duração e Reabilitação, UMDR), which provide less intensive and
differentiated care (while the nursing care is provided daily, the medical and rehabilitation care is
provided two days per week) for individuals with an expected length of care between 31 and 90
consecutive days; and (iii) the Long-Term and Maintenance Units (Unidades de Longa Duração
e Manutenção, ULDM), which provide daily nursing care (medical and rehabilitation care only once a week) for individuals with difficulties with community inclusion as well as for caregivers’
respite care, with a length of care higher than 90 consecutive days.
Objectives
The main goal of this research is to contribute to a better understanding of two areas in the LTC
sector that may help policy makers and staff to improve the way care is provided to such a fragile
population: mortality and patients’ outcomes. Regarding the first one, we aim to identify the
median survival time within NH and HCBS settings of care and identify the predictive power of
several variables on the mortality risk in each setting. Then, we aim to quantify the impact of care
provided by looking at the number of individuals who showed changes in their physical and
cognitive dependence level between admission and discharge as well as to identify the individuals’ characteristics associated with each status at discharge.
Data and methods
Data source
The dataset contains records of 20,984 individuals aged ≥60 years, admitted and discharged in 2015 in Portugal mainland, of which 14,140 were from NH and 6,844 from HCBS.
Besides the identification of the length of care, referral entity, region and setting of care, this study
includes results from the Portuguese screening tool used by LTC healthcare professionals to assess patients’ dependence levels, called Integrated Bio-psychosocial Assessment Instrument
[39]. The information collected by this tool and used in this study is divided in three areas [40]: (i)
5
using the Katz’ ADL index [41] (toileting, dressing, bathing, transferring/bed, transferring/chair, continence/urination, continence/defecation and feeding) in two moments (admission and
discharge); (ii) Psychological: assessment of the cognitive status through the ability to answer
questions about temporal (year, month, day, season and day of the week) and spatial (country,
province, city/town, home and floor) orientation using the Mini-Mental State Examination [42] in
two moments (admission and discharge); and (iii) Social: level of education, marital status and
the availability of family/neighbour support.
Regarding the assessment of the cognitive/physical status of each individual, this tool does it in
three stages [39,40]. First, it assesses the ability to perform each activity using a four system
score: score 0 (bad/ incapable); score 1 (unsatisfactory/ dependent); score 2 (satisfactory/
autonomous); and score 3 (good/ independent). Then, while the overall physical status is
determined by considering the lowest score obtained in the eight activities assessed, the cognitive
status is determined by the average score of the ten activities analysed. Finally, based on the
previous cognitive/physical scores, each individual is further classified into one of the four
dependence groups.
Methodology and model adopted
The Kaplan-Meier survival analysis (log-rank test) was conducted to determine the median
survival time in the two main settings of care and within the three NH units of care. Then, a Cox
Proportional Hazards Model was used to identify the predictive power of several variables
(socio-demographic characteristics, medical conditions, cognitive and physical dependence level at
admission, referral entity) for mortality risk in NH and HCBS settings of care. Third, the Wilcoxon
signed-rank test was used to measure changes in cognitive and physical dependence level
between admission and discharge, both for all population and for only those alive at discharge.
Finally, two cumulative odds ordinal logistic regressions were run to determine the effect of
several variables on the ability to predict the cognitive (Model 1) and physical (Model 2) status,
using the dependence level at discharge as dependent variable. From the several aspects
mentioned in the literature, which may influence the status at discharge, we selected as
explanatory variables the socio-demographic characteristics, medical conditions,
cognitive/physical dependence levels at admission and settings of care. Even though the direct
association of other factors like the referral entity and length of care is not yet well proven
[2,16,18,31], they were used as control variables. In this last analysis, only individuals alive at
discharge were included.
All analyses were made with SPSS Statistics software (v.20, IBM SPSS, Chicago, IL), using a
significance level of 0.05.
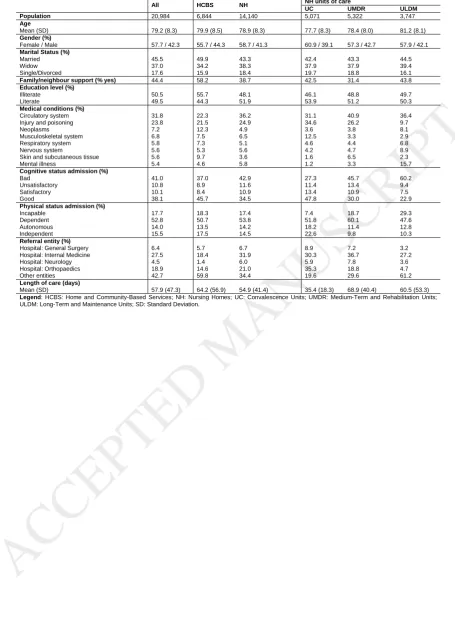
Population characteristics
Comparing the two main settings of care, the NH population is slightly younger, has a higher
percentage of females, lower percentage of married people and fewer individuals with
6
conditions registered at admission are diseases of circulatory system, injury and poisoning and
neoplasms, and the percentage of individuals classified into the two lowest levels of cognitive and
physical independence is higher at NH (54.5% and 71.2%) than in HCBS (45.9% and 69.0%)
setting of care. Regarding the referral entity, while most NH individuals are referred from hospital
services, like internal medicine and orthopaedic, the majority of the HCBS individuals are referred
by other entities, such as the primary care providers.
Results
Outcomes assessment: mortality risk
The overall mortality rate is 21.1%, with a median survival time of 197 days (Table 2). Comparing
the two main settings of care, the HCBS population presents a higher mortality rate and a lower
survival time when compared to the institutionalized population (p<0.001). Within the three NH
units, the mortality rate increases as we go from a shorter (UC) to a longer (ULDM) care unit, and
consequently, the median survival time has the opposite behaviour (p<0.001).
;
Table 3 identifies the variables with statistical significance for the mortality risk in each setting of
care. Regarding the socio-demographic factors, older age and male gender increase the risk of
mortality in both settings of care (p<0.001). On the other hand, the absence of family/neighbour
support (p<0.001) decreases the mortality risk in both models, being illiterate (p=0.045) has the
opposite effect but only at NH. Concerning the medical conditions, while having a diagnosis of
neoplasms (p<0.001) or diseases of the skin and subcutaneous tissue (HCBS: p=0.010; NH:
p<0.001) increases the risk of mortality in both settings of care, individuals with diseases of the
musculoskeletal (p<0.001) or circulatory system (HCBS: p=0.021; NH: p<0.001) present the
opposite result. Looking at dependence levels, compared to those classified as cognitively or
physically independent at admission, being classified in the highest level of impairment increases
the risk of mortality in both settings of care. Finally, regarding the referral entity, while individuals
referred by internal medicine services have a higher probability to die (p<0.001), those referred
by the orthopaedics services have the opposite chance (HCBS: p=0.003; NH: p<0.001).
Outcomes assessment: changes in the dependence level
Comparing the percentage of individuals with cognitive and physical changes between all
population and only those alive at discharge, several differences can be highlighted (Fig. 1).
Regarding the cognitive status, the percentage of individuals who maintained or improved their
status was higher among those alive at discharge (61% and 24%) when compared to the whole
population (48% and 19%). Despite a similar trend between HCBS and NH settings of care, the
7
populations. Comparing the three NH units of care, although the percentage of individuals with
some improvements decreases as we go from the UC to the ULDM, the majority maintained their
cognitive status between admission and discharge. Concerning the physical status, despite a
similar trend towards the cognitive status, the UC is the only setting of care where the percentage
of individuals who improved is higher than those who worsened or maintained their function
abilities, both in the whole population (44%) and in only those alive at discharge (45%).
Outcomes assessment: predicting the dependence level at discharge
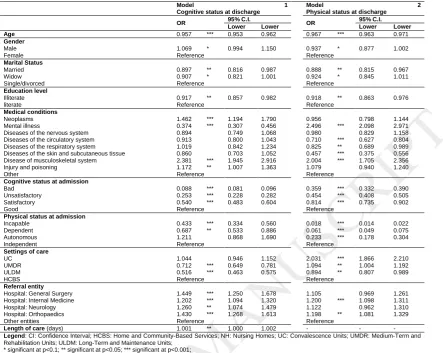
Table 4 identifies the predictive power of each variable on the cognitive (Model 1) and physical
status (Model 2) at discharge. Only family/neighbour support was excluded from both models,
due to a lack of statistical significance.
The socio-demographic characteristics that most contribute to decreasing the odds of being
classified at a higher cognitive and physical independence status at discharge are older age
(p<0.001), being married (Model 1: p=0.026; Model 2: p=0.006) or being a widow(er) (Model 1:
p=0.052, Model 2: p=0.085) when compared to single/divorced people and being illiterate (Model
1: p=0.013; Model 2: p=0.006). While male gender seems to have a negative influence on the
physical status at discharge (Model 2: p=0.057), it has the opposite effect on the cognitive status
at discharge (Model 1: p=0.074).
Compared to other medical conditions at admission, while having mental illness (p<0.001)
decreases the probability of being classified at a higher level of cognitive independence at
discharge, having musculoskeletal diseases (p<0.001) has the opposite effect. With respect to
the physical status, while having diseases of the skin and subcutaneous tissue (p<0.001) or the
circulatory (p<0.001) or respiratory (p=0.038) system decreases the probability of being classified
at a higher independence level at discharge, having musculoskeletal diseases or mental illness
(p<0.001) has the opposite effect.
Compared to those classified at a higher independence level at admission, being considered
cognitively or physically impaired at admission decreases the probability of achieving a higher
status at discharge (p<0.001). Regarding the NH units, compared to HCBS, while being admitted
at UC increases the probability of achieving a better cognitive (Model 1: although not statistically
significant) or physical (Model 2: p<0.001) status at discharge, being admitted at ULDM (Model
1: p<0.001; Model 2: p=0.030) has the opposite effect.
Discussion
Outcomes assessment: mortality risk
Because the mortality rate in the LTC sector is usually high and the predictive intensity of several
variables may vary according to the setting of care, its assessment is clinically useful and
8
to the findings of several authors [6,14–16,43], in this study, the higher mortality rate among HCBS than in the NH population may be explained by the existence of different institutionalized
units of care. Although the ULDM have a mortality rate five times higher and approximately half
of the estimated time of survival than UC, reflecting the higher severity of the first population, both
results are very similar to the results of those who received home care (HCBS). Because these
two settings of care were designed to respond to different care needs, these results may indicate
possible problems regarding the referral process that are worth to be explored.
Based on the Cox regression analysis, several factors have been found to predict the mortality
risk in each setting of care. Concerning the socio-demographic characteristics, whereas older age
and male gender increase the risk of mortality in both settings of care, not having family/neighbour
support has the opposite effect. Although some authors concluded that the effect of these characteristics were not statistically significant [5], this finding is similar to previous studies [6–
10,43]. Previous studies have concluded that individuals with minimal family/neighbour support
and low social engagement levels present higher mortality risks [6,8,10,11], therefore finding the
opposite effect in our study is rather surprising. Further research to understand this result is
required.
Although some authors left out the comorbidities in their mortality risk model, arguing that those
have been well captured by the scopes of cognitive and physical status given by the scales used
respectively [7], others found that some medical conditions (such as neoplasms, respiratory or
cardiovascular diseases) are important risk factors of mortality [6,9,43]. The fact that, in this study,
individuals with neoplasms or diseases of the skin and subcutaneous tissue have a higher
mortality risk is something to be considered by policy makers, referral entities and staff in order
to adopt special care plan for these individuals, before and after their admission into each setting
of care. Finally, as concluded by previous research, as well as by this study, being classified at a higher physical [5–9] and cognitive [6,7,9] dependence level at admission increases the risk of mortality in all settings of care. Thus, policy makers have to realize that the accurate assessment of a person’s status plays an important role in the referral process and should be taken into
consideration when selecting the best setting of care for each individual.
Outcomes assessment: changes in the dependence level
In this study, while 34% of those alive at discharge had improved their physical status (38% at
NH; 27% at HCBS), the percentage of individuals who maintained the same status stood at 55%
(51% at NH; 64% at HCBS). Looking to the literature, although a study among 600
community-dwelling elderly had reached a similar finding (improved: 33%; unchanged: 62%) [3], in a study
with 2,754 patients aged ≥65 years admitted into a post-acute rehabilitation facility over a four-year period, 85% of the individuals improved their functional status (unchanged: 10%) [4]. On the
other hand, whereas a study comparing two cohorts of patients with dementia concluded that
45% of the individuals improved (44% at NH; 48% at HCBS) or 20% maintained their physical
status (similar percentage at NH and HCBS) [13], in a recent study at NH these percentages
9
of individuals with some improvement in this study stood at 24% (26% at NH; 18% at HCBS),
61% maintained the same status (57% at NH; 71% at HCBS). For that matter, after collecting
data two months apart, a study on a subset of 2,275 older patients in England and Wales
concluded that the percentage of individuals with cognitive improvement ranged between
14%-21%, and 58%-78% maintained their status [19]. In another study performed with a group of
patients with dementia, the authors concluded that 38% showed some improvement (37% at NH
and 39% at HCBS), and 36% maintained their status (36% at NH and 34% at HCBS) [13].
Given the overall results, an higher number of individuals improving their physical status
compared to the cognitive improvement is in line with several studies [13,32,35], and may be
explained by the greater tendency of the RNCCI to focus on the total or partial recovery of lost
physical autonomy. Nevertheless, since the LTC sector focuses on elderly frail persons with a
high level of dependence, it is deemed necessary that staff and policy makers work towards the
implementation of standard control measures to insure that each setting offers a care programme tailored to individuals’ needs. On the other hand, it is also vital to assess the ability of the
Integrated Bio-psychosocial Assessment Instrument to accurately capture dependency levels and
its performance when used in repeated measurements for the same individual (admission and
discharge, for instance).
Outcomes assessment: predicting the dependence level at discharge
In this study, the main features that contribute to decrease the probability of being classified as a
higher cognitive and physical independence status at discharge are older age, low social support
and low levels of cognitive and physical independence at admission. These findings are important
for empowering the policy makers to (re)adapt, if necessary, the provision of care whenever they
encounter individuals with these characteristics in need of some kind of LTC services.
With respect to age, although several studies suggest similar findings, either among
institutionalized [2,18,26] or non-institutionalized [4] individuals, others found no significant
influence on physical outcomes, either at NH [27,29–31] or at HCBS settings of care [26,28]. Concerning the social support features, there is no consensus about their influence. In some
studies, those living alone remained at increased probability of physical recovery [3,4]; others
concluded the opposite [26]; and others found no relationship [18]. In our study, although the
availability (or lack) of family/neighbour support was not statistically significant for cognitive or
physical improvement, being married decreases the chance of being classified at a higher
independence level at discharge. Although this seems contradictory, one possible explanation is
that, instead of trying to perform certain tasks on their own, the fact that these individuals have
some kind of help from third parties may limit the recovery of their lost functions.
Regarding the influence of the baseline dependence levels as predictors of the final status, this
study has reached similar conclusions as previous research published: (i) being cognitively
independent at admission has a positive influence on physical improvement, both among NH
[2,26,29,31,35] and HCBS [3,4,26,32] populations; (ii) physical status at admission is also a good
10
concluded that a higher independence level at admission not only increases the chances of being
classified at a higher cognitive independence level at discharge [19,31], but it also has positive
influences on the physical level at discharge, within both NH [26,29,31,35]and HCBS [3,4,26,28]
populations. Based on these results, it becomes evident the importance of providing health
professionals with reliable tools that allow an accurate assessment of the dependence levels of
this population in order to predict with more certainty their outcomes.
As for medical conditions, although it was not possible to identify the burden of disease for each
individual, one main conclusion stood out: those with musculoskeletal diseases have a higher
probability of achieving both cognitive and physical improvements than those without these
diseases. For that matter, after assessing the outcomes of patients admitted into post-acute care
facilities, Gindin and colleagues (2007) found that, while those who had a stroke were less likely to show physical improvement than those who hadn’t had a stroke, individuals with a hip fracture
had more than double the probability of achieving improvement than those without a hip fracture
[2]. On the other hand, in a cohort of 560 older people from Australia, although disability on
admission was higher in individuals with a stroke and a hip fracture and lower for those with joint
replacement, after six months, the group had a better chance of achieving physical and cognitive
scores [31]. More recently, in a study conducted over a four-year period, whereas individuals with
musculoskeletal diseases were more likely to achieve some functional recovery, those who did
not recover more often presented some cerebrovascular diseases [4]. Thus, despite appearing
to be contradictory, given the emphasis on the physical recovery of this population, the
progressive improvement in their functionality during their length of care also has a consequently
positive effect on their cognitive recovery. Therefore, it is vital that managers and staff of each
setting of care become aware of the importance of having a more detailed record of all medical
conditions of each individual in order to adapt the care plan to each situation to maximize the
benefits of the care provided.
As for the length of care, even though several studies have found it positively associated with the
chances of being classified into a more independent physical status at discharge in both settings
of care [2,16,31], in our study, there seems to be a smaller but positive influence only regarding
the cognitive improvement. Policy makers and staff should reflect upon such a conclusion in order
to assess whether (or not) the length of stay is actually used to restore the lost autonomy, or if
the intensity and frequency of the care provided is, in fact, adapted to the care needs. Thus, only
when it is possible to combine the care needs, the intensity and the frequency of care, as well as
the length of stay, will it be possible to leverage the existing resources in favour of these
individuals.
Regarding the limitations, this study only considers individuals already admitted into an LTC
setting, thus the results hold in identical settings. Second, because the mortality analysis only
takes into account observations for a one-year period, it is not possible to verify whether these
findings are (or have been) consistent over the years. Third, since only the admission diagnosis
11
influence as a risk factor. Finally, although in this work we mainly used individuals’ characteristics, other circumstances such as transfers to other care settings, number of hospital admissions,
number of medications being taken, staff skill mix or the intensity of care received may play a role
in cognitive/functional recovery but were not taken into account as information was not available.
Conclusions
This is the first work that uses the entire national database, providing a valid description of the
LTC situation in Portugal and its main outcomes. Although it is difficult to draw definitive
conclusions regarding the power of different predictors in forecasting the outcomes of LTC
services, the knowledge about the mortality risk factors and the impact of care provision on
dependence levels are critical to policy makers and staff to help them to shape a more suitable
care plan for future patients.
From this work, two main conclusions have arisen. First, those receiving home care have a higher
mortality rate than the ones staying in NH and NH treating more severe patients also present
higher mortality rates, as could be anticipated. Second, most individuals present no changes in
their cognitive and physical status from admission to discharge, especially those receiving home
care. This is an important finding for policy makers and deserves further research as it puts at
stake the current goals of the Portuguese LTC system.
Although the RNCCI has defined a set of indicators for quality monitoring and some are already
publicly available [44], there are several challenges ahead for policy makers: (i) critically assess the reliability of the current screening tool in identifying individuals’ dependence levels; (ii) use
risk adjustment methods for measuring quality of care rather than interpreting raw incidence or
prevalence rates; (iii) rethink the funding system as currently it is based on a per diem, which
presents well known perverse incentives for the payer; and (iv) similar to what is currently in place
in other countries, implement a patient-reported outcomes measures to support improvement in the quality and safety of healthcare delivery [45–47].
Conflict of Interest statement
Nothing to declare.
Acknowledgements
We want to acknowledge the Portuguese Central Administration of Health System for providing
the information collected by the LTC professionals. Author NR gratefully acknowledges financial
support from FCT (Project CEMAPRE – UID/MULTI/00491/2013 financed by FCT/MCTES
through national funds).
12
References
[1] Iezzoni LI. Risk adjusting rehabilitation outcomes: an overview of methodologic issues. Am J Phys Med Rehabil 2004;83:316–26.
[2] Gindin J, Walter-Ginzburg A, Geitzen M, Epstein S, Levi S, Landi F, et al. Predictors of
Rehabilitation Outcomes: A Comparison of Israeli and Italian Geriatric Post-Acute Care (PAC) Facilities Using the Minimum Data Set (MDS). J Am Med Dir Assoc 2007;8:233–
42. doi:10.1016/j.jamda.2006.12.032.
[3] Fusco D, Bochicchio GB, Onder G, Barillaro C, Bernabei R, Landi F. Predictors of
Rehabilitation Outcome Among Frail Elderly Patients Living in the Community. J Am Med Dir Assoc 2009;10:335–41. doi:10.1016/j.jamda.2009.02.004.
[4] Seematter-Bagnoud L, Lécureux E, Rochat S, Monod S, Lenoble-Hoskovec C, Büla CJ.
Predictors of functional recovery in patients admitted to geriatric postacute rehabilitation. Arch Phys Med Rehabil 2013;94:2373–80. doi:10.1016/j.apmr.2013.06.024.
[5] Carlson MC, Brandt J, Steele C, Baker A, Stern Y, Lyketsos CG. Predictor index of
mortality in dementia patients upon entry into long-term care. Journals Gerontol Ser
A-Biological Sci Med Sci 2001;56:M567–70.
[6] Jakobsson U, Hallberg IR. Mortality among elderly receiving long-term care: a longitudinal cohort study. Aging Clin Exp Res 2006;18:503–11. doi:10.1007/BF03324851.
[7] Lee JSW, Chau PPH, Hui E, Chan F, Woo J. Survival prediction in nursing home residents
using the Minimum Data Set subscales: ADL Self-Performance Hierarchy, Cognitive
Performance and the Changes in Health, End-stage disease and Symptoms and Signs scales. Eur J Public Health 2009;19:308–12. doi:10.1093/eurpub/ckp006.
[8] Hjaltadóttir I, Hallberg IR, Ekwall AK, Nyberg P. Predicting mortality of residents at
admission to nursing home: a longitudinal cohort study. BMC Health Serv Res 2011;11:86.
doi:10.1186/1472-6963-11-86.
[9] Sung K. Predictive factors associated with death of elderly in nursing homes. Asian Nurs Res (Korean Soc Nurs Sci) 2014;8:143–9. doi:10.1016/j.anr.2014.05.004.
[10] Luo Y, Waite LJ. Loneliness and Mortality Among Older Adults in China. Journals Gerontol Ser B Psychol Sci Soc Sci 2014;69:633–45. doi:10.1093/geronb/gbu007.
[11] Vetrano DL, Collamati A, Magnavita N, Sowa A, Topinkova E, Finne-Soveri H, et al. Health
determinants and survival in nursing home residents in Europe: Results from the SHELTER study. Maturitas 2018;107:19–25. doi:10.1016/j.maturitas.2017.09.014. [12] Sloane PD, Zimmerman S, Gruber-Baldini AL, Hebel JR, Magaziner J, Konrad TR. Health
and functional outcomes and health care utilization of persons with dementia in residential
care and assisted living facilities: comparison with nursing homes. Gerontologist 2005;45 Spec No:124–32.
[13] Lee TW, Yim E, Cho E, Chung J. Cognitive function, behavioral problems, and physical
13
75. doi:10.1111/jgs.12944.
[14] Gruber-Baldini AL, Stuart B, Zuckerman IH, Simoni-Wastila L, Miller R. Treatment of
dementia in community-dwelling and institutionalized medicare beneficiaries. J Am Geriatr Soc 2007;55:1508–16. doi:10.1111/j.1532-5415.2007.01387.x.
[15] Wieland D, Boland R, Baskins J, Kinosian B. Five-year survival in a program of
all-inclusive care for elderly compared with alternative institutional and home-and community-based care. Journals Gerontol - Ser A Biol Sci Med Sci 2010;65 A:721–6.
doi:10.1093/gerona/glq040.
[16] Häcker J, Hackmann T. Los(t) in long-term care: empirical evidence from German data 2000-2009. Health Econ 2012;21:1427–43. doi:10.1002/hec.1805.
[17] Chiu L, Shyu WC, Liu YH. Comparisons of the cost-effectiveness among hospital chronic
care, nursing home placement, home nursing care and family care for severe stroke patients. J Adv Nurs 2001;33:380–6. doi:10.1046/j.1365-2648.2001.01703.x.
[18] Frytak JR, Kane R a, Finch MD, Kane RL, Maude-Griffin R. Outcome trajectories for assisted living and nursing facility residents in Oregon. Health Serv Res 2001;36:91–111. [19] Marioni RE, Chatfield M, Brayne C, Matthews FE. The reliability of assigning individuals
to cognitive states using the Mini Mental-State Examination: a population-based
prospective cohort study. BMC Med Res Methodol 2011;11:127.
doi:10.1186/1471-2288-11-127.
[20] Rothera I, Jones R, Harwood R, Avery A, Waite J. Health status and assessed need for a
cohort of older people admitted to nursing and residential homes. Age Ageing 2003;32:303–9. doi:10.1093/ageing/32.3.303.
[21] Lee TW, Cho E, Yim ES, Lee HS, Ko YK, Kim BN, et al. Activities of Daily Living in Nursing
Home and Home Care Settings: A Retrospective 1-Year Cohort Study. J Am Med Dir Assoc 2015;16:114–9. doi:10.1016/j.jamda.2014.07.013.
[22] Lee K, Cho E. Activities of daily living and rehabilitation needs for older adults with a stroke:
A comparison of home care and nursing home care. Japan J Nurs Sci 2016.
doi:10.1111/jjns.12139.
[23] Kim E-Y, Yang B-M. Cost-effectiveness of long-term care services in South Korea. Arch Gerontol Geriatr 2005;40:73–83. doi:10.1016/j.archger.2004.05.007.
[24] Anderson TM, Sachdev PS, Brodaty H, Trollor JN, Andrews G. Effects of
sociodemographic and health variables on Mini-Mental State Exam scores in older
Australians. Am J Geriatr Psychiatry 2007;15:467–76.
doi:10.1097/JGP.0b013e3180547053.
[25] Moraes C, Pinto JA, Lopes MA, Litvoc J, Bottino CMC. Impact of sociodemographic and
health variables on mini-mental state examination in a community-based sample of older people. Eur Arch Psychiatry Clin Neurosci 2010;260:535–42.
doi:10.1007/s00406-010-0104-3.
[26] Kim YH, Kwon CH, Shin HI. Validity of motor impairment scale in long-term care insurance system of Korea. Ann Rehabil Med 2013;37:403–12. doi:10.5535/arm.2013.37.3.403.
14
[27] Bagg S, Pombo AP, Hopman W. Effect of age on functional outcomes after stroke rehabilitation. Stroke 2002;33:179–85. doi:10.1161/hs0102.101224.
[28] Perrig-Chiello P, Perrig WJ, Uebelbacher A, Stähelin HB. Impact of physical and
psychological resources on functional autonomy in old age. Psychol Health Med 2006;11:470–82. doi:10.1080/13548500600726633.
[29] Jerez-Roig J, de Brito Macedo Ferreira LM, Torres de Araújo JR, Costa Lima K. Functional
decline in nursing home residents: A prognostic study. PLoS One 2017;12:e0177353.
doi:10.1371/journal.pone.0177353.
[30] Phillips LJ, Leary E, Blankenship J, Zimmerman S. Physical Function, Relocation, and
Mortality Outcomes in Residential Care and Assisted Living Residents. J Aging Health
2017:898264317740047. doi:10.1177/0898264317740047.
[31] Cameron ID, Schaafsma FG, Wilson S, Baker W, Buckley S. Outcomes of rehabilitation
in older people-functioning and cognition are the most important predictors: An inception cohort study. J Rehabil Med 2012;44:24–30. doi:10.2340/16501977-0901.
[32] Vogt L, Wieland K, Bach M, Himmelreich H, Banzer W. Cognitive status and ambulatory rehabilitation outcome in geriatric patients. J Rehabil Med 2008;40:876–8. doi:10.2340/16501977-0260.
[33] Singh R, Hunter J, Philip A, Todd I. Predicting those who will walk after rehabilitation in a specialist stroke unit. Clin Rehabil 2006;20:149–52.
[34] Suzuki M, Omori M, Hatakeyama M, Yamada S, Matsushita K, Iijima S. Predicting
Recovery of Upper-Body Dressing Ability After Stroke. Arch Phys Med Rehabil 2006;87:1496–502. doi:10.1016/j.apmr.2006.07.267.
[35] Gialanella B, Santoro R, Ferlucci C. Predicting outcome after stroke: the role of basic activities of daily living. Eur J Phys Rehabil Med 2012;48:1–9.
[36] D.R. Decree-Law 101/2006. D.R. I Serie A, 6th of July - Creation of the Portuguese
National Network for Long-term Care [in Portuguese] 2006:3856–65. http://www.acss.min-saude.pt/wp-content/uploads/2016/10/Decreto-Lei_101_2006-1.pdf.
[37] D.R. Ordinance no. 174/2010, 10th of September, which updates the operational
conditions of the nursing homes and home care settings of care [in Portuguese] 2014:4865–82.
http://www.sg.min-saude.pt/NR/rdonlyres/F1071041-A28D-4B06-8CB5-D640D1D60D80/41897/Portaria174_2014.pdf (accessed June 1, 2017).
[38] ISS. Practical guide - National Network for Long-term Care [in Portuguese]. Lisbon: 2017.
[39] Abreu Nogueira J, Girão M, Guerreiro I. Outcomes of physical autonomy in Post Acute
and Long Term Care National Network for Integrated Continuous Care Portugal. Lisbon:
UMCCI; 2010.
[40] Botelho MA. Autonomia Funcional em Idosos: Caracterização multidimensional em idosos
utentes de um centro de saúde urbano (Functional Autonomy in Elders: Multidimensional
characterization in elderly users of an urban primary care centre). Faculdade de Ciências
Médicas da Universidade Nova de Lisboa, 1999.
15
illness in the aged: the index of ADL, a standardized measure of biological and
psychosocial function. JAMA 1963;185:914. doi:10.1001/jama.1963.03060120024016.
[42] Folstein MF, Folstein SE, McHugh PR. Mini-mental. A practical method for grading the cognitive state of patients for the clinician. J Psychiatr Res 1975;12:189–98.
[43] Shah SM, Carey IM, Harris T, DeWilde S, Cook DG. Mortality in older care home residents in England and Wales. Age Ageing 2013;42:209–15. doi:10.1093/ageing/afs174.
[44] NHS. Transparency Portal: National Network for Long-term Integrated Care indicators [in
Portuguese] 2017. https://transparencia.sns.gov.pt/explore/?sort=title&q=rncci (accessed
August 18, 2017).
[45] Wiering B, de Boer D, Delnoij D. Patient involvement in the development of patient-reported outcome measures: a scoping review. Heal Expect 2017;20:11–23.
doi:10.1111/hex.12442.
[46] Kearns T, Cornally N, Molloy W. Patient reported outcome measures of quality of
end-of-life care: A systematic review. Maturitas 2017;96:16–25.
doi:10.1016/j.maturitas.2016.11.004.
[47] Fischer F, Gibbons C, Coste J, Valderas JM, Rose M, Leplège A. Measurement invariance
and general population reference values of the PROMIS Profile 29 in the UK, France, and
Germany. Qual Life Res 2018. doi:10.1007/s11136-018-1785-8.
16
Legend: HCBS: Home and Community-Based Services; NH: Nursing Homes; UC: Convalescence Units; UMDR: Medium-Term and Rehabilitation Units; ULDM: Long-Term and Maintenance Units.
Wilcoxon signed-rank test, based on negative ranks. Difference in dependence level between admission and discharge: * significant at p<0.1; ** significant at p<0.05; *** significant at p<0.001
Fig. 1: Percentage of individuals who had changes in their cognitive and physical dependence level between admission and discharge 0.0% 10.0% 20.0% 30.0% 40.0% 50.0% 60.0% 70.0% All N= 16,562 (Z= -17.60***) HCBS N= 4,826 (Z= -8.10***) NH N= 11,736 (Z= -15.64***) UC N= 4,768 (Z= -13.63***) UMDR N= 4,364 (Z= -10.89***) ULDM N= 2,606 (Z= -0.05)
Worsened Unchanged Improved 0.0% 10.0% 20.0% 30.0% 40.0% 50.0% 60.0% 70.0% All N= 20,984 (Z= -24.97***) HCBS N= 6,844 (Z= -27.79***) NH N= 14,140 (Z= -10.51***) UC N= 5,071 (Z= -6.11***) UMDR N= 5,322 (Z= -5.82***) ULDM N= 3,747 (Z= -20.88)
Worsened Unchanged Improved
0.0% 10.0% 20.0% 30.0% 40.0% 50.0% 60.0% 70.0% All N= 16,562 (Z= -47.84***) HCBS N= 4,826 (Z= -20.57***) NH N= 11,736 (Z= -43.28***) UC N= 4,768 (Z= -35.25***) UMDR N= 4,364 (Z= -22.59**) ULDM N= 2,606 (Z= -12.62***)
Worsened Unchanged Improved
Cognitive status: Entire population Cognitive status: Population alive at discharge
Physical status: Entire population Physical status: Population alive at discharge
0.0% 10.0% 20.0% 30.0% 40.0% 50.0% 60.0% 70.0% All N= 20,984 (Z= -47.84***) HCBS N= 6,844 (Z= -20.80***) NH N= 14,140 (Z= -7.44***) UC N= 5,071 (Z= -26.30***) UMDR N= 5,322 (Z= -0.65) ULDM N= 3,747 (Z= -16.31***)
Worsened Unchanged Improved
17
Table 1: Population’ characteristics in each setting of care
All HCBS NH NH units of care
UC UMDR ULDM
Population 20,984 6,844 14,140 5,071 5,322 3,747
Age
Mean (SD) 79.2 (8.3) 79.9 (8.5) 78.9 (8.3) 77.7 (8.3) 78.4 (8.0) 81.2 (8.1)
Gender (%)
Female / Male 57.7 / 42.3 55.7 / 44.3 58.7 / 41.3 60.9 / 39.1 57.3 / 42.7 57.9 / 42.1
Marital Status (%)
Married 45.5 49.9 43.3 42.4 43.3 44.5
Widow 37.0 34.2 38.3 37.9 37.9 39.4
Single/Divorced 17.6 15.9 18.4 19.7 18.8 16.1 Family/neighbour support (% yes) 44.4 58.2 38.7 42.5 31.4 43.8
Education level (%)
Illiterate 50.5 55.7 48.1 46.1 48.8 49.7
Literate 49.5 44.3 51.9 53.9 51.2 50.3
Medical conditions (%)
Circulatory system 31.8 22.3 36.2 31.1 40.9 36.4 Injury and poisoning 23.8 21.5 24.9 34.6 26.2 9.7
Neoplasms 7.2 12.3 4.9 3.6 3.8 8.1
Musculoskeletal system 6.8 7.5 6.5 12.5 3.3 2.9
Respiratory system 5.8 7.3 5.1 4.6 4.4 6.8
Nervous system 5.6 5.3 5.6 4.2 4.7 8.9
Skin and subcutaneous tissue 5.6 9.7 3.6 1.6 6.5 2.3
Mental illness 5.4 4.6 5.8 1.2 3.3 15.7
Cognitive status admission (%)
Bad 41.0 37.0 42.9 27.3 45.7 60.2
Unsatisfactory 10.8 8.9 11.6 11.4 13.4 9.4
Satisfactory 10.1 8.4 10.9 13.4 10.9 7.5
Good 38.1 45.7 34.5 47.8 30.0 22.9
Physical status admission (%)
Incapable 17.7 18.3 17.4 7.4 18.7 29.3
Dependent 52.8 50.7 53.8 51.8 60.1 47.6
Autonomous 14.0 13.5 14.2 18.2 11.4 12.8
Independent 15.5 17.5 14.5 22.6 9.8 10.3
Referral entity (%)
Hospital: General Surgery 6.4 5.7 6.7 8.9 7.2 3.2 Hospital: Internal Medicine 27.5 18.4 31.9 30.3 36.7 27.2
Hospital: Neurology 4.5 1.4 6.0 5.9 7.8 3.6
Hospital: Orthopaedics 18.9 14.6 21.0 35.3 18.8 4.7
Other entities 42.7 59.8 34.4 19.6 29.6 61.2
Length of care (days)
Mean (SD) 57.9 (47.3) 64.2 (56.9) 54.9 (41.4) 35.4 (18.3) 68.9 (40.4) 60.5 (53.3) Legend: HCBS: Home and Community-Based Services; NH: Nursing Homes; UC: Convalescence Units; UMDR: Medium-Term and Rehabilitation Units; ULDM: Long-Term and Maintenance Units; SD: Standard Deviation.
18
Table 2: Mortality rate and survival time in each setting of care
Settings
of care Mortality rate
Estimate median survival time (days)
95% C.I. p-value
Lower Lower
All 21.1% 197.0 186.6 207.4
Home and Community-Based Services 29.5% 173.0 159.5 186.5
X2 =173.3 ***
Nursing Homes 17.0% 200.0 189.2 210.8
UC 6.0% 288.0 75.5 500.5
X2
=412.3 ***
UMDR 18.0% 202.0 183.0 221.0
ULDM 30.5% 158.0 141.7 174.3
Legend: C.I.: confidence interval; UC: Convalescence Units; UMDR: Medium-Term and Rehabilitation Units; ULDM: Long-Term and Maintenance Units. X2: Log Rank test (Mantel-Cox); * significant at p<0.1; ** significant at p<0.05; *** significant at p<0.001
Table 3: Cox Proportional Hazard models predicting the time to death in individuals upon admission in NH and HCBS settings of care
Model 1: HCBS
(N= 6,571)
Model 2: NH (N= 14,020)
OR
Hazard Ratios
(95% C.I.) OR
Hazard Ratios (95% C.I.)
Lower Lower Lower Lower
Age 1,019 *** 1,013 1,025 1,030 *** 1,025 1,036
Gender
Male 1,237 *** 1,124 1,362 1,446 *** 1,329 1,573 Female Reference Reference Family or neighbour support Without support 0,695 *** 0,630 0,767 0,759 *** 0,699 0,825 With support Reference Reference
Education level
Illiterate - - - 1,088 ** 1,002 1,182 Literate Reference Reference
Medical conditions
Neoplasms 3,666 *** 3,043 4,417 2,389 *** 1,997 2,858 Mental illness 1,012 0,786 1,304 0,657 *** 0,525 0,823 Diseases of the nervous system 0,776 * 0,593 1,017 0,803 * 0,644 1,001 Diseases of the circulatory system 0,796 ** 0,656 0,967 0,669 *** 0,575 0,779 Diseases of the respiratory system 1,122 0,898 1,402 1,383 ** 1,150 1,663 Diseases of the skin and subcutaneous tissue 1,304 ** 1,065 1,597 1,523 *** 1,258 1,843 Disease of musculoskeletal system 0,416 *** 0,278 0,622 0,413 *** 0,277 0,616 Injury and poisoning 0,491 *** 0,376 0,640 0,675 *** 0,550 0,828
Other Reference Reference
Cognitive status at admission Bad 1,779 *** 1,568 2,019 1,789 *** 1,587 2,018 Unsatisfactory 1,358 ** 1,128 1,634 1,261 ** 1,073 1,482 Satisfactory 1,113 0,920 1,348 1,136 0,946 1,365
Good Reference Reference
Physical status at admission Incapable 1,453 ** 1,051 2,010 1,398 * 0,956 2,045 Dependent 1,130 0,823 1,552 0,961 0,659 1,401 Autonomous 0,983 0,659 1,467 1,119 0,695 1,802 Independent Reference Reference
Referral entity
Hospital: General Surgery 0,576 *** 0,454 0,730 0,993 0,838 1,176 Hospital: Internal Medicine 1,250 *** 1,108 1,411 1,219 *** 1,101 1,349 Hospital: Neurology 0,643 * 0,391 1,057 0,837 * 0,682 1,027 Hospital: Orthopaedics 0,622 ** 0,455 0,850 0,546 *** 0,441 0,676 Other entities Reference Reference Legend: C.I.: Confidence Interval; HCBS: Home and Community-Based Services; NH: Nursing Homes; UC: Convalescence Units; UMDR: Medium-Term and Rehabilitation Units; ULDM: Long-Term and Maintenance Units.
* significant at p<0.1; ** significant at p<0.05; *** significant at p<0.001
19
Table 4: Ordinal regressions predicting the cognitive and physical dependence levels at discharge
Model 1
Cognitive status at discharge
Model 2
Physical status at discharge
OR 95% C.I. OR 95% C.I.
Lower Lower Lower Lower Age 0.957 *** 0.953 0.962 0.967 *** 0.963 0.971
Gender
Male 1.069 * 0.994 1.150 0.937 * 0.877 1.002
Female Reference Reference
Marital Status
Married 0.897 ** 0.816 0.987 0.888 ** 0.815 0.967 Widow 0.907 * 0.821 1.001 0.924 * 0.845 1.011 Single/divorced Reference Reference
Education level
Illiterate 0.917 ** 0.857 0.982 0.918 ** 0.863 0.976
literate Reference Reference
Medical conditions
Neoplasms 1.462 *** 1.194 1.790 0.956 0.798 1.144 Mental illness 0.374 *** 0.307 0.456 2.496 *** 2.098 2.971 Diseases of the nervous system 0.894 0.749 1.068 0.980 0.829 1.158 Diseases of the circulatory system 0.913 0.800 1.043 0.710 *** 0.627 0.804 Diseases of the respiratory system 1.019 0.842 1.234 0.825 ** 0.689 0.989 Diseases of the skin and subcutaneous tissue 0.860 0.703 1.052 0.457 *** 0.375 0.556 Disease of musculoskeletal system 2.381 *** 1.945 2.916 2.004 *** 1.705 2.356 Injury and poisoning 1.172 ** 1.007 1.363 1.079 0.940 1.240
Other Reference Reference
Cognitive status at admission Bad 0.088 *** 0.081 0.096 0.359 *** 0.332 0.390 Unsatisfactory 0.253 *** 0.228 0.282 0.454 *** 0.408 0.505 Satisfactory 0.540 *** 0.483 0.604 0.814 *** 0.735 0.902
Good Reference Reference
Physical status at admission Incapable 0.433 *** 0.334 0.560 0.018 *** 0.014 0.022 Dependent 0.687 ** 0.533 0.886 0.061 *** 0.049 0.075 Autonomous 1.211 0.868 1.690 0.233 *** 0.178 0.304
Independent Reference Reference
Settings of care
UC 1.044 0.946 1.152 2.031 *** 1.866 2.210 UMDR 0.712 *** 0.649 0.781 1.094 ** 1.004 1.192 ULDM 0.516 *** 0.463 0.575 0.894 ** 0.807 0.989
HCBS Reference Reference
Referral entity
Hospital: General Surgery 1.449 *** 1.250 1.678 1.105 0.969 1.261 Hospital: Internal Medicine 1.202 *** 1.094 1.320 1.200 *** 1.098 1.311 Hospital: Neurology 1.260 ** 1.074 1.479 1.122 0.962 1.310 Hospital: Orthopaedics 1.430 *** 1.268 1.613 1.198 ** 1.081 1.329 Other entities Reference Reference Length of care (days) 1.001 ** 1.000 1.002 - - - Legend: CI: Confidence Interval; HCBS: Home and Community-Based Services; NH: Nursing Homes; UC: Convalescence Units; UMDR: Medium-Term and Rehabilitation Units; ULDM: Long-Term and Maintenance Units;
* significant at p<0.1; ** significant at p<0.05; *** significant at p<0.001;