© 2019, IRJET | Impact Factor value: 7.211 | ISO 9001:2008 Certified Journal
| Page 5777
Sentimental Prediction of Users Perspective through Live Streaming:
Text and Video analysis
Ashwin Rishi P.J, Akhil Kumar Reddy
1,2
Masters in Computer Science & Engineering, VIT University, SCOPE School, Vellore, India.
---***---Abstract -
With growing rate of website handlers in day to day activities. The analysis of the data specified by the user is essential to process the semantic analysis of any website. To improve the efficiency of the analysis we use Jeffrey Breen approach which helps to find the semantic orientation of the words in the streaming websites like twitter and YouTube using the API’s. The algorithm calculates the sentimental score and assigns an integer value for the word or sentence given by the user and that integer is used to calculate the score for the word given based up on the sentimental score calculated we categorize the result as positive or negative. So in this project we propose an Sentiment analysis of texts and videos of the website by being access to the tokens with the API key with both video and texts and performing with the sentiment analysis of data and publish the same to the mongoDB data server for future reference of data access. This implementation helps in user to access the API so as to get the user’ssentimental view of any search keyword.
Key Words: API, Data Analysis, Sentimental Analysis, Live
Streaming, Twitter, YouTube.
1. INTRODUCTION:
In traditional system, analyzing the users sentimental emotion of a particular website or domain using the particular keyword searched by the user or any admin of the network makes an tedious task and more time consuming additionally it takes more data storage in an efficient schema of mapping the values in the database for example. In stock market application the rates or the amount of shares for the particular firm may be researched in front before investing on the group of investments or single investments for that matter of fact and in that scenario user has an very limited period of time to process and invest the shares. So with the help of machine learning algorithms we can train and test the data to form an set of efficient classification for the sentimental analysis which in turn reduces the workflow and formation of various levels of service representation for each website and with the help of trained model we can classify or finalize the emotion for the keyword being discussed across the website that has been searched by the user of the same domain or the website
By training the word to the group of classification we will be able to classify the users opinion of the subject and the same can be used in the future resources so that there will be an effective resource to the business services and more such
analysis can be proposed to many online service which helps in effective growth in industry. With 5 billions videos being watched on YouTube each day and over 700 videos being shared in the twitter each minute and 5787 tweets per second across the globe we make use of these powerful tools of social media to determine the sentimental analysis for the given term.
Additionally, the data can be proposed to the online cloud services or to a local MongoDB service which stores document as the data. One among the major factor of considerations is that to view the log services or the history of transaction requested for the search term and upon for that request the mongoDB services can be used to fetch the values stored. The request to API access for each system has to be enabled for our service in order to search the keyword in the website through the API access. The access token retrieves an effective set of object to form the graphical representation that we can store in the database layer. In order to get the text form the API accessed which may also contain the emoticons and slang words the feature extraction has to be performed so that the data may only contain the set of words which we can train and test to form the set of classification resulting in the graph.
© 2019, IRJET | Impact Factor value: 7.211 | ISO 9001:2008 Certified Journal
| Page 5778
2. LITERATURE SURVEY
Barbosa et al. [1] designed a 2-step automatic sentiment analysis method for classifying tweets. The method used is noisy training set to reduce the labeling effort in developing classifiers. Firstly, they classified tweets into subjective and objective tweets. After that, subjective tweets are classified as positive and negative tweets to diminish the marking exertion in making these classifiers, of utilizing physically explained information to make the preparing information, as customary regulated learning approaches, influence wellsprings of boisterous names as the preparation information.
Celikyilmaz et al. [2] develop a pronunciation based word clustering method for normalizing noisy tweets. In pronunciation based word clustering, words having similar pronunciation are clustered and assigned common tokens. They additionally utilized content handling systems like allotting comparative tokens for numbers, html joins, client identifiers, and target association names for standardization. In the wake of doing standardization, they utilized probabilistic models to recognize extremity dictionaries. They performed grouping utilizing the BoosTexter classifier with these extremity vocabularies as highlights and got a diminished mistake rate.
Wu et al. [3] proposed a influence probability model for twitter sentiment analysis. If @username is found in the body of a tweet, it is influencing action and it contributes to influencing probability. Any tweet that begins with @username is a retweet that represents an influenced action and it contributes to influenced probability. They observed that there is a strong correlation between these probabilities.
Pak et al. [4] created a twitter corpus by automatically collecting tweets using Twitter API and automatically annotating those using emoticons. Using that corpus, they built a sentiment classifier based on the multinomial Naive Bayes classifier that uses N-gram and POS-tags as features. In that method, there is a chance of error since emotions of tweets in training set are labeled solely based on the polarity of emoticons. The training set is also less efficient since it contains only tweets having emoticons.
Balahur et al. [5] introduced EmotiNet, a conceptual representation of text that stores the structure and the semantics of real events for a specific domain. Emotinet used the concept of Finite State Automata to identify the emotional responses triggered by actions.
Xia et al. [6] used an ensemble framework for sentiment classification. Ensemble framework is obtained by combining various feature sets and classification techniques. In that work, they used two types of feature sets and three base classifiers to form the ensemble framework. Two types of feature sets are created using Part-of-speech information
and Word-relations. Naive Bayes, Maximum Entropy and Support Vector Machines are selected as base classifiers. They applied different ensemble methods like Fixed combination, Weighted combination and Meta-classifier combination for sentiment classification and obtained better accuracy.
Zhengzheng Liu et al. [7] processed sentimental analysis on the micro video by converting into text and assigning an score of integer value to all the words using the Chinese positive and negative words and also in the system mainly used PHP + MySQL + Apache based on the CodeIgniter framework to design an crawler system to acquire the data’s of review text of the micro video.
3. PROPOSED WORK
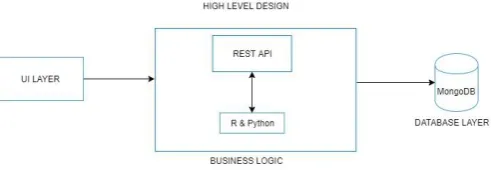
The proposed architecture involves in the three layered architecture. We are using the request are made through UI layer and the business layer as R programming and mongoDB to store the result dataset. The UI helps to visualize the data to the admin and the R is converted as an API request to process the incoming search keyword from the admin and the third layer MongoDB is used to store the dataset into data frame for future references.
The business layer which is of R is shown in fig 1.1 in which processing the data set and helps to train data and to validate for the modal we train. Initially, the data set from the website by accessing the API access token will be retrieved and generating a request to access the API of the website should also be tested and once an access is performed the search of keyword will be processed. The data generated is validated till the sentimental analysis provides the effective resources and yields an optimum output.
[image:2.595.310.556.618.703.2]The analysis of video for the analysis is also made so as to yield the maximum accuracy of the sentiment across the web for the requested search from the user. So as to process that we propose the Google’s YouTube API to process the videos that is performed in the python based upon the users request. The resulted analysis are stored to process for the existing R sentimental processing by that yielding an efficient processing of sentimental analysis.
FIG 1.1 Proposed Architecture.
© 2019, IRJET | Impact Factor value: 7.211 | ISO 9001:2008 Certified Journal
| Page 5779
text of data. The sentimental analysis of the system after passing the training data will generated graphically using the ggplot command in R. and the data can be connected to the mongoDb. The data generated must be transferred to the local mongodb machine if there is an terms of graphic images. The processing of sequences are. The modules are:
1. Data preprocessing. 2. Data analysis. 3. Modal visualization.
The data pre-processing involves in the removal of unwanted data in order to increase the efficiency and robustness of our system which does not contribute to our system
3.1 DATA PREPROCESSING:
The Data preprocessing involves in connection authentication and filtering of the received tweets for the analysis of modal. The authentication with the twitter has to be enabled so has to retrieve the tweets from the live streaming of sites. The TwitterR package is used to set the authentication for the given API and these API keys are generated in the twitter services for the developer accounts. Additionally, the credentials handshake is downloaded from each time when the application is authenticated. The tweets for the search keyword is retrieved and converted into data frame and all the texts in the data frame are pre-processed like removal of url’s , remove punctuation, lower case, remove words, strip whitespace. Processing the object of the API to retrieve the data’s as per the keyword received works an great deal since the auto for client is limited only an set of domains will be able to retrieved and with the processing amount of time must also be held in to account.
Before the pre-processing the data frame involves in the text of the tweets and other 12 fields which includes retweeted count and also the usernames of the people who tweeted and an Boolean value of is tweeted. We pre-process only the text in which the user has tweeted about. The pre-processing involves on removal of numbers, punctuations, and special characters and mostly the emoticons must be removed in order to process for the sentimental score. The data frame formed is stored in the mongoDB database for future data retrieval of the data frame for the number of tweets as required by the user. Here the data frame for the each word with frequency is mapped into the histogram of preprocessing values.
Additionally, the data frame only contains the formation of tweets generated from the twitter by the users across the globe for to improve the efficiency the analysis we also perform the analysis from the YouTube data reviews, YouTube API provides the authentication to retrieve and to download for the given URL and we in turn convert all the video downloaded to text and an filter of only past 6 months and the duration is of less than 20 mins since later the
conversion of music to text consumes more time on google speech API.
Since there are huge values of data being formed in the YouTube using tuber package we can form an set of ids being generated and where the python performs an series of steps of processing to form an data set of value from the YouTube and those includes in the conversion of an video from mp4 to wav and then to txt format. We use google speech recognition API to generate the set of text files which will me parsed to the existing data frame of analysis.
3.3
DATA ANALYSING:
[image:3.595.311.545.431.575.2]The preprocessed data has to be analyzed for various set of processing. The dataset after preprocessing will only have the text with the YouTube video analyzed and formed dataset like used in the publication [8]. The trained data must be formulated in terms of graphical or image representation to the user so that the admin can view the latest set of impacts on particular system. For the effective processing we use the breen’s approach in which for the each word count there will be an integer of frequency will be calculated and based upon the frequency it is compared with the negative and positive text that is predefined the finally produces an sentimental score for the sentences or the tweets by the various users.
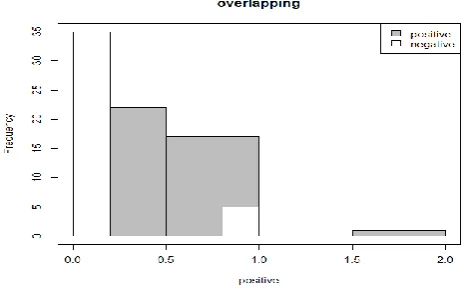
Figure 2. POSITIVE & NEGATIVE VALUES
The table represents the positive scores of the data tweets. Since there is no score between 1.0 to 1.5 for the tweet “KGF” the space have been empty in which each word is compared with the analysis of breen’s approach and finally made an frequency of value with hu and lu’s positive and negative word. Similarly, the negative frequency of values in which resulting in the histogram doesn’t have values between 1 and 1.5 it is also left empty as shown in Fig 2 with white and grey colors respectively.
© 2019, IRJET | Impact Factor value: 7.211 | ISO 9001:2008 Certified Journal
| Page 5780
response time to calculate the sentimental analysis on the given keyword.
The calculated values from the sentimental score of the system of breen’s approach are finally displayed in the form of the user sentimental analysis as shown in the figure 3 shown below. The Y-axis consists of emotion disgust, not satisfied, and equi-vocal, satisfied and joy and their respective score of analysis has been shown in the system of values. The user emotions are defined into five values of response and these values are represented in the histogram. For the #KGF the movie is between equivocal and satisfied for the number of 30 tweets.
[image:4.595.338.532.267.313.2]The data analysis are also taken with respective to the YouTube API which process the video files also. The number of id generated from the tuber package is saved in an text file and we use python to process the id files from the text file we read from python and finally process it for the sentimental analysis of those videos also and being converted from video to text.
Figure 3. User sentimental Analysis.
The ffmpeg package is used to transmit the conversion and bit rate of 720ps to 128ps of MP4 is being used in the conversion with “76x144 -vb 400k -acodec” specification added it to the data frame that process along with the tweets. Thus twitter + YouTube values of data yields better accuracy to the user requests. The emotion of five different values must be narrowed down to the binary results to view the final result of analysis in which it states either positive or negative of sequence values.
3.3
MODAL VISUALIZATION:
The final phase of the development system are in the binary result of all the analysis and to improve the efficiency of the algorithm with implementing with another set video analysis forms an data set and with the resulting data set of both the
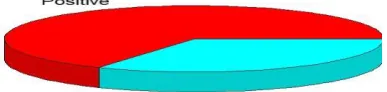
[image:4.595.42.284.360.544.2]text + video analysis an graphical chart between the values is of analysis of data sequences is developed. The analysis made from the breen’s approach is shown in the form of pie-3D graph in the system resulting in the positive or negative. The pie-3D can also be changed in any of the client requesting format for the development and research purpose we have taken only the pie-3D chart. As in mere future, the same results also can be sent to the client requesting mail or mobile services since only it takes another API to process the same
.
FIGURE 5. FINAL PREDICTIONS.
The final predictions shows that on the particular search keyword the sentimental analysis yielded the positive results and hence this shows that the people’s perspective on the keyword is also the same. The data formulated may change for every API response generated from youtube + twitter and may result in the different ratio of proportions but the accuracy of the results will remain the same. Additionally, with more enhanced analysis of search API the accuracy of predictions may get increased on the users tweets and more positive video comments.
4
.
PERFORMANCE EVALUATION AND RESULTS
4.1 Experimental Environment
:
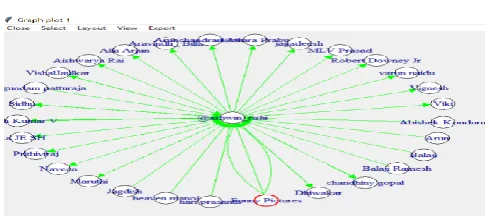
A new set of series of experimental evaluation is made from the live streaming data retrieved from twitter data which involves in accessing users API structure and to find the relations of the various user in the user account which will help in the authorized user of the service requestor may track of the information being viewed by his followers users in the account. It also gives an graphical image connected by the bi-directional relationship along the user account.
relations <- merge(data.frame(User = '@ashwin_rishi', Follower=friends), data.frame
(User = followers, Follower='@ashwin_rishi'), all=TRUE)
© 2019, IRJET | Impact Factor value: 7.211 | ISO 9001:2008 Certified Journal
| Page 5781
Figure 4. user relationships.
The user relationship shows different types of followers and the people who are subscribed to the user. The circular curve represents the followed back user and more enhanced graph of the relations can also be formed. It helps to see the user admin relations with each other and provides an efficient way to monitor the information among the user.
4.2 Storage Space:
With the experiments being performed one of the prime importance of consideration is the amount of storage space being performed for the each client request. In order, to retrieve back the logs for future references we are storing into the mongoDB database. Since its an document database it stores an _id for each data frame value which is much efficient to retrieve for logs. Also the video processing from the YouTube analysis consumes only upper boundary of five videos. So we use local database to be consumed and converted for the music file. Additionally, the space for the video storage depends upon the duration of the video generated from the pytube.
4.3 Storage Time:
The storage time is one of the prime factors of research values in the sentimental analysis. Since we deal with the texts and videos simultaneously .Experiments are also performed to analyses the storage time required by our approach. In real time processing the amount of time taken to response the requested data must be minimum. Since the processing of video depends upon the duration. The storage time may take in minutes unless in on super computers.
5. CONCLUSIONS:
In this manner the examination we made defines arrangement of clients viewpoint for the watchword given by the client. since the quantity of video investigation is less, subsequently bringing about the accuracy which may not be the 100 rate. Yet, this can be improved with the examination of different online life follows increasingly upgraded API customer access and substantial information as far as video investigation with progressively upgraded Terra Bytes of speed gave and improved handling execution of the server. With all the improved framework design we will most likely
convey the clients point of view on a theme sought by the client utilizing our nostalgic examination.
In mere future, this can be extended to perform on expansive arrangements of video information along with enhanced storage capacity to host and furthermore breaking down in at least one or more social media sites with live gushing information will yield the best ideal outcome.
ACKNOWLEDGEMENT:
Thanks to VIT University to provide the access for the IEEE scholar publications which helped to refer ample number of publications and also for me to complete the work with ease and additionally the research gate website in which the scholarly articles also provided great reference in finding the problem abstract and which helped me in improving the QOS in terms of the processing in the research.
REFERENCES
1. L. Barbosa and J. Feng, “Robust sentiment detection on twitter from biased and noisy data,” in Proceedings of the 23rd International Conference on Computational Linguistics: Posters, pp. 36–44, Association for Computational Linguistics, 2010.
2. A. Celikyilmaz, D. Hakkani-Tur, and J. Feng, “Probabilistic model-based sentiment analysis of twitter messages,” in Spoken Language Technology Workshop (SLT), 2010 IEEE, pp. 79–84, IEEE, 2010.
3. Y. Wu and F. Ren, “Learning sentimental influence in twitter,” in Future Computer Sciences and Application (ICFCSA), 2011 International Conference on, pp. 119– 122, IEEE, 2011.
4. A. Pak and P. Paroubek, “Twitter as a corpus for sentiment analysis and opinion mining,” in Proceedings of LREC, vol. 2010, 2010.
5. A. Balahur, J. M. Hermida, and A. Montoyo, “Building and exploiting emotinet, a knowledge base for emotion detection based on the appraisal theory model,” Affective Computing, IEEE Transactions on, vol. 3, no. 1, pp. 88–101, 2012.
6. R. Xia, C. Zong, and S. Li, “Ensemble of feature sets and classification algorithms for sentiment classification,” Information Sciences: an International Journal, vol. 181, no. 6, pp. 1138–1152, 2011.
7. Zhengzheng Liu, Nan Yang and Sanxing Cao, "Sentiment-analysis of review text for micro-video," 2016 2nd IEEE International Conference on Computer and Communications (ICCC), Chengdu, 2016, pp. 526-530. 8. E. Chu and D. Roy, "Audio-Visual Sentiment Analysis for
Learning Emotional Arcs in Movies," 2017 IEEE International Conference on Data Mining (ICDM), New Orleans, LA, 2017, pp. 829-834.