Design and Reliability-based
Optimization of the Piezoelectric Flex
Transducer
By
Liheng Luo
Thesis submitted for the degree of Doctor of Philosophy
at Lancaster University
2
ACKNOWLEDGEMENTS
To begin with I would like to express my gratitude to those who have supported me
over the last four years whilst conducting this research. First of all, I would like to
express my deepest gratitude to my Supervisor, Prof Jianqiao Ye, for giving me the
opportunity to do this PhD and for sharing his great ideas with me. I would also like to
express my gratitude to Dr. Dianzi Liu, from the University of East Anglia, for his
guidance and for sharing his ideas in which to solve problems throughout the research.
I am thankful to Prof Meiling Zhu for her technical support on ANSYS APDL in the
early stages of this research, and to Dr. A. Daniels whose work motivated this research.
I am also thankful to my parents, my mother Shaojie Chen and father Peigen Luo, who
have financially supported my tuition and living costs during the Ph.D. programme.
The love and encouragement they have given me during this challenging time has been
immeasurable.
Finally, on a personal note, I am thankful to my girlfriend Yuelin Ma during this
stressful time. Also my best friends, mainly Wenjie He, Yanzi Zhang, Guosheng Huang,
ABSTRACT
In recent years, the rapid development of low power consuming devices has resulted in
a high demand for mobile energy harvesters. The main contribution of this thesis is to
optimize the novel piezoelectric energy harvesting device called the piezoelectric flex
transducer, which was developed by other researchers for the purpose of harvesting
bio-kinetic energy from human gait. The optimization uses both conventional and
reliability-based optimization approaches in order to improve the electrical power
generation from the device. First, the piezoelectric flex transducer is modeled by using
the finite element method with the finite element analysis software ANSYS APDL.
Seven geometric parameters of the piezoelectric energy harvester are considered as
design variables. A set of designs with different design variables are generated by the
Design of Experiment technique, the generated designs are analyzed by the finite
element model and the surrogate models that representing the behavior of the FEM are
built by these inputs and the results of the FEA. Conventional optimization, taking into
consideration different safety factors, is driven by the von mises stress of the device
and is then searched by a mathematical algorithm with the assistance of surrogate
models. To improve the efficiency of the surrogate modeling, a multi-level surrogate
modeling approach for fast convergence will be introduced and the method will be
demonstrated by optimizing the PFT device.
As the optimal design is subject to a low stress safety factor, which may be unreliable
4
design are analyzed. A Monte Carlo simulation is employed to analyse how the
electrical power output has been affected by the input parameters with parametric
uncertainties. The design parameters of a set of designs are perturbed around the
optimal design parameters in order to imitate the optimal design under parametric
uncertainties. The effects of parametric uncertainties are then evaluated by the
constructed surrogate models. The method for improving the product reliability will
LIST OF PUBLICATIONS
Journals
Luo L, Liu D, Zhu M and Ye J, 2017, ‘Metamodel-assisted design optimization of piezoelectric flex transducer for maximal bio-kinetic energy conversion’, Journal of Intelligent Material Systems and Structures 1–11
6
LIST OF FIGURES
Figure 1.1 developed PFT energy harvester for scavenging bio-kinetic energy from
human footfall [10]. ... 22
Figure 1.2 FEM of Cymbal device [10]. ... 23
Figure 1.3 Comparison of simulation and experimental results for electrical power at 5Hz and 2Hz. [10] ... 24
Figure 1.4 Geometric design variables of PFT in previous research [10]. ... 25
Figure 1.5 Design of Piezoelectric flex transducer. ... 26
Figure 1.6 Comparison of simulation and experimental results of PFT resistance spectrum response, for PFT under a force load at 2Hz over two different force loads 1kN and 0.75kN. [10] ... 30
Figure 2.1 Structure of piezoceramic (a)before polarization (b)after polarization. ... 40
Figure 2.2 Coordinate system and axis nomenclature of piezoelectric materials. ... 42
Figure 2.3 Schematic diagram of vibration energy harvester [47]. ... 48
Figure 2.4 Distributed parameter model of piezoelectric material. [54] ... 50
Figure 2.5 Schematic diagram of cantilevered PEH. ... 52
Figure 2.6 Structure of (a) unimorph (b) bimorph piezoelectric cantilevered beam. .. 52
Figure 2.7 Schematic of the bending–torsion unimorph cantilever beam [66] ... 54
layers [67] ... 55
Figure 2.9 (a) Schematic diagram of cymbal transducer (b) Force analysis of the cymbal transducer [10]. ... 56
Figure 2.10 3D sketch of PEH with two cymbal transducers [71] ... 59
Figure 2.11 Sectional schematic diagram of the slotted cymbal design [73] ... 60
Figure 2.12 Design of the circumferential slotted-cymbal transducer [70] ... 60
Figure 2.13 (a) Traditional cymbal design (b) new design for the higher mechanical load [75] ... 61
Figure 2.14 Structure of the developed PFT [76] ... 62
Figure 2.15 Schematic diagram of cymbal transducer with geometric parameters [76] ... 63
Figure 2.16 The FEM of PFT with components and mesh ... 67
Figure 2.17 Experiment set up for PFT testing [10]. ... 68
Figure 2.18. The equivalent circuit of the PFT device [10]. ... 69
Figure 2.19 Comparison between experiment and simulation results of PFT device under input load at 5Hz. [10] ... 69
Figure 2.20 Three types of factorial design: (a) 2III3 Full Factorial (b) 2III3−1 Fractional Factorial (c) Central Composite Design ... 75
Figure 2.21 Schema of single input neural network [99]... 80
8
Figure 2.23 A flowchart of Genetic Programming methodology. ... 85
Figure 2.24 Crossover with one-cut point method. (a) Binary string before crossover (b)
after crossover [114] ... 93
Figure 3.1. Mesh and boundary conditions of the original FE model. [10] ... 97
Figure 3.2 Von mises stress against level of mesh refinement. ... 99
Figure 3.3 Electric output against decreasing size of element: (a) power (b) voltage (c)
current ... 102
Figure 3.4 variations of FEM analysis against time of variations. ... 104
Figure 3.5 FE model of PFT with (a) original mesh (b) appropriate mesh. ... 106
Figure 3.6 Comparison of the (a) power outputs (b) von mises stress from the current
model and the original model. ... 107
Figure 4.1 CAD sketch and dimensions of the developed PFT ... 110
Figure 4.2 Geometric design parameters of the PFT to be optimized ... 111
Figure 4.3 Minimum distances between points in 140–point optimal Latin hypercube
(OLH) DoE ... 116
Figure 4.4 Indications of the differences between the normalized von mises stress
response (predicted) and the training data (measured) ... 118
Figure 5.1 Surrogate model using an infill points strategy descending to a local
optimum [116] ... 125
Figure 5.3 Demonstration of the developed multi-level surrogate modeling strategy.
... 129
Figure 5.4 Minimum distances between points generated by OLH within the local design space. ... 134
Figure 5.5 Optimal results of the PFT device with different safety factors. ... 139
Figure 6.1 CAD of the PFT with optimal geometric parameters. ... 144
Figure 6.2 Histograms of the generated design parameters for the MCS. ... 148
Figure 6.3 Scatter plots of the normalized electrical power against the perturbation of the design variables. ... 152
Figure 6.4 Tornado diagram of the power output against the influence of 7 design variables. ... 154
Figure 6.5 Scatter plots of the normalized von mises stress of the PFT against the values of design variables under uncertainties. ... 158
Figure 6.6 Tornado diagram of the von mises stress against the influence of 7 design variables. ... 159
Figure 6.7 Histogram and the normal distribution function fitting of normalized power output by the MCS method. ... 161
Figure C.1 Input for SQP optimization in optimization tool ... 205
Figure C.2 Input for GA optimization in optimization tool ... 206
10
LIST OF TABLES
Table 1.1 List of design variables of PFT in previous research. ... 27
Table 2.1 Power densities of harvesting technologies. ... 38
Table 2.2 Geometric parameters of PFT before optimization ... 64
Table 2.3 Material properties used in the study of PFT ... 66
Table 2.4 Optimized design parameters of PFT ... 68
Table 3.1 Number of nodes and elements for different mesh refinements. ... 100
Table 3.2 Numerical results of FE model against decreasing size of element ... 103
Table 3.3 Variations of outputs on different mesh reductions. ... 105
Table 4.1 Boundaries of Design variables ... 112
Table 4.2 Optimal design by SQP with three different starting points. ... 119
Table 4.3 Comparison of structural and electrical responses between four different designs... 120
Table 4.4 Design variables of PFT device before and after optimization. ... 121
Table 5.1 Optimal design search by GA and its FEA validation. ... 132
Table 5.2 Bounds of 7 design variables for local exploitation. ... 133
Table 5.3 Optimal design search by SQP and its FEA validation. ... 135
Table 5.5 Optimal solution with SF2 and original design. ... 137
Table 5.6 Original design and optimal designs subjected to different SF. ... 138
Table 6.1 Optimal design variables of the PFT subject to a SF 1.0. ... 146
Table 6.3 Probabilities of the power output of the generated designs that achieve 6
different target values. ... 163
Table 6.4 Design parameters with improved reliability and their standard deviation
under parametric uncertainties. ... 164
Table 6.5 Probabilities of the power output of new generated designs with improved
12
Nomenclature
Acronyms
APDL ANSYS Parametric Design Language
ANN Artificial Neural Network
CPC-FEM Coupled piezoelectric-circuit finite element model
CO2 Carbon dioxide
CAD Computer-aided design
COV Coefficient of variance
DoE Design of Experiment
EA Evolution Algorithm
FEA Finite Element Analysis
FEM Finite Element Model
FE Finite Element
FOM Figure of merit
GA Genetic Algorithm
GP Genetic Programming
HSG Heel Strike Generator
KDP Potassium Dihydrogen Phosphate
LP Linear Programming
MCS Monte Carlo Simulation
MEMS Micro Electromechanical System
PFT Piezoelectric Flex Transducer
PZT Lead Zirconate Titanate
PEH Piezoelectric Energy Harvester
PDF Probability distribute function
POF Probability of failure
QP Quadratic Programming
RSM Response Surface Method
RBF Radial basis function
SQP Sequential Quadratic Programming
SLP Sequential Linear Programming
TEG Thermoelectric generator
2-D 2 Dimensions
3-D 3 Dimensions
Variables
C covariance
D total length
Dc
cavity length
Da apex length
d𝑖𝑗 piezoelectric strain constant
𝐷𝑑𝑖𝑠𝑝 displacement
dij 2
/𝜀𝑟𝑖𝑗𝑇 figure of merit
14
H height
tc caps thickness
tp thickness of the piezoelectric material
J joint length
k𝑖𝑗 piezoelectric coupling coefficient
k spring constant
m seismic mass
P number of points
Pavg
average electric power
Pn normalized electrical power
p instantaneous power
Q mechanical quality factor
R load resistor
𝑟 correlation coefficient 𝑅2 sum of squared residuals
S𝑖𝑗 elastic compliance
sE piezoelectric elastic compliance at constant electric field
𝑆𝑆𝑟𝑒𝑠𝑖𝑑 sum of the squared residuals
𝑆𝑆𝑡𝑜𝑡𝑎𝑙 sum of the squared differences from the mean of the dependent variable
T kinetic energy
ts thickness of substrate layer
We external energy
w width
𝑌0 amplitude of vibration
𝜀𝑟𝑖𝑗𝑇 piezoelectric relative dielectric constant at constant stress
𝜁 damping ratio
θ angle of the endcap
μ mean value
ρ density
𝜎m
von mises stress
𝜎𝑦 yield stress
σ standard deviation
ω vibration frequency
16
Table of Contents
ACKNOWLEDGEMENTS ... 2
ABSTRACT ... 3
LIST OF PUBLICATIONS ... 5
LIST OF FIGURES ... 6
LIST OF TABLES ... 10
Nomenclature ... 12
Chapter 1 Introduction ... 21
1.1 Introduction ... 21
1.2 Motivation for this research ... 22
1.2.1 The PFT device ... 22
1.2.2 Optimization of PFT... 26
1.2.3 Power requirement ... 28
1.2.4 Reliability-based optimization ... 30
1.3 Aim ... 31
1.4 Objectives ... 32
1.5 Thesis structure ... 32
2.1 Energy harvesting ... 35
2.2 Piezoelectric material ... 38
2.2.1 Piezoelectricity ... 38
2.2.2 Material properties ... 44
2.3 Piezoelectric energy harvesters... 46
2.3.1 The modeling of the piezoelectric energy harvester ... 47
2.3.2 Design of piezoelectric energy harvester ... 51
2.3.2.1 Cantilevered type ... 51
2.3.2.2 Cymbal type ... 55
2.4 The PFT device ... 62
2.4.1 Construction ... 62
2.4.2 The developed CPC-FE model of PFT ... 66
2.5 Optimization techniques ... 70
2.5.1 Finite Element (FE) method... 70
2.5.2 Design of Experiment (DoE) ... 73
2.5.3 Surrogate modeling ... 76
2.5.3.1 Interpolation ... 77
2.5.3.2 Polynomial fitting and Response Surface Method (RSM) ... 78
18
2.5.3.4 Kriging ... 82
2.5.3.5 Genetic Programming (GP) ... 83
2.5.4 Numerical optimization techniques ... 87
2.5.4.1 Sequential Linear Programming (SLP) ... 88
2.5.4.2 Sequential Quadratic Programming (SQP) ... 90
2.5.4.3 Genetic Algorithm (GA) ... 91
2.6 Summary ... 94
Chapter 3Further development of the FE model of the PFT ... 95
3.1 Convergence analysis of the developed PFT ... 96
3.2 Model validation ... 106
3.3 Summary ... 108
Chapter 4Surrogate model assisted design optimization of the PFT ... 109
4.1 Problem description ... 109
4.2 Latin hypercube Design of Experiment ... 114
4.3 Building surrogate models by Genetic Programming ... 116
4.4 Optimal design search by Sequential Quadratic Programming (SQP) ... 118
4.5 Optimal design verified by FEM ... 119
4.6 Summary ... 122
PFT ... 123
2.4 Advanced sampling strategy for constructing surrogate models ... 124
5.2 Multi-level surrogate modeling strategy ... 125
5.3 Optimization of the PFT using a multi-level surrogate modeling strategy .. 130
5.4 Summary ... 140
Chapter 6Sensitivity and Reliability Analysis of the Optimal PFT ... 142
6.1 Uncertainty Analysis... 143
6.2 Sensitivity analysis of the optimal PFT ... 146
6.3 Reliability-based optimization of the PFT... 162
6.4 Summary ... 166
Chapter 7Conclusions and future work ... 168
7.1 Conclusions of the research ... 168
7.1.1 Improvement in accuracy of the developed CPC-FE model of the PFT .... 169
7.1.2 Surrogate model assisted optimization of the PFT... 170
7.1.3 Multi-level surrogate modeling method ... 171
7.1.4 Sensitivity and Reliability analysis of the optimal design ... 173
7.2 Future work... 174
7.2.1 Further optimization of the PFT ... 174
20
Bibliography ... 177
Appendix A ... 188
Appendix B ... 200
Appendix C ... 204
Chapter 1
Introduction
1.1
Introduction
In recent years, the rapid development of low power consuming devices, such as aircraft
structural health monitoring devices [1] and portable communication devices [2], have
resulted in high demands for mobile energy harvesters, whose primary function is to
reduce the cost of battery replacement. Consequently, the energy conversion efficiency
of energy harvesters has become a challenging topic for researchers because the
low-power output of the mobile energy harvesters cannot satisfy the high-low-power
requirement of the devices.
There are many energy resources that can be harvested from the ambient environment.
According to Harb [3], micro-energy, which is produced on a small-scale from a low
carbon source, can be mechanical, electromagnetic, thermal, electrical, solar or
biological energy. Various micro energy harvesters have been designed to harvest
energy from the ambient environment and to power mobile devices, such as the
wearable thermoelectric generator (TEG) [4] and the cantilevered bimorphs
piezoelectric vibration harvester [5]. The development and application of micro-scale
energy harvesters, including thermoelectric, thermo-photovoltaic, piezoelectric, and
microbial fuel cell energy harvesters, have been reviewed by Krishna and Mohamed
[6]. Piezoelectric energy harvesting has been a topic of great interest since piezoelectric
22
number of reviews specifically on piezoelectric energy harvesters and piezoelectric
materials [7-9], which have evidenced the recent and rapid development of this special
form of energy harvesters.
1.2 Motivation for this research
1.2.1 The PFT device
In order to power the Bluetooth communication signal node by harvesting bio-kinetic
energy from human footfall, Daniels [10] developed the piezoelectric energy harvester
called Piezoelectric Flex Transducer (PFT). This novel piezoelectric harvester was
developed from the fundamentals of Cymbal transducer. The concept of harvesting
bio-kinetic energy from human footfall is shown as Figure 1.1. The PFT is originally
designed for specialised systems such as in defense, mountaineering or as part of a
wearable health monitoring system [10]. The following paragraph will introduce the
[image:22.595.255.383.527.669.2]basic function and configuration of the Cymbal transducer.
Figure 1.1 developed PFT energy harvester for scavenging bio-kinetic energy from
human footfall [10].
and has potential to harvest bio-kinetic energy, has been widely researched. The
structure, function and application of the Cymbal device were reviewed by Newnham
et al. [11]. The concept of endcaps and the piezoelectric disk was reported by Kim et al.
[12]. They found that the power output increased by 40 times compared to the use of a
piezoelectric disk alone. However, the traditional Cymbal transducer was unable to
stand more than 50N which means it cannot harvest the bio-kinetic energy from human
footfall. In order to develop the Cymbal device for the purpose of bio-kinetic energy
harvesting, Daniels [10] first set up the coupled piezoelectric-circuit finite element
model (CPC-FEM) for the Cymbal device by using ANSYS Parametric Design
Language (APDL) (Version 13) [13]. APDL is the multi-physics FEA software to
investigate how the geometric parameters affect the electric output of the Cymbal
energy harvester. The developed CPC-FEM of Cymbal is shown in Figure 1.2.
Figure 1.2 FEM of Cymbal device [10].
The CPC-FEM of Cymbal device has been validated by comparison between
24
simulation and experimental output average electric powers (Pavg) of both load
frequencies of 2Hz and 5Hz along the varying resistor load from 0MΩ to 7MΩ have
been plotted. These results show that the developed CPC-FEM closely correlated with
experimental results. The average electric power for the harmonic analysis is calculated
by:
𝑃𝑎𝑣𝑔 =𝑉𝑟𝑚𝑠
2
𝑅 = 𝑉2
2𝑅 (1.1)
where 𝑉𝑟𝑚𝑠 is the root mean square voltage of the harmonic analysis and R is the load resistance.
Figure 1.3 Comparison of simulation and experimental results for electrical power at
5Hz and 2Hz. [10]
Based on the validated CPC-FEM, the model of Piezoelectric Flex Transducer (PFT) is
developed by reducing the stress when the load from the endcaps transfers to the
piezoelectric material. In order to achieve this, the area of the vulnerable adhesive
interface between the endcap and the piezo disk is enlarged and substrate layers are
added. The piezoelectric flex transducer is made into a rectangular shape to retrofit into
R
footfall. The design of PFT is shown as Figure 1.4 with its design variables.
Figure 1.4 Geometric design variables of PFT in previous research [10].
The CPC-FEM of PFT is created for the analysis of electrical power output. It is
composed of the top endcap, bottom endcap, substrate layers and piezoelectric material
as shown in Figure 1.5. In this FE model, SOLID226 is selected as the element type for
the piezoelectric disk, which is a couple field hexahedral element type consisting of 20
nodes. It is able to analyse either piezoelectric structural performance or irregular
shapes. SOLID95 is selected as the element type for endcaps which is also a hexahedral
element type with 20 nodes. CIRCU94 is used for the resistor and is connected between
the positive and negative electrodes. In the previous research, the material and
geometric parameters are selected by employing the traditional varying one variable a
time method in order to improve the power output of the PFT energy harvester. For the
material selection, the study varied each design variables a time while remaining other
parameters and the optimal value of each parameter were collected, finally, the optimal
values were used to compared with the existing materials’ properties for material
selection. By comparing 5 metal materials and 20 piezoelectric materials, Austenitic
26
which is one of the soft piezoelectric ceramics (manufactured by DeL Piezo Specialties
[image:26.595.112.518.142.335.2]LLC, USA) is a selected piezoelectric material.
Figure 1.5 Design of Piezoelectric flex transducer.
1.2.2 Optimization of PFT
The PFT had been optimized by the previous researcher using the traditional
one-factor-a-time methodology. The optimization procedure explains as follows:
First, 9 geometric parameters and 6 material properties are selected as design variables.
Geometric design variables are shown in Figure 1.4 with the 2-D view of PFT device,
they are: total length (D), cavity length (Dc), width (w), apex length (Da), height (H),
caps thickness (tc), thickness of the piezoelectric material (tp), joint length (J) and angle
of the endcap (θ). All design variables including geometric parameters and material
properties are listed in Table 1.1, the material properties selected as design variables in
previous research are: elastic compliance (s11), piezoelectric strain constant (d11),
piezoelectric voltage constant (g11), relative dielectric constant (𝜀𝑟33𝑇), piezoelectric
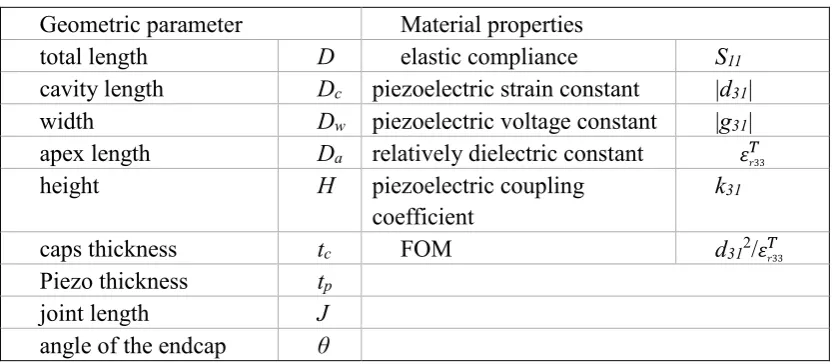
Table 1.1 List of design variables of PFT in previous research.
Geometric parameter Material properties
total length D elastic compliance S11
cavity length Dc piezoelectric strain constant |d31|
width Dw piezoelectric voltage constant |g31|
apex length Da relatively dielectric constant 𝜀𝑟33 𝑇
height H piezoelectric coupling
coefficient
k31
caps thickness tc FOM d312/𝜀𝑟33
𝑇
Piezo thickness tp
joint length J
angle of the endcap θ
The optimization procedure was achieved by employing ANSYS Parametric Design
Language (APDL), a finite element tool for the parameterized modeling of the PFT.
Before the simulation was carried out, several boundary conditions were applied as
follows:
• A total uniformly distributed load of 1kN was applied on top of the device, shown
as the force F in Figure 1.4.
• A fixed base was applied on the bottom surface, which is the apex of the bottom
endcap of the device.
• 2 electrodes were applied on the top and bottom surface of the piezoelectric
material.
• The load resistor was connected between 2 electrodes.
By varying one design variable at a time whilst holding the others as constant, the
28
the PFT device. Results showed that the optimal design successfully improved the
power output of the PFT by 37.5%. However, the disadvantage of this methodology is
that it ignores the interaction between design variables. For multivariable design
problems, the changes of a single variable may change the optimal values of other
variables since the optimal design is a combination of multiple variables.
This research focuses on maximizing the electrical power output of PFT by using
surrogate model assisted optimization approaches. The PFT device will first be modeled
by Finite Element Model (FEM) and then analyzed by the Finite Element Analysis
(FEA) in order to replace the prototype of the device for this research. Seven geometric
parameters are considered as design variables in the optimization procedure. In order
to find the relationship between input variables and the generated electrical power,
surrogate models constructed by Genetic Programming (GP) are employed to represent
the FEA of the device and to predict the optimal design. To demonstrate the advantage
of this optimization method, firstly, a safety factor of 2.0 respect to the von mises stress
which is employed in the previous research will be applied to find the optimal design.
Then, the safety factor will be further reduced to improve the power output of the PFT
energy harvester.
1.2.3
Power requirementThe original purpose of developing the novel PFT energy harvester is to power up the
wireless communication signal node using bio-kinetic energy from human footfall in
order to replace the use of battery. As mentioned by Daniels [10], the weight of batteries
enable the electric power harvested from the footfall helps to reduce the fatigue of the
soldier.
As the recent development of MEMS, many MEMS devices with low power
consumption are able to powered by mobile energy harvester such as the PFT device.
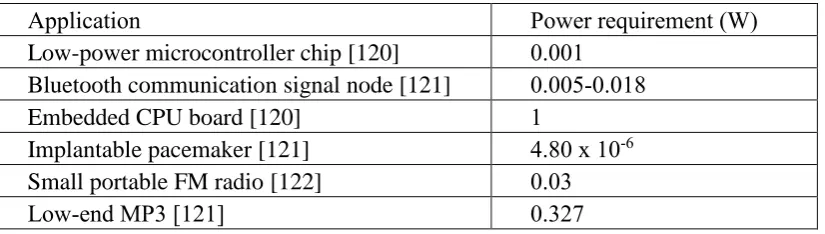
Typical electronic applications with low-power consumption are list in Table 1.2. It is
shown that the Bluetooth communication signal is able to operate under a power range
of 0.005-0.018W. The PFT device optimal by previous researcher is able to generate a
power of 5.6mW which is able to generate a sufficient power for the Bluetooth
communication signal with poor quality of signal. This pool quality of signal may lead
to some critical aspects, for example, for a soldier with personal role radio which is
used to receive commands away from the base. It is dangerous if the radio operates with
a pool signal in the volatile battle field.
As a result, it is important for this research to improve the power output of the novel
PFT in order to improve the quality of the communication signal, the PFT will need to
be optimized so that a good-quality signal of Bluetooth communication signal can be
[image:29.595.114.527.601.718.2]power up by the energy harvested from human footfall.
Table 1.2. Power requirements of some typical electronic applications.
Application Power requirement (W)
Low-power microcontroller chip [120] 0.001 Bluetooth communication signal node [121] 0.005-0.018
Embedded CPU board [120] 1
Implantable pacemaker [121] 4.80 x 10⁻⁶
Small portable FM radio [122] 0.03
30
1.2.4 Reliability-based optimization
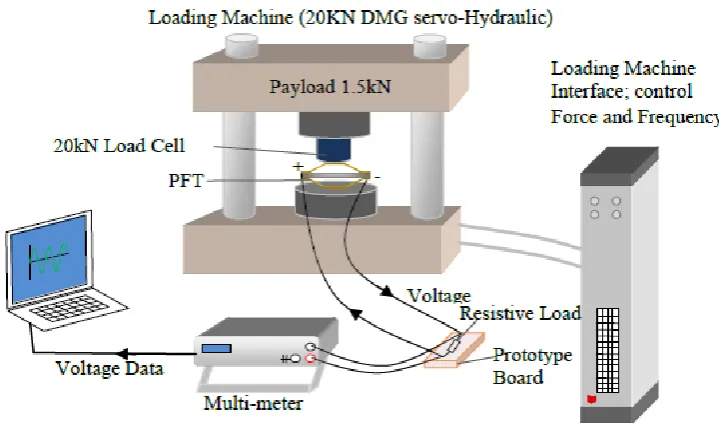
Uncertainties exist in every manufacturing process in the real-world. The PFT device
had been fabricated and tested by A. Daniels [10] following optimization by the
single-factor-a-time methodology, which is explained in Section 1.2.2. The product had been
tested by subjecting 1kN load and 0.75kN load with the frequency of 2Hz, which has
the same load condition as the FEA simulation. A comparison between the FEA result
[image:30.595.147.486.287.460.2]and the experimental test result is shown in Figure 1.6.
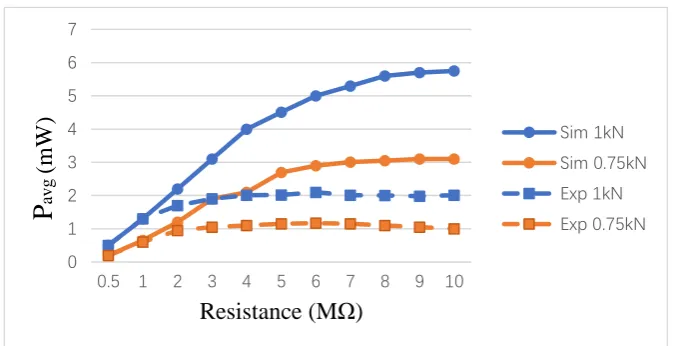
Figure 1.6 Comparison of simulation and experimental results of PFT resistance
spectrum response, for PFT under a force load at 2Hz over two different force loads
1kN and 0.75kN. [10]
The experimental results of the fabricated PFT device was showing a significant
reduction on the power output compared to the FE simulation results. The main reasons
for this phenomenon are:
• The inaccuracy of the developed CPC-FEM model. The mesh of the FEM
developed in the previous research for geometries and material selection is coarse.
This is because the FEM with coarse mesh can be used to analysis with less 0 1 2 3 4 5 6 7
0.5 1 2 3 4 5 6 7 8 9 10
computational time but reduced accuracy.
• Inappropriate equipment used in the experiments. As mentioned by the previous
researcher, the experiment used a 20kN loading machine to operate the 1kN load.
This may lead to some non-negligible error on the experimental results.
• The uncertainties of the fabrication procedure. The PFT may subjected to
parameter uncertainties during the fabrication, since the uncertainties exist in the
real world. The optimal parameters may be different due to the uncertainties, as a
result, there will be an error between the FEM simulation and the experiment
results.
In this research, the focus will be the first and last of these reasons. Firstly, the accuracy
of the developed CPC-FEM model will be investigated and the FEM will be further
developed to improve the accuracy of representing the behaviors of the PFT energy
harvester. Then, the sensitivity and reliability of the optimal design under parametric
uncertainties will be investigated. The Monte Carlo Simulation (MCS) will be
employed to analyze the sensitivity and the reliability of the optimal design, and finally,
a reliability-based optimization will be demonstrated to improve the reliability of the
design within the uncertainties of the real-world.
1.3 Aim
The aim of this research is to improve the power generation of the novel piezoelectric
energy harvesting device called PFT in order to obtain a higher electric output in
32
and reliability of the optimal design will be considered to reduce the effects of
parametric uncertainties which exist in the real-world so that the power output can be
further improved by reducing the stress safety factor.
1.4 Objectives
1. To improve the accuracy of the developed CPC-FEM for the PFT energy
harvester so that it can represent the behavior of the PFT and can be used to
accurately predict the optimal design.
2. To develop surrogate models that represent the relation between input and output
parameters of PFT device. The surrogate models are to be used to replace the
FEA of the PFT device.
3. To find the optimal design of PFT by using mathematical algorithms to search for
the solution within the surrogate model subject to different safety factors.
4. To develop a multi-level surrogate modeling approach for the optimization of
PFT in order to construct surrogate models with a high converge rate so that the
optimal design can be found efficiently.
5. To analyze the sensitivity and reliability of the optimal design and improve the
design by reducing the effects of parametric uncertainties.
1.5 Thesis structure
including a brief introduction of the developed novel piezoelectric energy harvester
PFT which are optimized in this research.
Chapter 2 presents a literature review, in which the relevant history of piezoelectricity
and the application of piezoelectric materials are discussed. An overview of
piezoelectric energy harvester is then introduced as well as the fundamentals and the
development of the PFT energy harvester. The optimization techniques which are
employed in this research to maximize the generated electric output of the PFT device
are introduced, including the Design of Experiment, Genetic Programming, Sequential
Quadratic Programming, Genetic Algorithm, etc.
Chapter 3 presents a further advancement of the developed CPC-FEM of the PFT
energy harvester. The convergence of the original FEM is analyzed in order to
investigate its accuracy. In order to receive a more accurate FEM in this research, a
trade-off between the computational time and the accuracy of the FE model will be
discussed.
Chapter 4 presents the procedure for optimizing the PFT energy harvester that
employed surrogate model assisted optimization method. In this study, the design space
including 7 design variables of the PFT will be sampled by the Optimal Latin
Hypercube DoE technique. The generated samples will be analyzed by FEA and the
data will be collected for constructing surrogate models using the Genetic Programming.
The surrogate models representing the relation between input and output parameters of
PFT are then used to find the optimal design of the PFT subject to the safety factor of
34
Programming and the optimal design will be validated by FEM.
Chapter 5 presents a global/local multi-level surrogate modeling method to construct
the surrogate models and to find the global optimal design of the PFT device efficiently.
This multi-level surrogate modeling method employs the Latin Hypercube DoE to
sample the global design space using limited sampling points and find the vicinity of
the optimal design. The extended Optimal Latin Hypercube DoE is then employed to
exploit the vicinity. In this study, the global optimal design is found using Genetic
Algorithm. The optimal design obtained by different optimization methods is compared
and discussed to illustrate the advantage of the multi-level surrogate modeling method.
Chapter 6 investigates the effects of real-world uncertainties to the optimal PFT design.
Uncertainties considered in this study are the parameter perturbations of the predefined
design variables during the manufacturing process. Monte Carlo Simulation method is
employed to observe the sensitivity and reliability of the optimal design under
uncertainties. A set of designs that the design variables normally distributed around the
optimal values are used to imitate the parametric uncertainties of the real-world product,
the effects of the uncertainties is then observed by evaluating the set of designs with the
constructed surrogate models. As the optimal design of PFT subjected to a low safety
factor is unreliable under the real-world uncertainties, a method for improving the
reliability of the PFT is also introduced and demonstrated in this chapter.
Chapter 7 discusses the results of different optimization techniques for the PFT and
Chapter 2
Literature review
This chapter provides a background to this research. First, the literature review
describes the importance of alternate energy sources to replace the traditional fossil fuel
products and the higher power density of piezoelectric energy harvesting technique
compared to other alternative energy sources. Following a brief history of
piezoelectricity, including the fundamentals and an overview of its development,
applications of piezoelectric are introduced and the piezoelectric energy harvesting
device is reviewed. In order to harvest bio-kinetic energy from human motion, the high
magnitude low-frequency piezoelectric energy harvest device is raised and details of
the novel Piezoelectric Flex Transducer (PFT) are given.
In the second part of the literature review, an overview of different optimization
techniques for piezoelectric energy harvesting device are given and work carried out by
other researchers is discussed. As the surrogate model assisted optimization approach
is employed in this research, mathematical optimization techniques relating to the
approach are introduced, including Design of Experiments, surrogate modeling and
mathematical optimization techniques.
2.1
Energy harvesting
Energy is one of the essential requirements for human beings in the modern world.
36
fuel to generate power. These are non-renewable resources. As the world population is
increasing rapidly, satisfying the energy requirements of human beings has become a
significant problem. Additionally generating energy using non-renewable fossil fuel
products, which cause a high emission of carbon dioxide (CO2) to the atmosphere
leading to global warming, is not a sustainable plan. According to Kathryn [14], oil will
run out between 2025 to 2070 and natural gas will run out in 50 years. As a result,
researchers have started looking for alternative resources to replace fossil fuels, such as
bioenergy, solar energy and ocean energy [15].
As micro electromechanical system (MEMS) devices continue to develop over time,
the power supply to these devices becomes a concern. In recent years the most
commonly used power supply for MEMS devices is the electrochemical battery [16].
One of the disadvantages of using batteries is that they need replacing frequently during
the device life-cycle, which is costly. For those devices that are hidden in a concealed
place, for example the aircraft structural health monitoring devices and medical implant
devices [19] [20], the power supplies are difficult to replace. Another significant
disadvantage of using batteries as the power supply is that the waste materials need to
be recycled to avoid environmental pollution. To overcome these disadvantages,
devices autonomic with microscale energy harvester become a popular topic of research.
Low power consuming devices have been developed and energy resources, such as
bio-kinetic energy and thermal energy, have been investigated in order to satisfy the power
requirement of low power consuming devices. Commercial micro-scale energy
reviewed them by dividing them into three groups, which are radiant energy harvesters,
mechanical energy harvesters, and thermal energy harvesters. Selvan and Ali [18]
conducted a comprehensive survey for the last decade on four types of micro-scale
energy harvesters (including thermoelectric, thermo-photovoltaic, piezoelectric, and
microbial fuel cell renewable power generators), in which both performance and
applications were documented. Lu et al. [21] compared different commercial
micro-scale energy harvesting techniques with their power output density. According to the
literature [3, 21-23], piezoelectric energy harvesting has a higher power output density
compared to most of micro-scale energy harvesting sources. One significant
comparative study by Raghunathan et al. [24] (listed in Table 2.1) indicates that a solar
cell has the highest power density of 15mW/cm3 and among these commonly used are
micro energy harvesting techniques. Piezoelectric has 330μW/cm3 and is listed as the
second. In fact, the power output of piezoelectric energy harvesting from a vibration
source (shoe inserts in this study) will be more stable than a solar cell since the energy
harvesting of the solar cell is highly dependent on the environment. A study of duToit
et al. [25] proved that the power density of a solar cell reduces from 15mW/cm3 to
180μW/cm3 during a cloudy day. This power density is less than when using
piezoelectric energy harvesting technique. Thus, it can be concluded that piezoelectric
38
Table 2.1 Power densities of harvesting technologies.
Harvesting technology Power density
Solar cells (outdoors at noon) 15mW/cm3
Piezoelectric (shoe inserts) 330μW/cm3
Vibration (small microwave oven) 116μW/cm3
Thermoelectric (10oC gradient) 40μW/cm3
Acoustic noise (100dB) 960nW/cm3
There are three basic types of vibration energy harvesting which are electromagnet,
electrostatic and piezoelectricity and these were mostly covered by Bogue [49], P.
Glynne-Jones et al. [50] and Cook-Chennault et al. [51]. In recent studies, most of the
regenerable energy sources such as solar cells and thermoelectrical power have been
introduced and comparisons have been made. Researchers in recent years have shown
that piezoelectricity is an ideal regenerated energy resource for the low power
consuming device.
This research focuses on optimizing the power output of micro-scale piezoelectric
energy harvester PFT with surrogate model assisted optimization techniques and
improving the efficiency of energy conversion to satisfy the power requirement of the
low power consuming devices. The novel PFT energy harvester, which was designed
to insert into shoes to harvest the bio-kinetic energy from human gait, will be
investigated in the next section.
2.2 Piezoelectric material
Piezoelectricity was first discovered by Pierre and Jacques Curie [26] [27] in 1880 and
their first article was published in 1882 [28]. The Piezoelectric effect originally appears
in some crystals such as tourmaline and quartz etc. This effect, which takes its name
from the Greek word ‘Piezo’ meaning ‘to press’, is often described as a phenomenon
as materials such as these generate electricity on their surface whilst subjected to
mechanical stress. The converse piezoelectric effect was predicted mathematically by
Lippmann [29], which means the piezoelectric effect can be inverse. In the converse
piezoelectric effect, the piezoelectric material can be deformed when subjected to an
electricity supply. This effect was later confirmed by the Currie brothers, following their
experiments.
At the beginning of the 1880s, the first materials used to observe piezoelectricity were
the single crystals such as Quartz, Tourmaline and Rochelle salt, which were founded
by Pierre and Jacques Curie. Since then, many materials have been found that have the
properties of piezoelectricity. In 1935, Busch and Scherrer [30] discovered potassium
dihydrogen phosphate (KDP), the first major family of piezoelectric and ferroelectrics.
After the expansion of piezoelectrical research to the USA, Japan and the Soviet Union
during the Second World War, barium titanate and lead zirconate titanate with
the chemical formula Pb[ZrxTi1-x]O3 (0≤x≤1) (PZT) were discovered. PZT has become
one of the most widely used piezoelectric materials today since they have very high
dielectric and piezoelectric properties. In recent years, piezoelectric materials have been
categorized into two types, piezoceramics [31-33] and piezopolymers [34,35],
40
compared to piezopolymers due to their high electro-mechanical coupling constants
while piezoceramics are more brittle than piezopolymers.
In order to demonstrate the fundamental of piezoelectric materials, the structure of
piezoceramic is illustrated in this section. As shown in Figure 2.1, the structure of
piezoceramic is a perovskite crystal structure. The piezoelectric material is the
material with piezoelectric effect, this is because of the center of inversion of the unit
cell of piezoelectric material structure in microscope. As an example, the structure of
perovskite crystal is shown. It includes a tetravalent metal ion placed inside a lattice
of larger divalent metal ions and O2. Once the material is polarized, ionic charges will
be distributed when the external force applied on the structure and the charge
distribution will be no longer symmetric.
(a) (b)
Figure 2.1 Structure of piezoceramic (a)before polarization (b)after polarization.
Governing equations of the linear theory of piezoelectricity which describe the
electromechanical properties of the piezoelectric materials and widely accepted in the
𝜀𝑖 = 𝑆𝑖𝑗𝐸 + 𝑑𝑚𝑖𝐸𝑚 (2.1)
𝐷𝑚 = 𝑑𝑚𝑖𝜎𝑖 + 𝜉𝑖𝑘𝜉𝐸𝑘 (2.2)
they can be re-written as the following form which often employed when the
piezoelectric material is used as sensor,
𝜀𝑖 = 𝑆𝑖𝑗𝐷𝜎𝑗+ 𝑔𝑚𝑖𝐷𝑚 (2.3)
𝐸𝑖 = 𝑔𝑚𝑖𝜎𝑖 + 𝛽𝑖𝑘𝜎𝐷𝑘 (2.4)
where i, j, m, k are indexes that indicating the directions of the coordinate system of the
material, which can be represented as x, y, z in Figure 2.2. Besides, σ is thestress vector,
E is the vector of applied electric field, ξ is the permittivity, d is the matrix of
piezoelectric strain constants, S is the matrix of compliance coefficients, D is thevector
of electric displacement, g is the matrix of piezoelectric constants and β is the
impermitivity component.
In these equations, the piezoelectric materials are assumed to be linear while the
material operate under low electric field or mechanical stress based on the IEEE
standard. Equation (2.1) represents the converse piezoelectric effect which the
piezoelectric material is used as an actuator, while equation (2.2) represents the direct
piezoelectric effect which the material is used as a sensor. The superscripts D, E, and σ
represent measurements taken at constant electric displacement, constant electric field
42
Figure 2.2 Coordinate system and axis nomenclature of piezoelectric materials.
According to the coordinate systems shown in the figure. The matrix form for equation
(2.1) - (2.2) can be expressed as:
[ 𝜀1 𝜀2 𝜀3 𝜀4 𝜀5
𝜀6]
=
[
𝑆11 𝑆12 𝑆13 𝑆14 𝑆15 𝑆16
𝑆12 𝑆22 𝑆23 𝑆24 𝑆25 𝑆26 𝑆13 𝑆32 𝑆33 𝑆34 𝑆35 𝑆36 𝑆14 𝑆42 𝑆43 𝑆44 𝑆45 𝑆46
𝑆15 𝑆52 𝑆53 𝑆54 𝑆55 𝑆56 𝑆16 𝑆62 𝑆63 𝑆64 𝑆65 𝑆66] [
𝜎1 𝜎2 𝜎3
𝜏23
𝜏31
𝜏12]
+
[
𝑑11 𝑑21 𝑑31
𝑑12 𝑑22 𝑑32
𝑑13 𝑑23 𝑑33
𝑑14 𝑑24 𝑑34
𝑑15 𝑑25 𝑑35
𝑑16 𝑑26 𝑑36] [ 𝐸1 𝐸2 𝐸3 ] (2.5) [ 𝐷1 𝐷2 𝐷3 ] = [
𝑑11 𝑑12 𝑑13 𝑑14 𝑑15 𝑑16
𝑑12 𝑑22 𝑑23 𝑑24 𝑑25 𝑑26
𝑑13 𝑑32 𝑑33 𝑑34 𝑑35 𝑑36
] [ 𝜎1 𝜎2 𝜎3 𝜎4 𝜎5 𝜎6]
+ [
𝑒11𝜎 𝑒12𝜎 𝑒13𝜎 𝑒21𝜎 𝑒22𝜎 𝑒23𝜎 𝑒31𝜎 𝑒32𝜎 𝑒33𝜎
] [ 𝐸1 𝐸2 𝐸3 ] (2.6) index direction
1 x
2 y
3 z
4 shear around x
5 shear around y
For piezoelectric material operates at 𝑑31 mode, many parameters of the matrices in equation (2.5) - (2.6) can be zero or expressed by other parameters as follows:
𝑆11= 𝑆22 (2.7)
𝑆13 = 𝑆31= 𝑆23= 𝑆32 (2.8)
𝑆12= 𝑆21 (2.9)
𝑆44 = 𝑆55 (2.10)
𝑆66 = 2(𝑆11− 𝑆12) (2.12)
𝑑31 = 𝑑32 (2.13)
𝑑15= 𝑑24 (2.14)
𝑒11𝜎 = 𝑒22𝜎 (2.15)
As a result, the piezoelectric material poled along the axis 3, the matrix form of
constitute equations for piezoelectric material operates at 𝑑31 mode can be written as:
[ 𝜀1 𝜀2 𝜀3 𝜀4 𝜀5
𝜀6]
=
[
𝑆11 𝑆12 𝑆13 0 0 0
𝑆12 𝑆22 𝑆23 0 0 0 𝑆13 𝑆32 𝑆33 0 0 0 0 0 0 𝑆44 0 0
0 0 0 0 𝑆44 0
0 0 0 0 0 2(𝑆11− 𝑆12)] [ 𝜎1 𝜎2
𝜎3
𝜏23
𝜏31
𝜏12]
+
[
0 0 𝑑31 0 0 𝑑32
0 0 𝑑33
0 𝑑15 0
𝑑15 0 0
44 [ 𝐷1 𝐷2 𝐷3 ] = [
0 0 0 0 𝑑15 0
0 0 0 𝑑15 0 0 𝑑31 𝑑31 𝑑33 0 0 0
] [ 𝜎1 𝜎2 𝜎3 𝜎4 𝜎5 𝜎6]
+ [
𝑒11𝜎 0 0 0 𝑒11𝜎 0 0 0 𝑒33𝜎
] [ 𝐸1 𝐸2 𝐸3 ] (2.17)
2.2.2 Material properties
This section reviews the physical meaning of the piezoelectric coefficients,
namely dij , gij , Sij and eij.
Firstly, the piezoelectric coefficient dij for piezoelectric energy harvester is the ratio
of short circuit charge per unit area flowing between connected electrodes
perpendicular to the j direction to the stress applied in the i direction. The
generated electric charge is:
𝑞 = 𝑑𝑖𝑗𝐹 (2.18)
where F is the force applied to the piezoelectric material on i direction.
As a result, piezoelectric materials that with a higher d are able to generate more electric power under the same stress.
Similar to dij, the piezoelectric constant gij denotes the electric field generated
along the i-axis when the material is stressed along the j-axis. The physical
meaning of gij is the open circuit voltage generated across two electrodes. For the
V = 𝑔31𝐹
𝑤 (2.19)
where w is the width of the piezoelectric material.
The relationship between piezoelectric constants dij and gij, can be expressed as:
𝑔𝑖𝑗 = 𝑑𝑖𝑗
𝜀𝑇 (2.20)
where 𝜀𝑇 is the dielectric constant measured at a constant stress.
Since the physical meaning of dij and gij, the product of dij and gijis often employed
to represent the electric power generated from the piezoelectric material and thus used
for piezoelectric material selection in the literature as the Figure of Merit (FOM)
which is expressed as:
FOM = 𝑑𝑖𝑗 ∙ 𝑔𝑖𝑗, (2.21)
The higher FOM stand for a higher electric power generate from the material.
The elastic compliance Sij represents the ratio of the strain the in i-direction
to the stress in the j-direction.
Piezoelectric coupling coefficient kij represents the ability of the piezoelectric
material to convert the strain into electric power and vice versa. The expression of the
piezoelectric coupling coefficient for energy harvester can be written as:
𝑘𝑖𝑗2 = 𝑒𝑙𝑒𝑐𝑡𝑟𝑖𝑐𝑎𝑙 𝑒𝑛𝑒𝑟𝑔𝑦 𝑔𝑒𝑛𝑒𝑟𝑎𝑡𝑒𝑑
𝑚𝑒𝑐ℎ𝑎𝑛𝑖𝑐𝑎𝑙 𝑒𝑛𝑒𝑟𝑔𝑦 𝑎𝑝𝑝𝑙𝑖𝑒𝑑
46
𝑘𝑖𝑗2 = 𝑑𝑖𝑗
2
𝑆𝑖𝑖𝐸𝜀
𝑟𝑗𝑗𝑇
(2.22)
where 𝑆𝑖𝑗𝐸 is the elastic compliance measured at a constant electric field. A
superscript “E” denotes that the elastic compliance is measured with the electrodes
short-circuited.
2.3 Piezoelectric energy harvesters
The first application of piezoelectricity was an ultrasonic transducer developed by
Langevin et al. [36] in 1917. Since then, lots of applications such as microphones [37,38]
and accelerometers [39,40] have been made. The use of piezoelectric materials in
applications can be divided into two types:
• The direct piezoelectric effect of the piezoelectric material acts as a sensor of load
or pressure;
• The inverse piezoelectric effect of the material acts as an actuator.
There are many different reviews for applications of piezoelectric materials that can be
found in the literature. To name a few, C.M.A. Lopes [41] reviewed a few applications
of the energy harvester using piezoelectric materials, including piezoelectric dance floor,
Heel Strike Generator (HSG) and piezoelectric windmill etc. Duan, W.H. et al. [42]
recently reviewed the piezoelectric materials and applications in the field of structural
health monitoring. Tressler et al. [43] reviewed the piezoelectric sensors and compared
the material properties of different piezoelectric sensor materials. The history of
piezoelectricity and piezoelectric materials has been reviewed in the literature [44-46].
harvester and the development of the novel PFT device.
2.3.1 The modeling of the piezoelectric energy harvester
This section introduces different types of modeling for the piezoelectric energy
harvester.
To predict the dynamics of the piezoelectric energy harvester, several researchers have
investigated the modeling of the energy harvesting device. In this section, the basic
modeling of Piezoelectric Energy Harvesters (PEH), including lumped-parameter
model and distributed-parameter model, will be introduced. The idea of the conversion
between vibration and electricity was first mentioned by William and Yates [47] in 1996.
They proposed the significant lumped-parameter base excitation model for vibration
energy harvester. The schematic diagram of this lumped-parameter model is shown in
Figure 2.3. This model consists of a spring k, mass m, and a damper d. The damper
represents the energy transducer in this model because the energy conversion will damp
the mass m. Relative movement of the mass and the house is depicted as z(t) and the
48
Figure 2.3 Schematic diagram of vibration energy harvester [47].
The differential equation describes the movement of the system, expressed as:
𝑚𝑧̈ + 𝑑𝑧̇ + 𝑘𝑧(𝑡) = −𝑚𝑦̈(𝑡) (2.23)
where m stands for the seismic mass, d is the damping constant and k is the spring
constant. The instantaneous power (p(t)) of the mass is produced by the force applied to the mass and its velocity. The instantaneous power can be expressed as:
𝑝(𝑡) = −𝑚𝑦̈(𝑡) [𝑦̇(𝑡) + 𝑧̇(𝑡)] (2.24)
The generated electrical power of the system can be calculated from equation (2.24)
𝑃 =
𝑚𝜁
𝑡𝑌
02(𝜔
𝜔
𝑛) 3𝜔
𝑛3[1 −
(𝜔
𝜔
𝑛) 2
]
2+ [2𝜁
𝑡𝜔
𝜔
𝑛]
2
(2.25)
where 𝜁𝑡 is the damping ratio of the transducer d, 𝜔𝑛 is the natural frequency of the system, 𝑌0 is the amplitude of vibration and ω is the vibration frequency.
This model indicates that the maximum power output can occur when the vibration
frequency is equal to the natural frequency of the system. Also, generated power is
proportional to the natural frequency. The maximum power of the system can be
expressed as:
𝑃𝑚𝑎𝑥 =
𝑚𝑌02𝜔𝑛3
4𝜁𝑡
(2.26)
The equation shows that the maximum power output of the system increases when the
damping ratio ζ𝑡 decreased. This indicates that optimizing the vibration energy harvester can be achieved by reducing the damping ratio of the system. Based on the
lumped-parameter model, Roundy [48] developed a model for the bimorph
piezoelectric energy harvester with tip mass and improved the power output of the
piezoelectric energy harvester by modifying the geometry of the bender. Kundu and
Nemade [52] studied the effect of resistance load at resonant frequency of the bimorph
piezoelectric energy harvester.
One of the distributed parameter models of cantilevered piezoelectric energy harvester
50
piezoelectric actuator model derived by Hagood et al. [54] in 1990. The Rayleigh-Ritz
formulation of piezoelectric material derived from the generalized form of Hamilton’s
principle for the coupled electromechanical system given by Crandall et al. [55]. The
diagram of the distributed parameter model (Figure 2.4) shows an elastic body that
includes a piezoelectric material of which electrodes are poled arbitrarily.
Figure 2.4 Distributed parameter model of piezoelectric material. [54]
The equation for the variation of this model can be expressed as:
∫ [𝛿(𝑇 + 𝑈 + 𝑊𝑒)]𝑑𝑡
𝑡2
𝑡1
= 0 (2.27)
where T is the kinetic energy, U is the potential energy and We is the external work
applied to the system. Details of the model expression can be found in [54].
By considering the material properties of piezoelectric energy harvester, the distributed
parameter model more accurately approximates the system compared to the original
shapes of cantilevered piezoelectric energy harvesters in terms of their efficiency and
maximum tolerable excitation amplitude base on the Rayleigh-Ritz type derived model.
Tabatabaei et al. [60] optimized the geometric parameters of cantilevered piezoelectric
energy harvester by using the Rayleigh-Ritz modeling method. The most cited
modelings of vibration-based piezoelectric energy harvester have been summarized by
Erturk [56].
2.3.2 Design of piezoelectric energy harvester
There are a variety of different designs for the piezoelectric energy harvesting device
to satisfy different energy sources and applications. For example, cantilevered type
designs of energy harvester are used in the high-frequency vibration such as aircrafts
and helicopters, while the cymbal type designs are suitable for low-frequency vibration
such as human gait. In this section, the two most basic and conventional piezoelectric
energy harvester designs, including the cantilevered type and the cymbal type, are
introduced to give a basic understanding of the novel PFT device which will be
optimized in this research.
2.3.2.1 Cantilevered type
A cantilevered beam structure is the most used structure for a piezoelectric energy
harvesting device. This structure is shown in Figure 2.5. It contains a metal beam with
a fixed end and usually it has a tip mass on the other end of the beam. The piezoelectric
52
different purpose of the design. Conventionally, a unimorph structure with one
piezoelectric layer and a bimorph structure with two piezoelectric layers, are present on
both sides of the metal beam. The conventional designs of the cantilevered piezoelectric
energy harvester (PEH) are shown in Figure 2.6.
Figure 2.5 Schematic diagram of cantilevered PEH.
[image:52.595.145.487.199.374.2](a) (b)
Figure 2.6 Structure of (a) unimorph (b) bimorph piezoelectric cantilevered beam.
The cantilevered type PEH has a long history. Different kinds of optimized designs can
cantilevered beam type piezoelectric energy harvesters which have different ways of
connecting the electrodes. They are a unimorph structure harvester with a parallel
connection, a bimorph structure harvester with a parallel connection and a bimorph
structure harvester with a series of connections. The results show that the bimorph
structure harvester with a series of connections has the largest range of load resistance
and operating frequency in which to generate peak power.
To improve the power output of a cantilevered type piezoelectric energy harvester,
Liang et al. [62] optimized the power output of the unimorph cantilevered beam
piezoelectric energy harvester with a fixed resonance frequency. In this study, the PEH
system was modeled using the energy method containing four geometric parameters
(length, width, thickness of the beam and the tip mass). The experiment results verified
that the optimal PEH was able to generate an output voltage of 3.95V. Sun et al. [63]
improved the performance of the typical cantilever PEH with an increase in
piezoelectric coefficient and electromechanical coupling coefficient material. The
optimized geometries of the device had been found with the maximum power output of
18mW. Cho et al. [64] improved the power output of PEH by improving the
electromechanical coupling coefficient in terms of applied stress, electrode coverage
and thickness of the beam and the piezoelectric layers. The electromechanical coupling
had been significantly improved by 150%. Du et al. [65] found the optimal electrode
cover area of the piezoelectric material for cantilevered PVEH and verified this with an
experiment. The results showed that the maximum power output of the cantilevered
54
Furthermore, there are many researchers focusing on the variant of PEH to improve the
power output, the traditional cantilevered type PEH has a narrow range of suitable
harvesting frequency (resonance frequency). The purpose of variants for a cantilevered
PEH is to produce a wider range of natural frequencies. Abdelkefi et al. [66] developed
a unimorph cantilevered PEH with a bending-torsion vibration tip mass as shown in
Figure 2.7. Similar to the unimorph cantilevered PEH, this device has an excitation base
connected with one end of the cantilevered beam, however, a two-end mass is connected
with the other end of the beam. The piezoelectric layer placed on the cantilevered beam
is thus subjected to bending and torsion force at the same time. Vibration with multiple
natural frequencies is achieved by different vibration mode shapes. The bending-torsion
vibration design and the optimal asymmetric tip mass design have improved the power
output by 30% compared to the symmetric tip mass design.
Figure 2.7 Schematic of the bending–torsion unimorph cantilever beam [66]
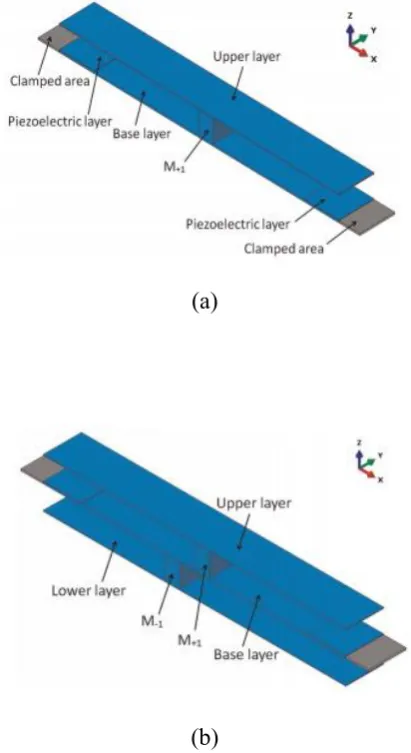
Xiong and Oyadiji [67] developed a double clamped multilayer structure PVEH. The
multilayer structures are shown in Figure 2.8, beams are connected with extra masses
excited base and two piezoelectric layers are located on both sides of the base layer. A
maximum of five vibration modes can be achieved by adjusting the position of the mass
and thickness of the base layer. The study shows that the optimal multilayer
cantilevered PEH can be used in different scales of vibration frequencies.
(a)
[image:55.595.213.419.234.611.2](b)
Figure 2.8 Double clamped multilayer structure PVEH: (a) double layers (b) triple
layers [67]
2.3.2.2
Cymbal type
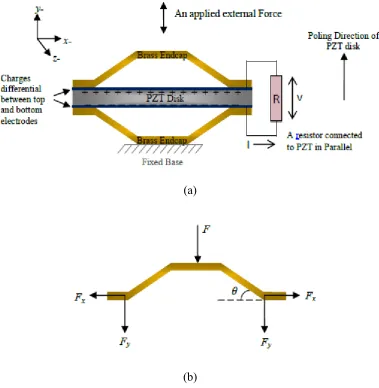
Another significant PEH structure is the Cymbal transducer, its schematic diagram is
56
configured with two metal endcaps on the top and bottom and the piezoelectric material
plate. Two electrodes are placed on the top and bottom of the piezoelectric plate. The
function of the endcap is to convert the vertical force from the top into a horizontal
force so that the piezoelectric material can operate in d33 mode which can generate a
higher amount of electrical power. The working mechanism of the Cymbal type
piezoelectric energy harvester is shown in Figure 2.9 (b).
(a)
(b)
Figure 2.9 (a) Schematic diagram of cymbal transducer (b) Force analysis of the
cymbal transducer [10].
[image:56.595.125.505.272.661.2]vertical result forces:
𝐹𝑦 = 𝐹
2 (2.28)
𝐹𝑥 =𝐹
2 1 𝑡𝑎𝑛𝜃 ≅
𝐹
2𝜃 when θ is small (2.29)
Thus, the force amplification factor of the endcap 𝐴𝑐 can be expressed as:
𝐴𝑐 =
𝐹𝑥 𝐹 ≅
1
2𝜃 (2.30)
The piezoelectric strain constant that related to the force amplification had been
proposed in the literature [54], which is called the equivalent strain constant 𝑑33𝑒𝑓𝑓 and it is expressed as:
𝑑33𝑒𝑓𝑓 = 𝑑33+ |𝐴𝑑31| (2.31)
where
𝐴 =
𝑐𝑎𝑣𝑖𝑡𝑦 𝑟𝑎𝑑𝑖𝑢𝑠𝑐𝑎𝑣𝑖𝑡𝑦 𝑑𝑒𝑝𝑡ℎ
(2.32) is dependent on the angle of endcaps’ leverage contributions, this equation shows how
piezoelectric constant 𝑑31contributes to the piezoelectric constant through the angle of endcap.
In order to improve the power output of the cymbal type PEH, Palosaari et al. [68]
optimized the Cymbal type PEH by finding the vibration frequency, applied force and
thickness of the steel endcaps. For a fixed diameter of 35mm and thickness of 540μm, the optimal electrical power of 0.27mW was reported when the thickness of the steel


![Figure 2.3 Schematic diagram of vibration energy harvester [47].](https://thumb-us.123doks.com/thumbv2/123dok_us/9337957.435827/48.595.241.396.76.267/figure-schematic-diagram-vibration-energy-harvester.webp)