Interaction of HLA-DRB1*1501 and TNF-Alpha in a
Population-based Case-control Study of Multiple Sclerosis
Dhelia M. Williamson.
1,*, Ruth Ann Marrie
2, Allison Ashley-Koch
3, Glen A. Satten
11Division of Reproductive Health, Centers for Disease Control and Prevention, Atlanta, Georgia, 30333, United States 2Department of Internal Medicine, University of Manitoba, Winnipeg, Manitoba, Canada R3A 1R9
3Center for Human Genetics, Duke University Medical Center, Durham, North Carolina, 27710, United States *Corresponding Author: [email protected]
Copyright © 2013 Horizon Research Publishing All rights reserved.
Abstract
This study was conducted to determine whether single nucleotide polymorphisms (SNPs) in nine genes (human leukocyte antigen (HLA), T cell receptor beta (TCA receptor β), tumor necrosis factor α (TNF α), tumor necrosis factor β (TNF β), apolipoprotein E (APOE), interleukin 7 receptor alpha chain (IL7RA) interleukin 2 receptor alpha chain (IL2RA) myelin basic protein (MBP) and vitamin D receptor (VDR)) associated with multiple sclerosis (MS) could be replicated in a population-based sample, and to determine if these associations are modified by presence of HLA DRB1*1501. DNA was available from 722 individuals (223 with MS and 499 controls) who participated in a population-based case-control study. Cases and controls were matched on ancestry, age, gender and geographic area. HLA DRB1*1501 risk allele (T) was confirmed in this population using a genotypic test, controlling for multiple comparisons. Examining the effect of each SNP in the presence or absence of the HLA DRB1*1501 risk allele identified significant associations with TNF α -1031 (rs1799964) among those without the HLA risk allele. No additional interactions were significant in a cases-only analysis. Our results indicate that an interaction between SNPs in TNF α and HLA DRB1*1501 may influence the risk of developing MS.Keywords
Case-Control Study, Genetic Susceptibility, Multiple Sclerosis, Tumor Necrosis Factor-Alpha,A-DRB1*1501, Gene–Gene Interaction
1. Introduction
Family studies have demonstrated that genetic and non-genetic factors are involved in the etiology of multiple sclerosis (MS) [1-2]. Heritability estimates of up to 76% from twin studies provide the most convincing evidence for a genetic component [3]. Studies of multiplex families, half-siblings and adoptees also provide evidence for a genetic contribution to disease susceptibility [1].The sole
consistent genetic association identified with MS is the human leukocyte antigen (HLA) [4]. Other immune-mediated genes such as immunoglobulin heavy chain (IgH), T-cell receptor (TCR), tumor necrosis factor (TNF) and myelin basic protein (MBP) have also been associated with MS [5-6]. Classic linkage and affected sib-pair linkage studies have been conducted examining these genes as potential risk factors but the results have been conflicting [1,3].
Genome-wide association studies have also been conducted to localize genomic regions that may harbor novel MS susceptibility genes in unrelated individuals [7-10] and parent-affected child trios [11]. These studies used large sets of polymorphic markers that spanned the genome and identified additional risk loci, supporting the hypothesis that MS is polygenic and genetically heterogeneous. Overall,
HLA DRB1*1501, interleukin 2 receptor alpha chain (IL2RA) and interleukin-7 receptor alpha chain (IL7RA) genes have been the most consistently replicated and have shown the strongest associations [6,7].
The aims of this study were to determine whether single nucleotide polymorphisms (SNPs) in nine genes previously reported to be associated with MS could be replicated in a population based sample and to determine if these associations are modified by having the HLA DRB1*1501
risk allele.
2. Materials and Methods
2.1. Ethics Statement
Written informed consent was obtained from all participants. This study was approved by the Institutional Review Boards of the Centers for Disease Control and Prevention, Duke University Medical Center, Michigan Public Health Institute, the Texas Department of State Health Services, and the Cleveland Clinic.
Study participants were individuals with MS and controls who participated in a population-based case-control study conducted from November 2004 to September 2009 [12]. Cases were identified from a prevalence study conducted in four geographic areas (metro Atlanta, Georgia; Lorain County, Ohio; the cities of Independence and Sugar Creek, Missouri; or the 19-county area surrounding Lubbock, Texas) and were classified as having definite MS according to both the Poser [13] and McDonald [14] criteria by a study neurologist [12]. Controls were recruited by random digit dialing and are matched to cases on sex, age, race and geographic area.
The case-control study enrolled 276 cases and 590 matched controls (n=866) [12]. Because allele frequencies and disease risk differ across racial and ethnic groups [15] we restricted our analysis to Whites to ensure a homogeneous population. Data from 60 non-White individuals were excluded from the analysis as were data from 84 white participants who did not provide a blood sample (24 cases and 60 controls). This resulted in a total of 722 individuals (223 cases and 499 controls) in 212 strata for the analyses presented here.The majority of the strata were either 1:1 or 1:2 matched (62.3%).
2.3. Specimen Collection and DNA Extraction
Each participant was asked to provide a blood sample (3 EDTA Starstedt tubes of whole blood) for genetic analysis. All samples were labeled by a unique identifier so technicians were blinded to case/control status. The Center for Human Genetics at Duke University Medical Center conducted the genotyping. DNA was extracted using the PUREGENE system (QIAGEN, Germantown, MD).
2.4. Candidate Gene and SNP Selection
Seven candidate genes were selected for confirmatory analysis based on published evidence that they play a role in the development of MS: human leukocyte antigen (HLA), T cell receptor beta (TCA receptor β), tumor necrosis factor α (TNF α), tumor necrosis factor β (TNF β), apolipoprotein E (APOE), interleukin 7 receptor alpha chain (IL7RA) and interleukin 2 receptor alpha chain (IL2RA). We selected 13 SNPs (HLA, n=1; TCA receptor β, n=2; TNF α/β, n=6; APOE, n=2; IL7RA, n=1; and IL7RA, n=1) that had been previously reported as associated with MS [4-7, 16].
Two additional candidate genes were selected for exploratory analysis based on biological plausibility: myelin basic protein (MBP) and vitamin D receptor (VDR) [17-20]. For VDR and MBP genes, haplotype tagging SNPs were identified using LDSelect v1.0 (30) based on data from the CEU population in the HapMap project (www.hapmap.org). To minimize redundancy among SNPs in high linkage disequilibrium, single SNPs were selected to represent each haplotype block, as defined by r2 > 0.64. SNPs were prioritized based on the potential for biological effect (coding SNPs, 5'/3' untranslated and regulatory regions),
physical position, and allele frequency. Forty-five exploratory SNPs were selected in the VDR and MBP genes (n=22 and n=23 respectively).
2.5. Genotyping
Genotyping was conducted using the Applied Biosystems Taqman platform at the Center for Human Genetics, Duke University Medical Center. Quality control measures applied for all genotyping assays included the genotyping of a series of blinded duplicate samples and Centre d’Etude du Polymorphism Humain (CEPH) controls. To pass quality control, all duplicate samples in an assay had to match 100%.
2.6. Statistical Analysis
Differences in demographic characteristics between cases and controls were analyzed using a chi-squaretest. Tests for deviations from Hardy-Weinberg equilibrium (HWE) were conducted in controls using PLINK [21]. SNPs that failed HWE (p < 0.005) were excluded from further analyses. We controlled for population stratification using questionnaire data regarding ancestry information. Participants were asked to list up to three countries where their maternal ancestors came from and up to three countries where their paternal ancestors came from. Responses were grouped into geographic areas (Western Europe, Eastern Europe, Mediterranean, Scandinavia, US/Canada/Don’t know). Each participant’s proportion of ancestry from each geographic region was entered as a covariate in the analysis. Education was dichotomized as high school education or less versus post high school education.
Matched strata contained between 1– 4 cases and 1 – 12 controls. Genotype was coded as a quantitative variable that counts the number of minor alleles for each individual. HLA DRB1*1501 risk was defined as having at least one copy of the risk allele (T). Because cases and controls were matched, data were analyzed using conditional logistic regression. For genetic main effects, we fit models that included SNP genotype while adjusting for education and ancestry. For analyses of interaction, we fit models that included SNP genotype, HLA DRB1*1501 risk, and a multiplicative SNP x
HLA DRB1*1501 risk interaction term, while again adjusting for education and ancestry. An unmatched cases-only analysis was conducted using unconditional logistic regression with HLA DRB1*1501 risk as the outcome and each SNP genotype as a predictor; also included in each model were education and ancestry. Assuming independence (i.e., no linkage disequilibrium) between a SNP and HLA DRB1*1501, an association found among cases would be evidence for gene x gene interaction. SNPs in TNF α and TNF β were not included in this analysis because they are in linkage disequilibrium (LD) with HLA DRB1*1501. Since this analysis makes an extra assumption about linkage disequilibrium, it may be more powerful than the matched analysis [22].
associated with MS were considered as confirmatory, and were not adjusted for multiple comparisons. Analyses involving the 22 VDR and 23 MBP SNPs are considered exploratory; for these SNPs, adjustments for multiple comparisons were made using the Bonferonni correction (by adjusting the p value cutoff to correspond to a size of 0.05/45). SAS, version 9.2 (SAS Institute, Cary, NC, USA) was used for data management and statistical analysis.
Table 1. Characteristics of the study population
Characteristic (n=223) Cases Controls (n=499) (p value) χ2 State of Residence
(n, %) Georgia Missouri Ohio Texas 72 (32.3) 18 (8.1) 75 (33.6) 58 (26.0) 151 (30.2) 51 (10.2) 161 (32.3) 136 (27.3) 1.13 (0.77)
Sex (n, %) Female
Male 179 (80.3) 44 (19.7) 393 (78.8) 106 (21.2)
0.21 (0.64) Age (years) (n, %)a
< 39 40 – 49
50 – 59
60 – 69 70+ 2 (9.9) 57 (25.6) 99 (44.4) 34 (15.2) 11 (4.9) 34 (6.8) 106 (21.2) 196 (38.9) 127 (25.5) 38 (7.6) 12.96 (0.01) Educational Status Attained (n, %)
< High School High School graduate
Some College/Technical School College Graduate 8 (3.6) 48 (21.5) 69 (30.9) 98 (44.0) 19 (3.8) 84 (16.8) 154 (30.9) 242 (48.5) 2.6 (0.47)
Number of missing genotypes 0 1 2 3 4 >5 168 (75.3) 38 (17.0) 4 (1.8) 3 (1.4) 4 (1.8) 6 (2.7) 409 (82.0) 65 (13.0) 13 (2.6) 4 (0.8) 2 (0.4) 6 (1.2) 9.14 (0.10)
aAt time of interview
3. Results
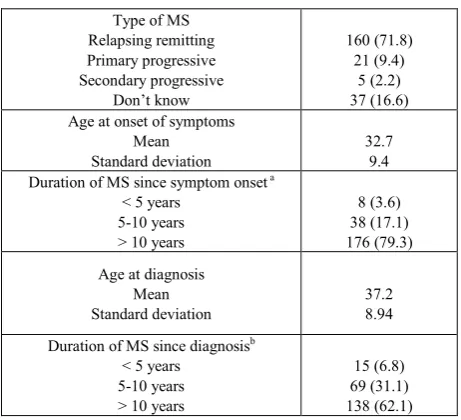
Most study participants were female, ≥50 years old and had attended or graduated from college (Table 1). The female-to-male ratio was 4.09:1. The majority (80%) of study participants had complete genotype information, while approximately 6% were missing genotype information for two or more SNPs. Nearly three-quarters of the cases reported having relapsing remitting MS (Table 2). Most reported the onset of symptoms in their early thirties and were diagnosed in their late thirties, and had had MS for over 10 years.
Table 2. Characteristics of the individuals with MS
Type of MS Relapsing remitting Primary progressive Secondary progressive Don’t know 160 (71.8) 21 (9.4) 5 (2.2) 37 (16.6) Age at onset of symptoms
Mean
Standard deviation 32.7 9.4 Duration of MS since symptom onset a
< 5 years 5-10 years > 10 years
8 (3.6) 38 (17.1) 176 (79.3) Age at diagnosis
Mean
Standard deviation 37.2 8.94 Duration of MS since diagnosisb
< 5 years 5-10 years > 10 years
15 (6.8)
69 (31.1) 138 (62.1)
a One individual did not know their date of symptom onset and was
excluded.
b Four individuals did not know their date of diagnosis and were excluded
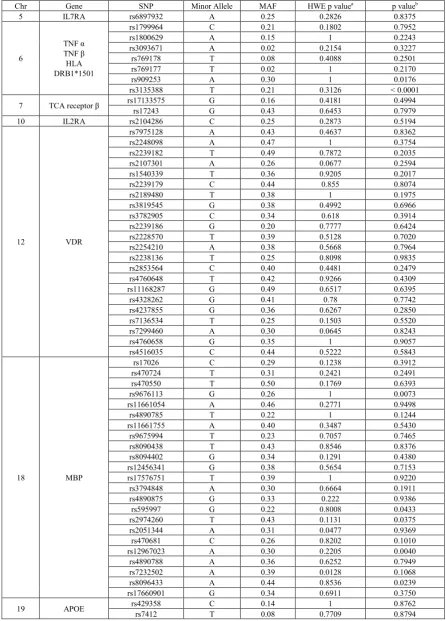
The chromosomal location, gene name, SNP reference sequence (rs) number, minor allele and minor allele frequencies for each SNP included in this analysis are shown in Table 3.The minor allele frequencies in this population varied dramatically across SNPs and ranged from 0.02 to 0.49. None of the SNPs selected failed HWE. Two confirmatory SNPs were significantly associated with MS at the 0.05 level: TNF β (rs909253) and HLA DRB1*1501
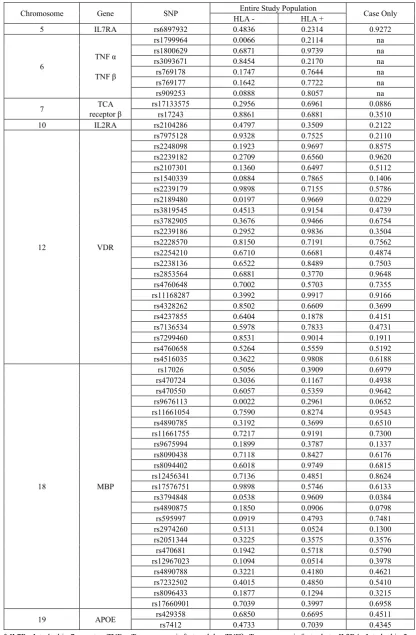
(rs3135388). Five exploratory SNPs in the MBP gene (rs9676113, rs595997, rs2974260, rs12967023, and rs8096433) were significant at the 0.05 level, but did not remain significant after correction for multiple comparisons. We also examined the effect of each SNP in the presence or absence of the HLA DRB1*1501 risk allele (T) (Table 4). One of the confirmatory SNPs was associated with MS among participants with no HLA DRB1*1501 risk allele (TNFα rs1799964, odds ratio per copy of the minor allele (OR) 1.77, 95% confidence interval (CI) 1.17, 2.69). Two exploratory SNPs were associated with MS among participants with no HLA DRB1*1501 risk allele: VDR
rs2189480 (OR 1.54, 95% CI 1.07, 2.23) and MBP
rs9676113 (OR 0.48, 95% CI 0.30, 0.76). No SNPs were associated with MS among participants with the HLA DRB1*1501 risk allele. In the cases-only analysis for interaction between HLA DRB1*1501 risk and the other loci (Table 4), two SNPs were significant at p< 0.05 level (VDR
[image:3.595.61.296.199.545.2]Table 3. Genotyping information including gene and SNP identification, minor allele, minor allele frequencies (MAF), testing for Hardy-Weinberg
equilibrium (HWE) and genotypic trend test results
Chr Gene SNP Minor Allele MAF HWE p valuea p valueb
5 IL7RA rs6897932 A 0.25 0.2826 0.8375
6
TNF α TNF β
HLA DRB1*1501
rs1799964 C 0.21 0.1802 0.7952
rs1800629 A 0.15 1 0.2243
rs3093671 A 0.02 0.2154 0.3227 rs769178 T 0.08 0.4088 0.2501
rs769177 T 0.02 1 0.2170
rs909253 A 0.30 1 0.0176
rs3135388 T 0.21 0.3126 < 0.0001
7 TCA receptor β rs17133575rs17243 G G 0.16 0.43 0.4181 0.6453 0.4994 0.7979
10 IL2RA rs2104286 C 0.25 0.2873 0.5194
12 VDR
rs7975128 A 0.43 0.4637 0.8362
rs2248098 A 0.47 1 0.3754
rs2239182 T 0.49 0.7872 0.2035
rs2107301 A 0.26 0.0677 0.2594
rs1540339 T 0.36 0.9205 0.2017
rs2239179 C 0.44 0.855 0.8074
rs2189480 T 0.38 1 0.1975
rs3819545 G 0.38 0.4992 0.6966
rs3782905 C 0.34 0.618 0.3914
rs2239186 G 0.20 0.7777 0.6424
rs2228570 T 0.39 0.5128 0.7020
rs2254210 A 0.38 0.5668 0.7964
rs2238136 T 0.25 0.8098 0.9835
rs2853564 C 0.40 0.4481 0.2479
rs4760648 T 0.42 0.9266 0.4309 rs11168287 G 0.49 0.6517 0.6395
rs4328262 G 0.41 0.78 0.7742
rs4237855 G 0.36 0.6267 0.2850
rs7136534 T 0.25 0.1503 0.5520
rs7299460 A 0.30 0.0645 0.8243
rs4760658 G 0.35 1 0.9057
rs4516035 C 0.44 0.5222 0.5843
18 MBP
rs17026 C 0.29 0.1238 0.3912 rs470724 T 0.31 0.2421 0.2491
rs470550 T 0.50 0.1769 0.6393
rs9676113 G 0.26 1 0.0073
rs11661054 A 0.46 0.2771 0.9498
rs4890785 T 0.22 1 0.1244
rs11661755 A 0.40 0.3487 0.5430
rs9675994 T 0.23 0.7057 0.7465
rs8090438 T 0.43 0.8546 0.8376 rs8094402 G 0.34 0.1291 0.4380
rs12456341 G 0.38 0.5654 0.7153
rs17576751 T 0.39 1 0.9220
rs3794848 A 0.30 0.6664 0.1911
rs4890875 G 0.33 0.222 0.9386
rs595997 G 0.22 0.8008 0.0433
rs2974260 T 0.43 0.1131 0.0375
rs2051344 A 0.31 0.0477 0.9369
rs470681 C 0.26 0.8202 0.1010 rs12967023 A 0.30 0.2205 0.0040 rs4890788 A 0.36 0.6252 0.7949
rs7232502 A 0.39 0.0128 0.1068
rs8096433 A 0.44 0.8536 0.0239 rs17660901 G 0.34 0.6911 0.3750
19 APOE rs429358rs7412 C T 0.14 0.08 0.7709 1 0.8762 0.8794
* IL7R= Interleukin-7 receptor; TNFα=Tumor necrosis factor alpha; TNFβ=Tumor necrosis factor beta; IL2RA=Interleukin-2 receptor alpha;
TCA-β=T cell antigen receptor beta; VDR= Vitamin D receptor; MBP=myelin basic protein; APOE=Apolipoprotein E;
Table 4. P-values from tests of association between individual SNPs and HLA-DRB1*1501 risk allele among the entire study population and cases-only
Chromosome Gene SNP HLA -Entire Study Population HLA + Case Only
5 IL7RA rs6897932 0.4836 0.2314 0.9272
6 TNF α
TNF β
rs1799964 0.0066 0.2114 na rs1800629 0.6871 0.9739 na rs3093671 0.8454 0.2170 na rs769178 0.1747 0.7644 na rs769177 0.1642 0.7722 na
rs909253 0.0888 0.8057 na
7 receptor βTCA rs17133575rs17243 0.0.8861 2956 0.6961 0.6881 0.0886 0.3510 10 IL2RA rs2104286 0.4797 0.3509 0.2122
12 VDR
rs7975128 0.9328 0.7525 0.2110
rs2248098 0.1923 0.9697 0.8575
rs2239182 0.2709 0.6560 0.9620 rs2107301 0.1360 0.6497 0.5112
rs1540339 0.0884 0.7865 0.1406
rs2239179 0.9898 0.7155 0.5786 rs2189480 0.0197 0.9669 0.0229
rs3819545 0.4513 0.9154 0.4739
rs3782905 0.3676 0.9466 0.6754
rs2239186 0.2952 0.9836 0.3504
rs2228570 0.8150 0.7191 0.7562
rs2254210 0.6710 0.6681 0.4874
rs2238136 0.6522 0.8489 0.7503
rs2853564 0.6881 0.3770 0.9648
rs4760648 0.7002 0.5703 0.7355
rs11168287 0.3992 0.9917 0.9166 rs4328262 0.8502 0.6609 0.3699
rs4237855 0.6404 0.1878 0.4151
rs7136534 0.5978 0.7833 0.4731
rs7299460 0.8531 0.9014 0.1911
rs4760658 0.5264 0.5559 0.5192
rs4516035 0.3622 0.9808 0.6188
18 MBP
rs17026 0.5056 0.3909 0.6979 rs470724 0.3036 0.1167 0.4938
rs470550 0.6057 0.5359 0.9642
rs9676113 0.0022 0.2961 0.0652
rs11661054 0.7590 0.8274 0.9543
rs4890785 0.3192 0.3699 0.6510
rs11661755 0.7217 0.9191 0.7300
rs9675994 0.1899 0.3787 0.1337
rs8090438 0.7118 0.8427 0.6176 rs8094402 0.6018 0.9749 0.6815
rs12456341 0.7136 0.4851 0.8624
rs17576751 0.9898 0.5746 0.6133
rs3794848 0.0538 0.9609 0.0384
rs4890875 0.1850 0.0906 0.0798
rs595997 0.0919 0.4793 0.7481
rs2974260 0.5131 0.0524 0.1300
rs2051344 0.3225 0.3575 0.3576
rs470681 0.1942 0.5718 0.5790 rs12967023 0.1094 0.0514 0.3978 rs4890788 0.3221 0.4180 0.4621
rs7232502 0.4015 0.4850 0.5410
rs8096433 0.1877 0.1294 0.3215
rs17660901 0.7039 0.3997 0.6958
19 APOE rs429358rs7412 0.68500.4733 0.66950.7039 0.450.434511
* IL7R= Interleukin-7 receptor; TNFα=Tumor necrosis factor alpha; TNFβ=Tumor necrosis factor beta; IL2RA=Interleukin-2 receptor alpha; TCA-β=T cell antigen receptor beta; VDR= Vitamin D receptor; MBP=myelin basic protein; APOE=Apolipoprotein E;
b adjusted for level of education (≤HS graduate vs. post-HS education) and ancestry na: not calculated because SNPs are in LD with HLA
4. Discussion
In this population based case-control study, we examined the association of 58 SNPs in nine previously reported candidate genes and having MS. We confirmed an association with two SNPs previously identified in the literature (TNF β and HLA DRB1*1501) and found an association with a TNF α SNP that was limited to individuals who lack the HLA DRB1*1501 risk allele. Because we only examined statistical interaction, it is impossible to determine if this is a true biological interaction, or simply that the smaller TNF α effect is easier to detect among persons without the HLA DRB1*1501 risk allele. If this is the case, it may be reasonable to accept the nominal p-value for this “interaction” without adjustment for multiple comparisons. Further, because there is linkage disequilibrium between TNF α and the HLA region, we cannot rule out the possibility that the TNF α effect we see is actually the result of different risk allele in the HLA region.
Associations between polymorphisms in the TNF-α -1031 T/C (rs1799964) polymorphism and immune-mediated diseases such as Crohn’s disease, rheumatoid arthritis and Graves’ disease have been reported [23-25]. Studies examining the association between TNF α and MS have been conflicting, and have usually focused on the TNF α -308 polymorphism (rs1800629) [26-34]. A study in men of Russian and Tatar ethnic origin found that susceptibility to MS was influenced by the HLA DRB1*1501 SNP rs909253 and TNF α SNP rs1800629 [35]. Another case-control study conducted with an Iranian population reported an interaction between HLA-DRB1*1501 and TNF α SNP rs1800629, with a 7-fold increased odds of MS among individuals with at least one copy of the risk allele [26]. We also found an interaction between HLA DRB1*1501 and TNF-α but with at a different locus (rs1799964). However, rs1799964 is in strong LD with rs1800629 in our study population (D′ = 1), and the haplotype having the minor allele at both loci is completely absent in our study population. Strong LD in the region suggests that different SNPs in TNF α may be associated with MS in different populations. Taken together, these studies strongly suggest a causal SNP resides somewhere in this region.
Tumor necrosis factor (TNF) is an important pro-inflammatory cytokine which plays a role in the regulation of cell differentiation, proliferation and death, as well as in inflammation, innate and adaptive immune responses [23]. The exact role of the TNF superfamily is unclear although they are the principal mediators in immune defense, inflammation and the development and maintenance of the immune system [36]. TNF-α is a pleiotropic cytokine with wide-ranging actions on the immune system and is an important mediator in immune-mediated inflammatory disease states, including multiple sclerosis [36]. The presence of DNA sequence variations in the regulatory region might interfere with transcription of TNF gene, influencing the circulating level of TNF and consequently susceptibility to autoimmune and
other neurodegenerative diseases [23]. In addition, clinical observations have implicated dysregulation of the TNF-α pathway in susceptibility to MS. In a clinical trial, patients who received lenercept, a p55 tumor necrosis factor receptor fusion protein, had increased relapse activity compared to patients who received a placebo [37]. A clinical trial of an anti-TNF antibody was associated with increased disease activity, and demyelinating disease has emerged in persons treated with monoclonal antibodies to TNF-α for indications such as inflammatory bowel disease and rheumatoid arthritis [38-39]. It is unclear whether the interaction between HLA and TNF α is biological or merely that the weaker effect of TNF α is more easily detected when the HLA risk allele is absent. However, HLA haplotypes are known to affect the synthesis of TNF-α, with some haplotypes increasing TNF α synthesis and others decreasing TNF α synthesis [40-41].
We found five SNPs in the myelin basic protein gene that were associated with MS. One of these (rs9676113) had a p-value of 0.0073 when testing its main effect and a p-value of 0.0022 among persons with no HLA risk. While these results were not significant after adjusting for multiple comparisons, the small p-values we observed suggest that association between SNPs in MBP (especially rs9676113) and MS warrants further research.
Since MS predominantly affects individuals who are white and female, most research conducted in this field has focused specifically on this population. A limitation of our study was that we identified very few individuals who were non-white and thus could not evaluate whether the identified association was also present across populations. It is unknown if the genetic contributions to this disease identified in this study will be confirmed in other racial/ethnic groups. Another limitation in this study was that we looked at common variations in the selected candidate genes. Our results do not rule out the possibility that rare variants may also contribute in these and other genes.
5. Conclusions
Research has shown that a single locus model for MS is unlikely. Our work adds to the emerging literature regarding gene-gene interactions, particularly those related to immune regulation. Future efforts should focus on evaluating this finding in both population-based and family studies, and on evaluating this finding in non-White populations. Consistent replication of these results in different populations would support causality. Evaluation of the potential effects of an interaction between TNF- α and HLA, and the possible role of MBP, may offer insights into the mechanisms of disease as well.
Acknowledgments
Laurie Wagner, the Michigan Public Health Institute and McKing Consulting.
Disclaimer
The findings and conclusions in this article are those of the authors and do not necessarily represent the official position of the Centers for Disease Control and Prevention.
REFERENCES
[1] Sadovnick AD, Dyment D, Ebers GC. (1997) Genetic epidemiology of multiple sclerosis. Epidemiol Rev 19: 99-105.
[2] Willer CJ, Ebers GC. (2000) Susceptibility to multiple sclerosis: interplay between genes and environment. Current Opinion in Neurology2000 13(3):241-247.
[3] Hawkes CH, Macgregor AJ. (2009) Twin studies and the heritability of MS: a conclusion.Mult Scler 15:661-667. [4] Arnason, BGW. (1998) Autoimmune diseases of the central
and peripheral nervous systems. In: Rose NR, MacKay IR, editors. The Autoimmune Diseases. San Diego, CA: Academic Press 572-578.
[5] Dyment DA, Ebers GC, Sadovnick AD. (2004) Genetics of multiple sclerosis. Lancet Neurol 3:104-110.
[6] Walter MA, Gibson WT, Ebers GC, Cox DW. (1991) Susceptibility to multiple sclerosis is associated with the proximal immunoglobulin heavy chain variable region. J Clin Invest 87(4):1266–1273.
[7] The International Multiple Sclerosis Genetics Consortium. (2007) Risk alleles for multiple sclerosis identified by a genomewide study. N Engl J Med 357:851–862.
[8] The Wellcome Trust Case Control Consortium & The Australo-Anglo-American Spondylitis Consortium. (2007) Association scan of 14,500 nonsynonymous SNPs in four diseases identifies autoimmunity variants. Nature Genet 39:1329–1337.
[9] Baranzini SE, Wang J, Gibson GA, Galwey N, Naegelin Y, Barkhof F, et al. (2009) Genome-wide association analysis of susceptibility and clinical phenotype in multiple sclerosis. Hum Mol Genet 18: 767–778.
[10] De Jager PL, Jia X, Wang J, de Bakker PIW, Ottoboni L, Aggarwal NT, et al. (2009) Meta-analysis of genome scans and replication identify CD6,IRF8 and TNFRSF1A as new multiple sclerosis susceptibility loci. Nature Genet 41:776–782.
[11] The International Multiple Sclerosis Genetics Consortium. (2010) Evidence for polygenic susceptibility to multiple sclerosis—the shape of things to come. Am J Hum Genet 86:621–625.
[12] Williamson DM, Marrie RA, Ashley-Koch A, Schiffer R, Trottier J, Wagner L. (2012) Design, methodological issues and participation in a multiple sclerosis case-control study.
Acta Neurol Scand 126(3):197-204.
[13] Poser CM, Paty DW, Scheinberg LC, McDonald WI, Davis FA, Ebers GC, et al. (1983) New Diagnostic criteria for multiple sclerosis: guidelines for research protocols. Ann Neurol 13:227-231.
[14] McDonald WI, Compston A, Edan G, Goodkin D, Hartung HP, Lublin FD, et al. (2001) Recommended diagnostic criteria for multiple sclerosis: guidelines from the International Panel on the Diagnosis of Multiple Sclerosis. Ann Neurol 50(1):121-127.
[15] Perez-Lezaun A., Calafell F., Mateu E., Comas D., Bosch E.,
Bertranpetit J. (1997) Allele frequencies for 20 microsatellites in a worldwide population survey. Hum Hered 47: 189-196.
[16] Schmidt S, Barcellos LF, DeSombre K, Rimmler JB, Lincoln RR, Bucher P, et al. (2002) Association of Polymorphisms in the Apolipoprotein E Region with Susceptibility to and Progression of Multiple Sclerosis Am J Hum Genet 70:708–717.
[17] Tienari PJ, Kuokkanen S, Pastinen T, Wikström J, Sajantila A, Sandberg-Wollheim M, et al. (1998) Golli-MBP gene in multiple sclerosis susceptibility. J Neuroimmunol 81(1-2):158-167.
[18] Boylan KB, Takahashi N, Paty DW, Sadovnick AD, Diamond M, Hood LE, et al. (1990) DNA length polymorphism 5' to the myelin basic protein gene is associated with multiple sclerosis. Ann Neurol 27(3):291-297.
[19] Smolders J, Peelen E, Thewissen M, Menheere P, Tervaert JW, Hupperts R, et al. (2009) The relevance of vitamin D receptor gene polymorphisms for vitamin D research in multiple sclerosis. Autoimmun Rev 8:621-626.
[20] Hayes CE, Cantorna MT, DeLuca HF. (1997) Vitamin D and multiple sclerosis. Proceedings of the Society for Experimental Biology and Medicine 216(1):21-27.
[21] Purcell S. (2007) PLINK: a tool set for whole-genome association and population-based linkage analyses. Am J Hum Genet 81:559-575.
[22] Piegorsch WW, Weinberg CR, Taylor JA. (1994) Non-hierarchical logistic models and case-only designs for assessing susceptibility in population-based case-control studies. Stat Med 13(2):153-162
[23] Qidwai T and Khan F. (2011) Tumor necrosis factor gene polymorphisms and disease prevalence. Scand J Immunol 74:522-547.
[24] Sanchez R, Levy E, Costea F, Sinnett D. (2009) IL-10 and TNF-alpha promoter haplotypes are associated with childhood Crohn's disease location. World J Gastroentero 15(30):3776-3782.
[25] Li N, Zhou Z, Liu X, Liu Y, Zhang J, Du L, et al. (2008) Association of tumour necrosis factor alpha (TNF-alpha) polymorphisms with Graves' disease: A meta-analysis. Clin Biochem 41:881-886.
susceptibility to multiple sclerosis. Clinical Immunology 139:277-281.
[27] Huizinga TW, Westendorp RG, Bollen EL, Keijsers V, Brinkman BMN, Langermans JAM, et al. (1997) TNF-alpha promoter polymorphisms, production and susceptibility to multiple sclerosis in different groups of patients. J Neuroimmunol 72:149-153.
[28] He B, Navikas V, Kundahl J, Soderstrom M, Hillert J. (1995) Tumor necrosis factor alpha -308 alleles in multiple sclerosis and optic neuritis. J Neuroimmunol 63:143-147.
[29] Kamali-Sarvestani E, Nikseresht A, Aflaki E, Sarvari J, Gharesi-Fard B. (2007) TNF-alpha, TNF-beta and IL-4 gene polymorphisms in Iranian patients with multiple sclerosis. Acta Neurol Scand 115:161-166.
[30] Sarial S, Shokrgozar MA, Amirzargar A, Shokri F, Radfar J, Zohrevand P et al. (2008) IL-1, Il-1R and TNF alpha gene polymorphisms in Iranian patients with multiple sclerosis. Iran J Allergy Asthma Immunol 7:37-40.
[31] Kroeger KM, Carville KS, Abraham LJ. (1997) The -308 tumor necrosis factor alpha promoter polymorphism effects transcription. Mol Immunol 34:391-399.
[32] Weinshenker BG, Wingerchuk DM, Liu Q, Bissonet AS, Schaid DJ, Sommer SS. (1997) Genetic variation in the tumor factor alpha gene and the outcome of multiple sclerosis. Neurology 49:378-385.
[33] Xu L, Yuan W, Sun H, Zhang X, Jia X, Shen C, et al. (2011) The polymorphisms of the TNF-α gene in multiple sclerosis?--a meta-analysis. Mol Biol Rep 38(6):4137-4144. [34] Yang Y, Sun R, Yang H, Zheng F, Gong F. (2011) -308 G > A of TNF-α gene promoter decreases the risk of multiple
sclerosis: a meta-analysis. Mult Scler 17(6):658-665. [35] [35] Husainova AN, Nasibullin TR, Tuktarova IA, et al.
(2011) Role of allelic variants of cytokine genes in the formation of hereditary predisposition to multiple sclerosis. New Tr Cyt 10:74–79.
[36] Lim S, Constantinescu CS. (2010) TNF-α: A paradigm of paradox and complexity in multiple sclerosis and its animal models. Open Autoimmun J 2:160-170.
[37] The Lenercept Multiple Sclerosis Study Group and The University of British Columbia MS/MRI Analysis Group. (1999) TNF neutralization in MS: results of a randomized, placebo controlled multicenter study. Neurology 53:457–465. [38] Day R. (2002) Adverse reactions to TNF-alpha inhibitors in
rheumatoid arthritis. Lancet 359:540-541.
[39] Hare NC, Hunt DPJ, Venugopal K, Ho GT, Beez T, Lees CW, et al. (2012) Multiple sclerosis in the context of TNF blockade and inflammatory bowel disease. QJM-Int J Med Jan 12 (Epub ahead of print)
[40] Jacob CO, Fronek Z, Lewis GD, Koo M, Hansen JA, McDevitt HO. (1990) Heritable major histocompatibility complex class II-associated differences in production of tumor necrosis factor alpha: relevance to genetic predisposition to systemic lupus erythematosus. Proc Natl Acad Sci 87(3):1233-1237.
![6,7,9,10 Tetrahydro 16,22 ethanooxyethano 5,8,11,19 tetraoxa 16,22 diazadibenzo[h,q]cyclooctadecine 17,21 dione: a benzylannelated macrobicyclic diamide](data:image/gif;base64,R0lGODlhAQABAIAAAP///wAAACH5BAEAAAAALAAAAAABAAEAAAICRAEAOw==)