warwick.ac.uk/lib-publications
Original citation:Penman, Bridget S. and Gupta, Sunetra. (2017) Detecting signatures of past pathogen selection on human HLA loci : are there needles in the haystack? Parasitology . pp. 1-12.
Permanent WRAP URL:
http://wrap.warwick.ac.uk/91349
Copyright and reuse:
The Warwick Research Archive Portal (WRAP) makes this work by researchers of the University of Warwick available open access under the following conditions. Copyright © and all moral rights to the version of the paper presented here belong to the individual author(s) and/or other copyright owners. To the extent reasonable and practicable the material made available in WRAP has been checked for eligibility before being made available.
Copies of full items can be used for personal research or study, educational, or not-for profit purposes without prior permission or charge. Provided that the authors, title and full bibliographic details are credited, a hyperlink and/or URL is given for the original metadata page and the content is not changed in any way.
Publisher’s statement:
This article has been published in a revised form in Parasitology
http://dx.doi.org/10.1017/S0031182017001159. This version is free to view and download for private research and study only. Not for re-distribution, re-sale or use in derivative works. © Cambridge University Press 2017.
A note on versions:
The version presented here may differ from the published version or, version of record, if you wish to cite this item you are advised to consult the publisher’s version. Please see the ‘permanent WRAP url’ above for details on accessing the published version and note that access may require a subscription
Title: Detecting signatures of past pathogen selection on human HLA loci: are there needles 1
in the haystack? 2
3
Authors: Bridget S Penman1 and Sunetra Gupta2
4
1. School of Life Sciences, University of Warwick, Coventry CV4 7AL
5
2. Department of Zoology, University of Oxford, Oxford, OX1 3PS
6
Running title: Understanding HLA evolution under multi-pathogen selection
7
Address for correspondence: Bridget Penman, School of Life Sciences, University of Warwick,
8
Coventry CV4 7AL, Tel: 024 761 50249, Email: [email protected]
Summary: 10
Human Leukocyte Antigens (HLAs) are responsible for the display of peptide fragments for
11
recognition by T cell receptors. The gene family encoding them is thus integral to human adaptive
12
immunity, and likely to be under strong pathogen selection. Despite this, it has proved difficult to
13
demonstrate specific examples of pathogen-HLA coevolution. Selection from multiple pathogens
14
simultaneously could explain why the evolutionary signatures of particular pathogens on HLAs have
15
proved elusive. Here, we present an individual-based model of HLA evolution in the presence of
16
two mortality-causing pathogens. We demonstrate that it is likely that individual pathogen species
17
causing high mortality have left recognizable signatures on the HLA genomic region, despite more
18
than one pathogen being present. Such signatures are likely to exist at the whole-population level,
19
and involve haplotypic combinations of HLA genes rather than single loci.
20
21
Key words: Human Leukocyte Antigen (HLA), Host pathogen coevolution, Pathogen selection,
22
Human evolution
Introduction 24
JBS Haldane’s 1949 paper Disease and Evolution (Haldane 1949) presaged human host-pathogen
25
coevolution as a field of study (Lederberg 1999). Haldane noted that the “surprising biochemical
26
diversity” exhibited by mammalian and avian species is likely a consequence of selection from
27
pathogens, with: “a particular race of bacteria or virus being adapted to individuals of a certain
28
range of biochemical constitution”. By way of example, Haldane pointed out that different human
29
blood group antigens may have determined the susceptibility of our ancestors to particular strains of
30
bacteria. At the conference where he presented this work, Haldane also introduced the hypothesis
31
that mutations responsible for heritable human blood disorders, such as the thalassaemias, had
32
spread in certain populations due to the protection they afforded their carriers against death from
33
malaria. Few today would dispute any of the arguments in Disease and Evolution, and the malaria
34
hypothesis has gone on to be confirmed as an example of selection from a specific pathogen
35
leaving a detectable signature on the human genome (Allison 1954; Siniscalco et al. 1961; Flint et
36
al. 1986; Hill et al. 1991).
37
While the list of malaria resistance loci continues to grow (Kwiatkowski 2005; Band et al.
38
2015), examples of genetic changes as a consequence of selection from any other known human
39
pathogen are few. In a review of the host genetics of human infection (Hill 2006), Adrian Hill
40
highlighted 6 human genes known to have a particularly strong impact on disease susceptibility. Of
41
these, three are malaria resistance loci. The fourth is the prion protein gene, for which the selective
42
agent is a special case of human infectious disease, consisting as it does of transmissible prion
43
proteins themselves. The fifth is a deletion in the gene for C-C chemokine receptor type 5
44
(CCR5Δ32), which offers near complete resistance to HIV infection in the homozygous state (Dean
45
et al. 1996; Huang et al. 1996; Liu et al. 1996). However, the high frequency of this mutation in
46
Northern European populations cannot be attributed to selection from HIV since it is such a recent
47
addition to the set of human pathogens. Smallpox and the plague have been suggested as
48
potential selective pressures to account for the distribution of CCR5Δ32, with smallpox shown to be
49
a theoretically more plausible candidate (Galvani and Slatkin 2003), but the cases for either are
weak (Hummel et al. 2005; Hedrick and Verrelli 2006), and others have suggested that CCR5
51
diversity may not be a consequence of any recent selection (Sabeti et al. 2005). The sixth gene
52
highlighted by Hill is that encoding fucosyltransferase 2. A loss-of-function mutation in this gene
53
affords resistance to Norwalk-like virus (Lindesmith et al. 2003; Thorven et al. 2005), and other
54
diarrhoea-causing pathogens (Imbert-Marcille et al. 2014) - but it is not clear to what extent
55
selection from these pathogens (or perhaps a combination of these and other infectious diseases)
56
have determined the frequency of the mutation worldwide.
57
Haldane himself foresaw the difficulty of detecting human biochemical adaptations to
58
pathogens, due to the transient nature of the advantage in most cases: “a disease such as
59
diphtheria or tuberculosis is caused by a number of biochemically different races of pathogens … in
60
a different epidemic a different a different type [of host] would be affected” (Haldane 1949). Our
61
best-understood examples of Plasmodium falciparum malaria resistance mutations
62
(haemoglobinopathies, glucose-6 phosphate dehydrogenase deficiency, southeast Asian
63
ovalocytosis) all cause far reaching changes to red blood cell physiology, changes which are likely
64
to affect multiple, even all, strains of P. falciparum. Were it not for the fact that these mutations all
65
cause severe physiological problems in the homozygous state, and are thus under balancing
66
selection, we may never have detected them as resistance mutations at all since they might have
67
become fixed in an ancestral human population.
68
69
One set of diverse human proteins which are prime candidates for Haldane’s notion of biochemical,
70
pathogen strain specific adaptation are the human leukocyte antigens (HLAs). Class I and class II
71
HLA molecules are responsible for the display of intracellularly derived peptide antigens (class I)
72
and extracellularly derived peptide antigens (class II) so that they can be recognised by T cell
73
receptors. The nature of the HLA molecule binding cleft determines the type of peptide which can
74
be presented, creating a potential recognition bottleneck in human adaptive immunity. Hundreds of
75
different alleles have been reported at the 3 class I loci and the 3 paired class II loci responsible for
76
peptide display (HLA-A, B and C in class I and HLA-DRA and HLA-DRB, HLA-DPA and HLA-DPB
and HLADQA and HLADQB in class II) - polymorphism which has been attributed to selection, most
78
likely from pathogens (Doherty and Zinkernagel 1975; Hughes and Nei 1988; Parham et al. 1989;
79
Takahata and Nei 1990; Hedrick 2002; Borghans et al. 2004; De Boer et al. 2004; Prugnolle et al.
80
2005; Lenz 2011; Eizaguirre et al. 2012a; Eizaguirre et al. 2012b). It has in particular been argued
81
that host-pathogen coevolution as opposed to heterozygote advantage is necessary to maintain
82
such levels of polymorphism (Borghans et al. 2004). Specific HLA genotypes have been shown to
83
confer susceptibility or resistance to different infectious disease outcomes (e.g. Hill et al. 1991;
84
Kaslow et al. 1996; Jeffery et al. 1999; Dunstan et al. 2014). A recent study comparing the genetic
85
diversity of an indigenous North American population before and after the arrival of European
86
invaders (and their pathogens), found a dramatic change in the frequency of a HLA-DQA1 allele
87
(Lindo et al. 2016), which might reflect that population’s changing experience of infectious disease.
88
Population-level evolution of the pathogen HIV has been shown to occur in response to the
89
immunological selection pressure generated by the presence of particular HLA types (Cotton et al,
90
2014; Payne et al. 2014), emphasising the co evolutionary potential of pathogen/HLA interactions.
91
Although, as previously noted, HIV is unlikely to have had enough time to drive substantial changes
92
in human allele frequencies, the relationship between HIV and HLA is worth considering in more
93
detail, since it is the best studied pathogen-HLA interaction to date, with data drawn from cohorts of
94
thousands of patients (reviewed in McLaren and Carrington, 2015). Certain HLA alleles are
95
associated with better viral control and a slower progression to AIDS (e.g. HLA B*57 and HLA B*27
96
alleles), whilst others are associated with faster progression to AIDS (e.g. some HLA B*35 alleles).
97
As noted by McLaren and Carrington, many individuals with a protective HLA type progress to AIDS
98
at a similar rate to those without, thus there is no HLA allele which guarantees control of HIV.
99
However, even though protection is not consistent across individuals, a chimpanzee MHC–B
100
variant, Patr-B*06:03, with structural similarities to HLA B*57, is associated with lower SIV loads in 101
chimpanzee faecal samples (Wroblewski et al 2015) – demonstrating that aspects of the way 102
HLA/MHC molecules help combat retroviruses may be consistent across species. Recent studies
103
have been able to identify the amino acids present at specific sites in HLA binding grooves which
account for protective effects previously identified at the allelic level – underscoring that the specific
105
properties of the peptides that HLA molecules are capable of presenting to T cells has a critical
106
impact on disease progression (The International HIV Controllers Study, 2010; McLaren et al 2015).
107
However, the expression level of HLA-C has also been shown to have a protective effect, with
108
higher expression of HLA-C associated with better viral control (Thomas et al, 2009; Kulkarni et al
109
2011; Apps et al 2013). Whether the protective effect of HLA-C expression level is due to better
110
presentation to T cells, or to interactions with other elements of the immune system (e.g. Natural
111
Killer cells) is unknown.
112
We have previously shown that a multi-strain pathogen and multi-gene host HLA haplotypes have
113
the potential to display complex co-evolutionary cycling (Penman et al. 2013). Within the framework
114
we proposed, at any given time only a small subset of host homozygotes would be susceptible to
115
severe infection. The nature of that subset depended on the state of the pathogen population.
116
However, this generated enough selection pressure to drive long lasting non-overlapping
117
associations between alleles at separate HLA loci, even in the presence of recombination between
118
those loci. We proposed that such non-overlapping associations could be a signature of pathogen
119
selection and could even be harnessed as a means to functionally classify different HLAs. Our
120
original model, however, included only a single pathogen species. HLAs must be under selection
121
from multiple pathogens simultaneously. Here we simulate the co-evolution of two linked HLA loci
122
with two independently circulating pathogens, where antigens from either pathogen can be
123
displayed at either HLA locus. We show that, despite conflicting selection from a second pathogen,
124
a pathogen that causes consistent, high mortality could theoretically leave a strong signature in HLA
125
population genetics.
126
127
Methods 128
We adopted an individual-based simulation approach, extending that described in (Penman et al.
129
2013). We considered 10 different HLA binding types (represented by the digits 1-10), which could
be found on HLA molecules encoded by either of 2 linked HLA loci in the host genome. There was
131
no restriction on which binding properties could be present at which HLA locus, which meant there
132
were 100 possible HLA haplotypic combinations ([1,1]; [1,2]; [1,3] …. [10,10]) in our simulated
133
population, arranged into diploid host genotypes. Once a host had been infected with a pathogen
134
expressing a peptide which could be displayed by an HLA molecule encoded in that host’s genome,
135
we assumed that host to have lifelong immunity against infection with any other pathogen of that
136
species expressing that peptide.
137
We assumed that two pathogen species were present (1 and 2). Each species possessed a
138
number of antigenically variant peptides, expressed at two different sites per pathogen, and defined
139
by the HLAs which could bind them (i.e. a digit between 1 and 10). We allowed 4 variants per
140
antigenic site on each pathogen, thus 16 possible strains of each pathogen (Kij). The distribution of
141
variant peptides which could be displayed by particular HLA binding types for each antigenic site on
142
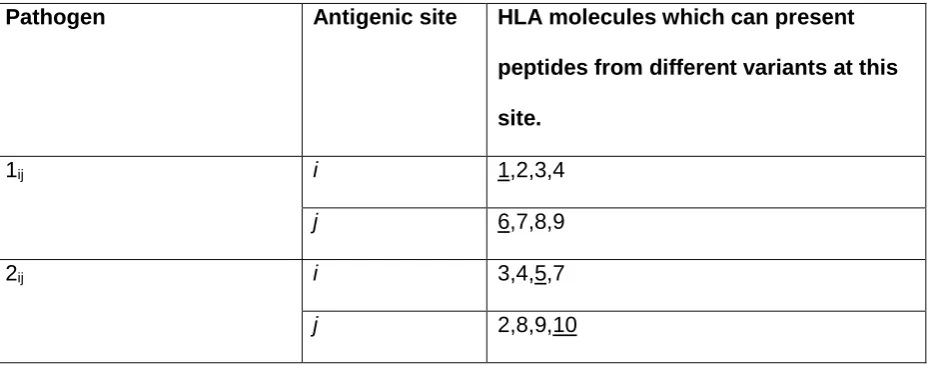
each pathogen is given in table 1. A visualization of the relationship between host HLA genotype
143
and pathogen strains is provided in Figure 1.
144
HLA binding types 1 and 6 only present motifs from pathogen 1. HLA binding types 5 and 10
145
only present motifs from pathogen 2. All other HLA binding types can present motifs from either
146
pathogen. We assumed no cross immunity between the pathogens, thus whatever peptide from
147
pathogen Kij happened to be displayed by HLA i would not elicit any memory immune response
148
against a peptide from pathogen Lij that could also be displayed by HLA i.
149
150
Each host in the population was represented by a vector containing the host’s age, sex, diploid HLA
151
genotype, infection status and immunological status. A maximum of 2000 hosts could exist in the
152
population, but this maximum did not have to be present at every time step. If, in a given
153
generation, the population size ever dropped down to or below an arbitrarily chosen threshold (for
154
the simulations shown here, 20 individuals), the population was deemed to have failed and that
155
particular simulation ceased.
A single time step of our simulation represented one day. During each day, every host could (with
157
probabilities defined in Table 2) become infected; recover from infection, or die from infection or die
158
by random chance. Every time step, adult (>5400 days (~15 years) old) female hosts could also
159
reproduce with a given probability, choosing a male partner at random, and generating an offspring
160
genotype via Mendelian inheritance. For the simulations shown here, the age of reproducing males
161
was not restricted to >15 years, but applying such a restriction makes no difference to the
162
conclusions. An individual with the offspring genotype was then added to the population. If the
163
population happened to be at its maximum possible size of 2000 then the new individual replaced a
164
randomly chosen existing member of the population.
165
Every time a new infection occurred, one of that pathogen’s antigenic sites could mutate so
166
that it expressed one of the other peptides possible at that site with probability m. Every time hosts
167
reproduced, recombination could occur between the two HLA loci, (in either maternal or paternal
168
genotype) with probability r. For simplicity, our model does not explicitly simulate HLA mutation:
169
over the timescale simulated, in a small population, frequency changes of existing HLA variation are
170
likely to be more important than the spontaneous emergence of new HLA variants. However, each
171
time step there was a fixed probability (α) of a new host individual, of randomly generated diploid
172
genotype selected from HLA genes 1-10, replacing a randomly chosen existing member of the
173
population. This represents migration into the population and ensured that the stochastic loss from
174
the population of one of the pathogen species, or of a particular HLA binding specificity, was not
175
permanent.
176
177
Parameter values and starting conditions
178
Our purpose was to determine whether it is possible that a specific pathogen species should leave a
179
population genetic signature in the HLA region, despite conflicting selection pressures from other
180
pathogens. Our analyses therefore focused on varying the probabilities of death from infection
181
associated with the two pathogens (θ1andθ2). We varied θ1between 0 and 0.0001 per day, and θ2
182
between 0 and 0.002 per day. For most of our simulations, θ1 and θ2 applied to hosts of any age,
but we also explored whether our conclusions would change if infectious disease mortality only
184
affected young children. To achieve this we carried out separate simulations where we only applied
185
probabilities θ1 and θ2 of dying whilst infected to those < 1800 days (~5 years) old.
186
For pathogen 1, the transmission parameter and the probability of recovering from infection
187
during any given day were always β1= 0.3 and σ1= 0.02. When pathogen 2 was continuously
188
present, we also applied β2= 0.3 and σ2= 0.02. However, we additionally sought to investigate the
189
consequences of the periodic loss of pathogen 2 from the population. To generate this behaviour
190
we applied a higher transmission parameter (β2= 0.4) and a higher probability of recovering from
191
infection on any given day (σ2= 0.1).
192
Rates of recombination in the HLA region appear to vary considerably (Carrington 1999,
193
Cullen et al 2002). The results in the main text use a value of r =0, thus are more likely to apply to
194
HLA loci that are physically very close, but we explore the effects of two higher recombination
195
probabilities (r=0.01 and a very high probability of r=0.05) in the supplementary material.
196
197
All other parameters were fixed at values chosen to be plausible for human populations. The
198
probability of dying from non-infectious disease causes on any given day (µ) was = 0.00007, and
199
the probability of a female over the age of 5400 days (~15 years) giving birth on any given day (ϖ)
200
was = 0.0015. These values ensured that the population exhibited a plausible age distribution for a
201
human population in the absence of modern medicine: pyramidal in shape, with the greatest
202
numbers of individuals in the youngest age groups and ~5% or less of the population over the age
203
of 40 years (see figure S1). The probability of a new individual of a random genotype entering the
204
population during any day was set at α = 0.000278, equivalent to assuming a migrant might arrive
205
on average once every 3600 days, and the mutation probability of the pathogen was set at m=
206
0.00001 per new infection.
207
At the start of each simulation, 1000 hosts were present, with ages randomly assigned between 1
209
and 12600 days (~35 years). 90% of the HLA haplotypes in the population were of the combination
210
[3,3], intended to capture the fact that a human population might be dominated by a relatively small
211
number of founding HLA haplotypes. The remaining 10% of HLA haplotypes present were
212
generated at random from the 10 possible HLA binding types. No hosts had any preexisting
213
immunity to either pathogen at the start of the simulation. To seed infections, 10 hosts were chosen
214
at random to be infected with randomly generated strains of pathogen 1, and 10 with randomly
215
generated strains of pathogen 2. The simulations ran for 270000 days (~740 years). For each
216
parameter combination presented in the main text or the supplementary material we carried out 300
217
simulations.
218
219
Results 220
i. High mortality from a single pathogen selects for host HLA haplotypes which 221
recognise as many variants as possible from a single antigenic site on that 222
pathogen. 223
We first considered the behaviour of the model when just one of the two pathogens caused
224
mortality. We observed that when the mortality caused by pathogen K is very high, the two
225
most frequent host haplotypes in the population after 740 years of coevolution contained within
226
them exactly the 4 HLA binding types required to display all of the possible variants present at
227
one of the antigenic loci belonging to pathogen K. Figure 2 displays the results of a simulation
228
exhibiting such adaptation as a consequence of high levels of mortality from pathogen 2. [5,4]
229
and [7,3] dominate the population, and between them could present any peptide that could be
230
displayed at locus 1 of pathogen 2.
231
As noted in the Methods, we started each simulation with the population containing a high
232
frequency of a single haplotype. Figure 2C shows that the high level of homozygosity (Hobs)
233
associated with this state declines as pathogen selection begins, but as adaptation to pathogen
2 emerges, homozygosity rises once more – reflecting the high frequency of only a few HLA
235
haplotypes in the adapted population.
236
237
Taking the behaviour shown in figure 2 as the most extreme form of population genetic
238
adaptation possible, we defined 3 levels of population genetic adaptation to a multi-strain
239
pathogen, which should occur at different pathogen mortality rates:
240
(i) weak adaptation to pathogen K : one of the two most frequent HLA haplotypes in the
241
population can display one of pathogen K’s unique motifs.
242
(ii) moderate adaption to pathogen K : the two most frequent HLA haplotypes in the host
243
population contain exactly the 4 HLA types required to display all of the possible variants
244
present at one of pathogen K’s two antigenic loci, and the combined frequency of those
245
two haplotypes is <=50%
246
(iii) strong adaptation to pathogen K : the two most frequent haplotypes in the population
247
contain exactly the 4 HLA types required to display all of the possible variants present at
248
one of pathogen K’s two antigenic loci, and the combined frequency of those two
249
haplotypes is >50%. This is the case represented in figure 2.
250
251
ii. A high mortality pathogen can leave a strong genetic signature despite conflicting 252
selection from a second pathogen 253
Figure 3 illustrates the population genetic patterns observed when both pathogens 1 and 2 cause
254
mortality, and are continuously present in the population. The strength of adaptation to pathogen 2
255
increases with the probability of mortality whilst infected with pathogen 2 (indicated on the x axis in
256
each graph).
257
Adaptation to pathogen 2 at high levels of mortality occurs despite the presence of conflicting
258
selection from pathogen 1 (figures 3B and 3C). Mortality from pathogen 1 at a low level (figure 3B)
259
barely disrupts adaptation to pathogen 2 at all, despite the greater pathogen burden on the
population evidenced by the reduction in population survival. A higher level of pathogen 1 mortality
261
(figure 3C) is associated with some reductions in the probability of observing adaptation to pathogen
262
2, but so long as pathogen 2 has the greater probability of causing mortality (bars to the right of the
263
red lines in figure 3), there is a greater probability that the population will display a form of
264
adaptation to pathogen 2 than pathogen 1 (54% adaptation to pathogen 2 , 27% adaptation to
265
pathogen 1 at θ2 =0.00015; 47% adaptation to pathogen 2 , 37% adaptation to pathogen 1 at θ2
266
=0.0002).
267
When both pathogens 1 and 2 cause a high level of mortality, we might have expected the
268
conflicting selection pressures to lead to many simulated populations displaying no obvious
269
adaptation. However, as seen in figure 3C, where both θ1 =0.0001 and θ2 =0.0001 (i.e. the
270
pathogens have identical mortality probabilities), 89% of simulations display adaptation to one or
271
other pathogen. At this level of pathogen 2 mortality, adding mortality from pathogen 1 simply
272
increases the probability of observing any population adaptation at all. When θ1 =0 and θ2 =0.0001,
273
52% of simulations display no adaptation (figure 3A); when θ1 =0.00005 and θ2 =0.0001 , 47% of
274
simulations display no adaptation (figure 3B), but when θ1 =0.0001 and θ2 =0.0001 , only 11% of
275
simulations display no adaptation (figure 3C).
276
277
The patterns just described are largely unchanged by the addition of recombination (figures S2 and
278
S3). However, the probability of observing strong adaptation to pathogen 2 in the presence of high
279
mortality from pathogen 1 is reduced at 5% recombination between the HLA loci (figure S3C). Our
280
definition of strong population adaptation involves the top two HLA haplotypes in the population
281
having a combined frequency >50%. Recombination breaks up haplotypic associations, thus it is
282
entirely reasonable that high levels of recombination should make strong adaptation less likely.
283
Nevertheless, adaptation to pathogen 2 itself (when weak, moderate and strong forms are taken
284
together) increases with increasing pathogen 2 mortality in our simulations at 5% recombination
285
(figure S3C), despite the conflicting selection from pathogen 1.
287
When we limited infectious disease mortality to individuals < 5 years of age, we obtained similar
288
patterns at higher values of θ1 and θ2. (figure S4).To achieve a selective pressure capable of
289
shaping the population’s HLA distribution when individuals are only vulnerable to infectious disease
290
mortality for a short period of time requires higher individual probabilities of death from infection
291
within that window of vulnerability.
292
293
iii. High mortality pathogens are less likely to leave a strong genetic signature if their 294
presence in the population is not continuous 295
If we allow pathogen 2 to have a faster recovery rate and a higher transmission probability we can
296
generate scenarios where pathogen 2 can become lost from the population due to burning through
297
its available susceptible hosts. Following such stochastic loss, pathogen 2 can be re introduced by
298
an infected host arriving in the host as a random introduction. As shown in figure 4, weak,
299
moderate or strong adaptation to an intermittently present pathogen 2 can still be observed if
300
pathogen 2 causes mortality. However, the greater the mortality caused by the continuously present
301
pathogen 1, the more likely we are to observe adaptation to pathogen 1 at the expense of
302
adaptation to pathogen 2, and the less likely we are to observe moderate or strong adaptation to
303
pathogen 2 (compare panels 4A, 4B and 4C). A low level of mortality from the continuously present
304
pathogen 1 (θ1 = 0.0005) causes more loss of adaptation to the intermittently present pathogen 2
305
than when pathogen 2 was continuously present (compare figures 4B and 3B).
306
307
In figure 4, we allowed the intermittently present pathogen 2 much higher mortality rates than the
308
continuously present pathogen 1, so as to maximise the selective pressure caused by pathogen 2.
309
As shown in the left hand panels in figure 4, at the highest mortality probabilities, the pathogen load
310
approaches that at which most populations do not survive. Interestingly, however, increasing the
311
probability of death from infection with pathogen 2 seems to have little impact on the probability of
observing a population specifically adapted to pathogen 2 (compare the left to right trends within the
313
graphs in figure 4 with the graphs in figure 3). It may be that for mortality-causing pathogens which
314
are only present intermittently, the frequency of the exposure of the population to the pathogen is
315
more important than the chance of dying whilst infected in determining whether or not the population
316
exhibits population genetic adaptation to that pathogen. Additionally, too high a mortality rate for
317
pathogen 2 may contribute to its rapid loss from the population during any individual epidemic,
318
which could also reduce its ability to leave a population genetic signature.
319
320
When we allowed recombination to occur between the HLA loci, we observed a clear reduction in
321
the probability of observing strong population adaptation to the intermittently present pathogen
322
(pathogen 2) [figures S5 and S6]. At 5% recombination between the loci we never observed strong
323
adaptation to pathogen 2 (figure S6), although weak and moderate adaptation was still possible. As
324
noted previously, this effect is unsurprising, since our definition of strong population adaptation
325
involves >50% of the HLA haplotypes in the population being adapted to the pathogen in question.
326
If pathogen 2 is only intermittently present, every time it is absent from the population,
327
recombination will act unchecked to break up the haplotypic combinations that are specifically
328
adapted to pathogen 2 – thus maintaining combined frequencies of such haplotypes >50% is
329
unlikely.
330
331
Discussion 332
Our simulations demonstrate that individual high-mortality pathogens have the potential to generate
333
specific signatures amongst HLA genes, despite conflicting selection from other mortality-causing
334
pathogens. These signatures take the form of population-level HLA haplotype frequency patterns.
335
The most important implications of our two-pathogen model can be summarized as follows:
336
(i) The greater the overall pathogen burden, the more likely a population is to display
337
specific adaptation to any pathogen.
(ii) For continuously-present pathogens, the higher the pathogen mortality, the more likely
339
the pathogen is to leave a signature.
340
(iii) Population genetic signatures of adaptation to intermittently-present pathogens can be
341
readily disrupted by selection from continuously present pathogens, and the lethality of
342
an intermittently present pathogen per se is not a predictor of whether adaptation will
343
occur.
344
Pathogens which are likely to have caused high levels of mortality for continuous periods in the
345
history of various human populations include Plasmodium falciparum, Leishmania spp.
346
Mycobacterium tuberculosis, Streptococcus pneumoniae, Treponema pallidum, Poliovirus, Smallpox
347
Virus and Yellow Fever virus. Our simulations suggest that pathogens such as these might be more
348
likely to have determined the array of HLA haplotypes that successfully reached high frequencies in
349
affected populations than characteristically intermittent pathogens such as Bacillus anthracis,
350
Yersinia pestis or Rickettsia spp. We demonstrated that the mortality rate of an intermittently
351
present pathogen has little effect on the probability of observing adaptation to that pathogen, and
352
speculated that the frequency of introduction of intermittently present pathogens may be more
353
important. However, to make any prediction of the frequency of introduction and/or duration of
354
epidemics necessary for any given intermittent pathogen to have left an HLA signature will require
355
additional theoretical work, as well as improved understanding of the strain diversity present in the
356
pathogen species of interest.
357
358
Although the population genetic signatures of pathogen selection we have identified take the form of
359
HLA haplotype frequency patterns, our model makes no explicit assumption that selection acts at
360
the allelic or haplotypic level. However, we do assume that the effects of being able to express
361
different HLA molecules combine additively. This means that it is always advantageous to maximize
362
the diversity of HLA recognition types present in a host genome, and this in turn generates a
363
specific form of selection at the haplotypic level, for only certain combinations of haplotypes
364
maximize HLA recognition diversity when they coexist. Maximising recognition diversity certainly
seems likely to be a major factor in determining the evolution of HLA alleles and haplotypes – but it
366
is possible that HLA alleles interact with one another in non-additive ways too. The most obvious
367
ways in which this could occur are (i) if HLA expression level is important (as for HIV and HLA-C),
368
or (ii) if HLA alleles differ in the breadth of types of peptide that they can display (i.e. in their binding
369
promiscuity), which certainly affects MHC based infectious disease susceptibility in chickens
370
(Chappell et al, 2015), and which is also linked to expression level of the MHC/HLA molecule in
371
question (Chappell et al, 2015). The type of population genetic pattern which may result from
372
pathogen selection where HLA expression level or binding promiscuity (or both) is crucial is beyond
373
the scope of our present model, and allowing for such effects in future models is a priority.
374
375
Most pathogens possess greater antigenic diversity than that represented in our model, and
376
humans certainly possess greater HLA diversity. Furthermore, our definitions of “weak”, “moderate”
377
and “strong” patterns of selection rely on our complete knowledge of the modelled system and
378
which antigenic variants are expressed by which pathogens. These definitions are therefore not
379
intended to be applied directly to human populations (where such complete knowledge is beyond
380
our current understanding), but rather to illustrate the principle that the highest frequency HLA
381
haplotypes present in a given human population might represent “moderate” or “strong” population
382
genetic signatures of specific pathogens. In other words those haplotypes might, between them,
383
maximize the capacity of the human immune system to recognize the antigenic diversity present at
384
just one variable site of a single pathogen species, despite the fact that HLA loci are under selection
385
from multiple pathogen species. We propose that it is worth considering which of the
mortality-386
causing pathogens that have coexisted with particular populations for a long time could be
387
responsible for the elevation of particular combinations of HLA haplotypes. An additional important
388
principle to emerge from our model is that selection from identical pathogens could still result in
389
completely different suites of HLA haplotypes reaching high frequency in different populations,
390
depending on the antigenic site which happened to become immunodominant (i.e. the antigenic
391
site that population’s HLAs evolved to target).
393
Will it ever be feasible to measure the degree to which HLA recognition capacity in a population
394
prioritises the variants of a specific pathogen antigen? The immune epitope database (Vita et al.
395
2015) is an invaluable resource, collating our current knowledge of antibody and T cell epitopes. It
396
is, however, limited by the experiments which have so far been carried out, so does not represent
397
an unbiased sampling of epitopes that could be recognized. However, as epitope prediction
398
continues to improve for different MHC molecules, and as whole genome datasets become
399
available for more and more pathogens, it may become possible to look for correlations between the
400
highest frequency HLA haplotypes in specific populations and their capacity, across multiple HLA
401
loci, to recognize the variation encoded by candidate antigenic regions in high-mortality pathogen
402
genomes. If evolutionary HLA-pathogen relationships can be identified in this way, they will help
403
focus our attention on the most immunogenic elements of those pathogens, which will be of
404
enormous benefit to ongoing efforts to develop effective treatments and prophylaxis.
405
406
In the introduction we noted that selection from malaria parasites has had the most easily
407
measurable impact on human genetics. It is becoming clear, however, that understanding malaria
408
selection by examining a single locus at a time is insufficient: interactions between protective
409
mutations at separate loci can cancel out the malaria protective effect of both when they are
co-410
inherited (Williams et al. 2005). Furthermore, such epistasis may have determined the particular
411
suites of protective variants that co-exist in given populations (Penman et al. 2009; Penman et al.
412
2011; Penman et al. 2012). The simulations we present here demonstrate that these principles
413
could be usefully applied to understanding human-pathogen coevolution generally: adaptation to a
414
pathogen can take the form of the specific collection of alleles found across several loci, not the
415
particular variants found at only a single locus.
416
In addition to the likely non-additive fitness consequences of particular alleles at different
417
HLA loci, HLA alleles have been shown to interact epistatically with variants at Killer cell
Immunoglobulin like Receptor loci [KIRs] (Martin et al. 2002; Hiby et al. 2004; Khakoo et al. 2004;
419
Seich al Basatena et al. 2011). KIRs are Natural Killer Cell receptors which are very likely to be
420
undergoing co-evolution with pathogens (Parham and Moffett 2013; Carrillo-Bustamante et al. 2013;
421
Carrillo-Bustamante et al. 2014; Carrillo-Bustamante et al. 2015; Penman et al. 2016), and many
422
KIRs interact directly with HLA molecules in order to perform their function. The repertoire of KIR
423
alleles present in a particular population may thus also shape the set of HLA haplotypes that come
424
to dominate. Balancing selection for extremely high polymorphism in both HLAs and KIRs is
425
evident in a detailed study of a West African population (Norman et al. 2013). Cappittini et al
426
observed that A,B haplotypic combinations in an Italian population are configured so that
HLA-427
B alleles which do not serve as KIR ligands are more likely to be found alongside HLA-A alleles
428
which do serve as KIR ligands – maximizing the chance that at least one of HLA-A or HLA–B in an
429
individual’s genome should have an interacting KIR (Capittini et al. 2012). It has also been shown
430
that class I HLAs tend to exist in haplotypes that either combine HLA-B and -C KIR ligands, or have
431
HLA B alleles which are able to supply ligands for another Natural Killer Cell receptor, CD94:NKG2A
432
(Horowitz et al 2016). Such effects will have acted alongside selection from specific pathogens in
433
determining the HLA patterns that have emerged in individual populations, and incorporating them
434
in future simulation models will assist in attempts to delineate the population genetic signatures of
435
both.
436
437
Theoretical work on generalised host-pathogen systems has shown that selection from two
438
independent pathogens, interacting with two separate host loci, can drive the evolution of “high
439
complementarity equilibria” whereby the host loci exhibit strong linkage disequilibrium (Kouyos et al.
440
2009). For that specific type of population genetic patterning to emerge, both pathogens would have
441
to be present. Here we have focused on the confounding effects of dual pathogen selection to
442
show that a single pathogen can still drive population genetic patterning even when a second
443
pathogen interacts with the same loci. However, future work should also consider the situation
444
where a subset of pathogens interact solely with a subset of HLA loci, and other pathogens interact
solely with a different subset – the overarching population genetic rules governing the associations
446
between different sets of alleles at different HLA loci are likely to be affected by such structuring.
447
448
Conclusion 449
As Haldane pointed out, surviving infectious disease is on a par with the pressure to find food or
450
successfully mate in terms of evolutionary significance. For human-pathogen coevolution, the case
451
for malaria selection is clear, but we have few other examples of infectious diseases that can be
452
linked directly to changes in human allele frequencies. Our simulations suggest that evolutionary
453
signatures of specific, continuously present, high mortality human pathogens should exist in the
454
form of particular combinations of HLA haplotypes. Identifying and understanding such patterns
455
could ultimately pay dividends as we seek to mitigate or emulate the contributions of different
456
genotypes to human health.
457
458
Acknowledgments 459
S.G. receives funding from the European Research Council under the European Union's Seventh 460
References 462
Allison A. C. 1954. Protection afforded by sickle-cell trait against subtertian malareal infection.
463
British medical journal 1: 290-294.
464
Apps R., Qi Y., Carlson J. M., Chen H., Gao X., Thomas R., Yuki Y., Del Prete G. Q., Goulder P.,
465
Brumme Z. L., Brumme C. J., John M., Mallal S., Nelson G., Bosch R., Heckerman D., Stein J. L.,
466
Soderberg K. A., Moody M. A., Denny T. N., Zeng X., Fang J., Moffett A., Lifson J. D., Goedert J. J.,
467
Buchbinder S., Kirk G. D., Fellay J., McLaren P., Deeks S. G., Pereyra F., Walker B., Michael N. L.,
468
Weintrob A., Wolinsky S., Liao W. and Carrington M. 2013. Influence of HLA-C expression level on
469
HIV control. Science 340: 87-91.
470
Band G., Rockett K. A., Spencer C. C. A., Kwiatkowski D. P., Si Le Q., Clarke G. M., Kivinen K.,
471
Leffler E. M., Cornelius V., Conway D. J., Williams T. N., Taylor T., Bojang K. A., Doumbo O., Thera
472
M. A., Modiano D., Sirima S. B., Wilson M. D., Koram K. A., Agbenyega T., Achidi E., Marsh K.,
473
Reyburn H., Drakeley C., Riley E., Molyneux M., Jallow M., Pinder M., Toure O. B., Konate S.,
474
Sissoko S., Bougouma E. C., Mangano V. D., Amenga-Etego L. N., Ghansah A. K., Hodgson A. V.
475
O., Wilson M. D., Ansong D., Enimil A., Evans J., Apinjoh T. O., Macharia A., Ndila C. M., Newton
476
C., Peshu N., Uyoga S., Manjurano A., Kachala D., Nyirongo V., Mead D., Drury E., Auburn S.,
477
Campino S. G., MacInnis B., Stalker J., Gray E., Hubbart C., Jeffreys A. E., Rowlands K., Mendy A.,
478
Craik R., Fitzpatrick K., Molloy S., Hart L., Hutton R., Kerasidou A. and Johnson K. J. 2015. A novel
479
locus of resistance to severe malaria in a region of ancient balancing selection. Nature 526:
253-480
257.
481
Borghans J. A. M., Beltman J. B. and De Boer R. J. 2004. MHC polymorphism under host-pathogen
482
coevolution. Immunogenetics 55: 732-739.
483
Capittini C., Tinelli C., Guarene M., Pasi A., Badulli C., Sbarsi I., Garlaschelli F., Cremaschi A. L.,
484
Pizzochero C., Monti C., Salvaneschi L. and Martinetti M. 2012. Possible KIR-driven genetic
485
pressure on the genesis and maintenance of specific HLA-A,B haplotypes as functional genetic
486
blocks. Genes and immunity 13: 452–457
487
Carrillo-Bustamante P., Kesmir C. and De Boer R. J. 2015. A coevolutionary arms race between
488
hosts and viruses drives polymorphism and polygenicity of NK cell receptors. Molecular biology and
489
evolution 32: 2149-2160.
490
Carrillo-Bustamante P., Kesmir C. and de Boer R. J. 2014. Quantifying the protection of activating
491
and inhibiting NK cell receptors during infection with a CMV-like virus. Frontiers in Immunology 5:20
492
Carrillo-Bustamante P., Kesmir C. and de Boer R. J. 2013. Virus Encoded MHC-Like Decoys
493
Diversify the Inhibitory KIR Repertoire. PLoS Computational Biology 9(10): e1003264
494
https://doi.org/10.1371/journal.pcbi.1003264
495
Carrington M. 1999. Recombination within the human MHC. Immunological reviews 167: 245-256.
496
Chappell P., Meziane E. K., Harrison M., Magiera L., Hermann C., Mears L., Wrobel A. G., Durant
497
C., Nielsen L. L., Buus S., Ternette N., Mwangi W., Butter C., Nair V., Ahyee T., Duggleby R.,
498
Madrigal A., Roversi P., Lea S. M. and Kaufman J. 2015. Expression levels of mhc class i molecules
499
are inversely correlated with promiscuity of peptide binding. eLife 2015.
500
Cotton L. A., Kuang X. T., Le A. Q., Carlson J. M., Chan B., Chopera D. R., Brumme C. J., Markle T.
501
J., Martin E., Shahid A., Anmole G., Mwimanzi P., Nassab P., Penney K. A., Rahman M. A., Milloy
502
M. -., Schechter M. T., Markowitz M., Carrington M., Walker B. D., Wagner T., Buchbinder S., Fuchs
J., Koblin B., Mayer K. H., Harrigan P. R., Brockman M. A., Poon A. F. Y. and Brumme Z. L. 2014.
504
Genotypic and Functional Impact of HIV-1 Adaptation to Its Host Population during the North
505
American Epidemic. PLoS Genetics 10(4): e1004295. https://doi.org/10.1371/journal.pgen.1004295
506
Cullen M., Perfetto S. P., Klitz W., Nelson G. and Carrington M. 2002. High-resolution patterns of
507
meiotic recombination across the human major histocompatibility complex. American Journal of
508
Human Genetics 71: 759-776.
509
De Boer R. J., Borghans J. A. M., Van Boven M., Kesmir C. and Weissing F. J. 2004. Heterozygote
510
advantage fails to explain the high degree of polymorphism of the MHC. Immunogenetics 55:
725-511
731.
512
Dean M., Carrington M., Winkler C., Huttley G. A., Smith M. W., Allikmets R., Goedert J. J.,
513
Buchbinder S. P., Vittinghoff E., Gomperts E., Donfield S., Vlahov D., Kaslow R., Saah A., Rinaldo
514
C., Detels R. and O'Brien S. J. 1996. Genetic restriction of HIV-1 infection and progression to AIDS
515
by a deletion allele of the CKR5 structural gene. Science 273: 1856-1862.
516
Doherty P. C. and Zinkernagel R. M. 1975. Enhanced immunological surveillance in mice
517
heterozygous at the H-2 gene complex. Nature 256: 50-52.
518
Dunstan S. J., Hue N. T., Han B., Li Z., Tram T. T. B., Sim K. S., Parry C. M., Chinh N. T., Vinh H.,
519
Lan N. P. H., Thieu N. T. V., Vinh P. V., Koirala S., Dongol S., Arjyal A., Karkey A., Shilpakar O.,
520
Dolecek C., Foo J. N., Phuong L. T., Lanh M. N., Do T., Aung T., Hon D. N., Teo Y. Y., Hibberd M.
521
L., Anders K. L., Okada Y., Raychaudhuri S., Simmons C. P., Baker S., De Bakker P. I. W., Basnyat
522
B., Hien T. T., Farrar J. J. and Khor C. C. 2014. Variation at HLA-DRB1 is associated with
523
resistance to enteric fever. Nature genetics 46: 1333-1336.
524
Eizaguirre C., Lenz T. L., Kalbe M. and Milinski M. 2012a. Rapid and adaptive evolution of MHC
525
genes under parasite selection in experimental vertebrate populations. Nature Communications
526
3:621
527
Eizaguirre C., Lenz T. L., Kalbe M. and Milinski M. 2012b. Divergent selection on locally adapted
528
major histocompatibility complex immune genes experimentally proven in the field. Ecology Letters
529
15: 723-731.
530
Flint J., Hill A. V. S. and Bowden D. K. 1986. High frequencies of α-thalassaemia are the result of
531
natural selection by malaria. Nature 321: 744-750.
532
Galvani A. P. and Slatkin M. 2003. Evaluating plague and smallpox as historical selective pressures
533
for the CCR5-Δ32 HIV-resistance allele. Proceedings of the National Academy of Sciences of the
534
United States of America 100: 15276-15279.
535
Haldane J. B. S. 1949. Disease and Evolution. Ricerca Scientifica (suppl) 19: 68.
536
Hedrick P. W. 2002. Pathogen resistance and genetic variation at MHC loci. Evolution 56:
1902-537
1908.
538
Hedrick P. W. and Verrelli B. C. 2006. 'Ground truth' for selection on CCR5-Δ32. Trends in Genetics
539
22: 293-296.
540
Hiby S. E., Walker J. J., O'Shaughnessy K. M., Redman C. W. G., Carrington M., Trowsdale J. and
541
Moffett A. 2004. Combinations of maternal KIR and fetal HLA-C genes influence the risk of
542
preeclampsia and reproductive success. Journal of Experimental Medicine 200: 957-965.
Hill A. V. S. 2006. Aspects of genetic susceptibility to human infectious diseases. Annual Review of
544
Genetics 40: 469-486.
545
Hill A. V. S., Allsopp C. E. M., Kwiatkowski D., Anstey N. M., Twumasi P., Rowe P. A., Bennett S.,
546
Brewster D., McMichael A. J. and Greenwood B. M. 1991. Common West African HLA antigens are
547
associated with protection from severe malaria. Nature 352: 595-600.
548
Horowitz A., Djaoud Z., Nemat-Gorgani N., Blokhuis J., Hilton H. G., Béziat V., Malmberg K.,
549
Norman P. J., Guethlein L. A. and Parham P. 2016. Class I HLA haplotypes form two schools that
550
educate NK cells in different ways. Science Immunology 1: eaag1672
551
Huang Y., Paxton W. A., Wolinsky S. M., Neumann A. U., Zhang L., He T., Kang S., Ceradini D., Jin
552
Z., Yazdanbakhsh K., Kunstman K., Erickson D., Dragon E., Landau N. R., Phair J., Ho D. D. and
553
Koup R. A. 1996. The role of a mutant CCR5 allele in HIV-1 transmission and disease progression.
554
Nature medicine 2: 1240-1243.
555
Hughes A. L. and Nei M. 1988. Pattern of nucleotide substitution at major histocompatibility complex
556
class I loci reveals overdominant selection. Nature 335: 167-170.
557
Hummel S., Schmidt D., Kremeyer B., Herrmann B. and Oppermann M. 2005. Detection of the
558
CCR5-Δ32 HIV resistance gene in Bronze Age skeletons. Genes and immunity 6: 371-374.
559
Imbert-Marcille B. -., Barbé L., Dupé M., Le Moullac-Vaidye B., Besse B., Peltier C., Ruvoën-Clouet
560
N. and Le Pendu J. 2014. A FUT2 gene common polymorphism determines resistance to rotavirus a
561
of the P[8] genotype. Journal of Infectious Diseases 209: 1227-1230.
562
Jeffery K. J. M., Usuku K., Hall S. E., Matsumoto W., Taylor G. P., Procter J., Bunce M., Ogg G. S.,
563
Welsh K. I., Weber J. N., Lloyd A. L., Nowak M. A., Nagai M., Kodama D., Izumo S., Osame M. and
564
Bangham C. R. M. 1999. HLA alleles determine human T-lymphotropic virus-I (HTLV-I) proviral load
565
and the risk of HTLV-I-associated myelopathy. Proceedings of the National Academy of Sciences of
566
the United States of America 96: 3848-3853.
567
Kaslow R. A., Carrington M., Apple R., Park L., Muñoz A., Saah A. J., Goedert J. J., Winkler C.,
568
O'Brien S. J., Rinaldo C., Detels R., Blattner W., Phair J., Erlich H. and Mann D. L. 1996. Influence
569
of combinations of human major histocompatibility complex genes on the course of HIV-1 infection.
570
Nature Medicine 2: 405-411.
571
Khakoo S. I., Thio C. L., Martin M. P., Brooks C. R., Gao X., Astemborski J., Cheng J., Goedert J.
572
J., Vlahov D., Hilgartner M., Cox S., Little A. -., Alexander G. J., Cramp M. E., O'Brien S. J.,
573
Rosenberg W. M. C., Thomas D. L. and Carrington M. 2004. HLA and NK cell inhibitory receptor
574
genes in resolving hepatitis C virus infection. Science 305: 872-874.
575
Kouyos R. D., Salathé M., Otto S. P. and Bonhoeffer S. 2009. The role of epistasis on the evolution
576
of recombination in host-parasite coevolution. Theoretical population biology 75: 1-13
577
Kulkarni S., Savan R., Qi Y., Gao X., Yuki Y., Bass S. E., Martin M. P., Hunt P., Deeks S. G., Telenti
578
A., Pereyra F., Goldstein D., Wolinsky S., Walker B., Young H. A. and Carrington M. 2011.
579
Differential microRNA regulation of HLA-C expression and its association with HIV control. Nature
580
472: 495-498.
581
Kwiatkowski D. P. 2005. How malaria has affected the human genome and what human genetics
583
can teach us about malaria. American Journal of Human Genetics 77: 171-192.
584
Lederberg J. 1999. J. B. S. Haldane (1949) on infectious disease and evolution. Genetics 153: 1-3.
585
Lenz T. L. 2011. Computational prediction of MHC II-antigen binding supports divergent allele
586
advantage and explains trans-species polymorphism. Evolution 65: 2380-2390.
587
Lindesmith L., Moe C., Marionneau S., Ruvoen N., Jiang X., Lindblad L., Stewart P., Lependu J.
588
and Baric R. 2003. Human susceptibility and resistance to Norwalk virus infection. Nature medicine
589
9: 548-553.
590
Lindo J., Huerta-Sánchez E., Nakagome S., Rasmussen M., Petzelt B., Mitchell J., Cybulski J. S.,
591
Willerslev E., Degiorgio M. and Malhi R. S. 2016. A time transect of exomes from a Native American
592
population before and after European contact. Nature Communications 7:13175
593
Liu R., Paxton W. A., Choe S., Ceradini D., Martin S. R., Horuk R., MacDonald M. E., Stuhlmann H.,
594
Koup R. A. and Landau N. R. 1996. Homozygous defect in HIV-1 coreceptor accounts for
595
resistance of some multiply-exposed individuals to HIV-1 infection. Cell 86: 367-377.
596
Martin M. P., Gao X., Lee J. -., Nelson G. W., Detels R., Goedert J. J., Buchbinder S., Hoots K.,
597
Vlahov D., Trowsdale J., Wilson M., O'Brien S. J. and Carrington M. 2002. Epistatic interaction
598
between KIR3DS1 and HLA-B delays the progression to AIDS. Nature genetics 31: 429-434.
599
McLaren P. J. and Carrington M. 2015. The impact of host genetic variation on infection with HIV-1.
600
Nature immunology 16: 577-583.
601
McLaren P. J., Coulonges C., Bartha I., Lenz T. L., Deutsch A. J., Bashirova A., Buchbinder S.,
602
Carrington M. N., Cossarizza A., Dalmau J., De Luca A., Goedert J. J., Gurdasani D., Haas D. W.,
603
Herbeck J. T., Johnson E. O., Kirk G. D., Lambotte O., Luo M., Mallal S., Van Manen D.,
Martinez-604
Picado J., Meyer L., Miro J. M., Mullins J. I., Obel N., Poli G., Sandhu M. S., Schuitemaker H., Shea
605
P. R., Theodorou I., Walker B. D., Weintrob A. C., Winkler C. A., Wolinsky S. M., Raychaudhuri S.,
606
Goldstein D. B., Telenti A., De Bakker P. I. W., Zagury J. -. and Fellay J. 2015. Polymorphisms of
607
large effect explain the majority of the host genetic contribution to variation of HIV-1 virus load.
608
Proceedings of the National Academy of Sciences of the United States of America 112:
14658-609
14663.
610
Norman P. J., Hollenbach J. A., Nemat-Gorgani N., Guethlein L. A., Hilton H. G., Pando M. J.,
611
Koram K. A., Riley E. M., Abi-Rached L. and Parham P. 2013. Co-evolution of Human Leukocyte
612
Antigen (HLA) Class I Ligands with Killer-Cell Immunoglobulin-Like Receptors (KIR) in a Genetically
613
Diverse Population of Sub-Saharan Africans. PLoS Genetics 9(10):e1003938. doi:
614
10.1371/journal.pgen.1003938.
615
616
Parham P. and Moffett A. 2013. Variable NK cell receptors and their MHC class i ligands in
617
immunity, reproduction and human evolution. Nature Reviews Immunology 13: 133-144.
618
Parham P., Lawlor D. A., Lomen C. E. and Ennis P. D. 1989. Diversity and diversification of
HLA-619
A,B,C alleles. Journal of Immunology 142: 3937-3950.
620
Payne R., Muenchhoff M., Mann J., Roberts H. E., Matthews P., Adland E., Hempenstal A., Huang
621
K.-H.., Brockman M., Brumme Z., Sinclair M., Miura T., Frater J., Essex M., Shapiro R., Walker B.
622
D., Ndung'u T., McLean A. R., Carlson J. M. and Goulder P. J. R. 2014. Impact of HLA-driven HIV
adaptation on virulence in populations of high HIV seroprevalence. Proceedings of the National
624
Academy of Sciences of the United States of America 111: E5393-E5400.
625
Penman B. S., Pybus O. G., Weatherall D. J. and Gupta S. 2009. Epistatic interactions between
626
genetic disorders of hemoglobin can explain why the sickle-cell gene is uncommon in the
627
Mediterranean. Proceedings of the National Academy of Sciences 106: 21242-21246.
628
Penman B. S., Ashby B., Buckee C. O. and Gupta S. 2013. Pathogen selection drives
629
nonoverlapping associations between HLA loci. Proceedings of the National Academy of Sciences
630
of the United States of America 110: 19645-19650.
631
Penman B. S., Gupta S. and Buckee C. O. 2012. The emergence and maintenance of sickle cell
632
hotspots in the Mediterranean. Infection, Genetics and Evolution 12: 1543-1550.
633
Penman B. S., Habib S., Kanchan K. and Gupta S. 2011. Negative epistasis between α+
634
thalassaemia and sickle cell trait can explain interpopulation variation in South Asia. Evolution 65:
635
3625-3632.
636
Penman B. S., Moffett A., Chazara O., Gupta S. and Parham P. 2016. Reproduction, infection and
637
killer-cell immunoglobulin-like receptor haplotype evolution. Immunogenetics 68: 755-764.
638
Prugnolle F., Manica A., Charpentier M., Guégan J. F., Guernier V. and Balloux F. 2005.
Pathogen-639
driven selection and worldwide HLA class I diversity. Current Biology 15: 1022-1027.
640
Sabeti P. C., Walsh E., Schaffner S. F., Varilly P., Fry B., Hutcheson H. B., Cullen M., Mikkelsen T.
641
S., Roy J., Patterson N., Cooper R., Reich D., Altshuler D., O'Brien S. and Lander E. S. 2005. The
642
case for selection at CCR5-Delta32. PLoS biology. 3(11): e378.
643
https://doi.org/10.1371/journal.pbio.0030378
644
Seich al Basatena N., MacNamara A., Vine A. M., Thio C. L., Astemborski J., Usuku K., Osame M.,
645
Kirk G. D., Donfield S. M., Goedert J. J., Bangham C. R. M., Carrington M., Khakoo S. I. and
646
Asquith B. 2011. KIR2DL2 enhances protective and detrimental HLA class I-mediated immunity in
647
chronic viral infection. PLoS Pathogens 7(10): e1002270.
648
https://doi.org/10.1371/journal.ppat.1002270
649
Siniscalco M., Bernini L., Latte B. and Motulsky A. G. 1961. Favism and Thalassæmia in Sardinia
650
and their relationship to malaria. Nature 190: 1179-1180.
651
Takahata N. and Nei M. 1990. Allelic genealogy under overdominant and frequency-dependent
652
selection and polymorphism of major histocompatibility complex loci. Genetics 124: 967-978.
653
The International HIV Controllers Study. 2010. The Major Genetic Determinants of HIV-1 Control
654
Affect HLA Class I Peptide Presentation. Science 330 (6010):1551-1557
655
Thorven M., Grahn A., Hedlund K. -., Johansson H., Wahlfrid C., Larson G. and Svensson L. 2005.
656
A homozygous nonsense mutation (428G→A) in the human secretor (FUT2) gene provides
657
resistance to symptomatic norovirus (GGII) infections. Journal of virology 79: 15351-15355.
658
Thomas R., Apps R., Qi Y., Gao X., Male V., O'Huigin C., O'Connor G., Ge D., Fellay J., Martin J.
659
N., Margolick J., Goedert J. J., Buchbinder S., Kirk G. D., Martin M. P., Telenti A., Deeks S. G.,
660
Walker B. D., Goldstein D., McVicar D. W., Moffett A. and Carrington M. 2009. HLA-C cell surface
661
expression and control of HIV/AIDS correlate with a variant upstream of HLA-C. Nature genetics 41:
662
1290-1294.
Vita R., Overton J. A., Greenbaum J. A., Ponomarenko J., Clark J. D., Cantrell J. R., Wheeler D. K.,
664
Gabbard J. L., Hix D., Sette A. and Peters B. 2015. The immune epitope database (IEDB) 3.0.
665
Nucleic acids research 43: D405-D412.
666
Williams T. N., Mwangi T. W., Wambua S., Peto T. E. A., Weatherall D. J., Gupta S., Recker M.,
667
Penman B. S., Uyoga S., Macharia A., Mwacharo J. K., Snow R. W. and Marsh K. 2005. Negative
668
Epistasis between the malaria-protective effects of alpha+ thalassemia and the sickle cell trait.
669
Nature Genetics 37: 1253-1257.
670
Wroblewski E. E., Norman P. J., Guethlein L. A., Rudicell R. S., Ramirez M. A., Li Y., Hahn B. H.,
671
Pusey A. E. and Parham P. 2015. Signature Patterns of MHC Diversity in Three Gombe
672
Communities of Wild Chimpanzees Reflect Fitness in Reproduction and Immune Defense against
673
SIVcpz. PLoS Biology 13(5): e1002144. https://doi.org/10.1371/journal.pbio.1002144
674
675
676
Figure legends 678
Figure 1: A schematic representation of model assumptions. As noted in the Methods, we
679
allowed there to exist 10 HLA types with different binding properties (represented by the numbers
1-680
10), which could be encoded by genes found at either locus of a 2 locus HLA haplotype. Pathogen
681
species 1 and 2 each possess two antigenic sites (represented here by different colours), at which
682
antigens containing peptide fragments which could be bound by specific HLA molecules can be
683
expressed. 4 different antigens can be expressed at each antigenic site (see table 1 for a
684
description of which antigenic variants are present on which site in which pathogen species).The
685
combination of HLA binding types which can present peptides from a particular pathogen defines its
686
strain, e.g. a possible strain of pathogen 1 is [2,8]. As illustrated in this figure, certain HLA
687
molecules are capable of presenting a peptide from either pathogen 1 or pathogen 2. Note that this
688
figure does not display the entire range of possible host or pathogen genotypes.
689
Figure 2: Changing frequencies of HLA haplotypes over time, under selection from 690
pathogen 2. Panel (A) illustrates the frequencies of different HLA haplotypes over the course of a
691
single simulation, panel (B) illustrates the frequencies of different strains of pathogen 2 during the
692
same simulation, and panel (C) indicates the proportion of the population which is homozygous for
693
any HLA haplotype (homozygosity, H), and the ratio of the observed homozygosity in the simulation
694
(Hobs) to that expected under Hardy Weinberg proportions (Hexp). Each shade of grey in panels (A)
695
and (B) represents a different haplotype or pathogen strain. There are too many HLA haplotypes
696
and pathogen strains to label individually, but 2 host haplotypes have been highlighted in red and
697
blue. Between them, these haplotypes cover all 4 possible variants at antigenic site 1 of pathogen 2.
698
Parameter values as follows: r= 0.01, β2= 0.3, σ2 = 0.02, θ1 = 0 andθ2 = 0.002; other parameters
699
were as detailed in the Methods.
700
701
Figure 3: The adaptation of populations under continuous selection from pathogens 1 and 2. 702
The bar chart on the left hand side of each panel illustrates the proportion of simulated populations