RESEARCH ARTICLE
DOES MIGRATION EXPECTANCY DIFFER IN REMOTE AND SEMI-URBAN VILLAGES IN
VARANASI DISTRICT
*Raj Narayan and Dr. S.K. Singh
1
Doctoral Fellow, International Institute for Population Science, Mumbai, India
2
Department of Mathematical Demography & Statistics, International Institute for Population Sciences
Mumbai-400088, India
ARTICLE INFO ABSTRACT
In spite of research work in last few years, much information still lacks in our knowledge about migration. Expectancy table procedure gives the expectancy of various demographic events such as to determine the probable life time earnings of a person in a given industry or in a given occupation. Expectancy tables of migration gives information on the expected number of moves a person may make during his remaining life time. In the present study, we have tried to find out the pattern of migration expectancy characterized by age. We randomly selected six villages (three from remote and three from semi-urban villages) from 14 villages included in the RDPG. The sample included a total of 1300 households from 6 villages by complete household enumeration. The data of this study has been collected by personal interview method and migration record including questions on the present age, education, marital status, occupation, year of migration, place of migration, reasons of migration, remittances, etc. for each migrated person of the households. Findings reveal that migration expectancy is found to be increasing as the age increases in remote as well in semi-urban villages. However, the migration expectancy for male living in remote villages is higher in each group compared to semi-urban villages. Despite of that migration expectancy increases up to the age-group 45-49 years and then follows a declining pattern in both types of villages but higher in remote villages compared to semi-urban villages.
Copyright © 2014 Raj Narayan and Singh. This is an open access article distributed under the Creative Commons Attribution License, which permits unrestricted use, distribution, and reproduction in any medium, provided the original work is properly cited.
INTRODUCTION
Despite of a lot of research work in the last few decades, adequate and valid information still lack in our knowledge about migration. One of this information in the idea on the moves a person might be expected to make during his life time. Initially, Jaffe (1960) has explained the expectancy table to find out the expectancy of various demographic events. Many studies have been explained about expectancy table such as expectancy of a person being marrying or remaining single (Grabill, 1945), the expectancy of a person being admitted to a mental hospital (Ogburn and Winston, 1928-29), the expectancy table for school going population with dropout rate (Stockwell and Nam, 1963). Long (1970) had measured the volume of geographical mobility within countries in a way that would permit comparisons between countries using the data of Census of United States. Wolfbein (1949) explained the average number of years a person can expect to be part of the work force with the help of working force tables. One important example of an expectancy table is net reproduction rates, which shows the probability of a birth occurring to a
*Corresponding author: Raj Narayan,
Doctoral Fellow, International Institute for Population Science, Mumbai, India
female of a given age and the average number of births to be expected during the life time of a female cohort. Thus, the average number of occurrences of some event to be experienced by a cohort during its life time can be shown by expectancy table. The oldest type of expectancy table is life table. It shows the probability of dying and surviving at a given age as well as the average number of years of life remaining at the beginning of a specific age.
There are two types of events that may be handled in an expectancy table. First, there are event which can occur but once and are non-reversible. Death happens only once in a life time of a person and we can calculate the probability of a person dying. The life table yields expectancies for this kind of event. Secondly, there are events which can occur several times to an individual and therefore may be reversible and recurrent in nature. Migration, morbidity, marriage, and unemployment etc., are such type of events. For example, morbidity may be completely reversible if a person makes a complete recovery and recurrent if illness strikes again. In the recent past, migration had attached the attention of policy makers, planners, social scientists and researchers as having special significances in the context of rural development. Migration expectancy tables give information on the expected numbers of moves a
ISSN: 0975-833X
International Journal of Current Research Vol. 6, Issue, 09, pp.8742-8745, September, 2014
INTERNATIONAL JOURNAL OF CURRENT RESEARCH
Article History: Received 10thJune, 2014 Received in revised form 26thJuly, 2014
Accepted 05thAugust, 2014
Published online 30thSeptember, 2014
Key words:
Migration expentancy, Age,
Number of moves, Varanasi, Remote, Semi-urban.
RESEARCH ARTICLE
DOES MIGRATION EXPECTANCY DIFFER IN REMOTE AND SEMI-URBAN VILLAGES IN
VARANASI DISTRICT
*Raj Narayan and Dr. S.K. Singh
1
Doctoral Fellow, International Institute for Population Science, Mumbai, India
2
Department of Mathematical Demography & Statistics, International Institute for Population Sciences
Mumbai-400088, India
ARTICLE INFO ABSTRACT
In spite of research work in last few years, much information still lacks in our knowledge about migration. Expectancy table procedure gives the expectancy of various demographic events such as to determine the probable life time earnings of a person in a given industry or in a given occupation. Expectancy tables of migration gives information on the expected number of moves a person may make during his remaining life time. In the present study, we have tried to find out the pattern of migration expectancy characterized by age. We randomly selected six villages (three from remote and three from semi-urban villages) from 14 villages included in the RDPG. The sample included a total of 1300 households from 6 villages by complete household enumeration. The data of this study has been collected by personal interview method and migration record including questions on the present age, education, marital status, occupation, year of migration, place of migration, reasons of migration, remittances, etc. for each migrated person of the households. Findings reveal that migration expectancy is found to be increasing as the age increases in remote as well in semi-urban villages. However, the migration expectancy for male living in remote villages is higher in each group compared to semi-urban villages. Despite of that migration expectancy increases up to the age-group 45-49 years and then follows a declining pattern in both types of villages but higher in remote villages compared to semi-urban villages.
Copyright © 2014 Raj Narayan and Singh. This is an open access article distributed under the Creative Commons Attribution License, which permits unrestricted use, distribution, and reproduction in any medium, provided the original work is properly cited.
INTRODUCTION
Despite of a lot of research work in the last few decades, adequate and valid information still lack in our knowledge about migration. One of this information in the idea on the moves a person might be expected to make during his life time. Initially, Jaffe (1960) has explained the expectancy table to find out the expectancy of various demographic events. Many studies have been explained about expectancy table such as expectancy of a person being marrying or remaining single (Grabill, 1945), the expectancy of a person being admitted to a mental hospital (Ogburn and Winston, 1928-29), the expectancy table for school going population with dropout rate (Stockwell and Nam, 1963). Long (1970) had measured the volume of geographical mobility within countries in a way that would permit comparisons between countries using the data of Census of United States. Wolfbein (1949) explained the average number of years a person can expect to be part of the work force with the help of working force tables. One important example of an expectancy table is net reproduction rates, which shows the probability of a birth occurring to a
*Corresponding author: Raj Narayan,
Doctoral Fellow, International Institute for Population Science, Mumbai, India
female of a given age and the average number of births to be expected during the life time of a female cohort. Thus, the average number of occurrences of some event to be experienced by a cohort during its life time can be shown by expectancy table. The oldest type of expectancy table is life table. It shows the probability of dying and surviving at a given age as well as the average number of years of life remaining at the beginning of a specific age.
There are two types of events that may be handled in an expectancy table. First, there are event which can occur but once and are non-reversible. Death happens only once in a life time of a person and we can calculate the probability of a person dying. The life table yields expectancies for this kind of event. Secondly, there are events which can occur several times to an individual and therefore may be reversible and recurrent in nature. Migration, morbidity, marriage, and unemployment etc., are such type of events. For example, morbidity may be completely reversible if a person makes a complete recovery and recurrent if illness strikes again. In the recent past, migration had attached the attention of policy makers, planners, social scientists and researchers as having special significances in the context of rural development. Migration expectancy tables give information on the expected numbers of moves a
ISSN: 0975-833X
International Journal of Current Research Vol. 6, Issue, 09, pp.8742-8745, September, 2014
INTERNATIONAL JOURNAL OF CURRENT RESEARCH
Article History: Received 10thJune, 2014 Received in revised form 26thJuly, 2014
Accepted 05thAugust, 2014
Published online 30thSeptember, 2014
Key words:
Migration expentancy, Age,
person may make during his remaining life time. Wilber (1963) and long (1973) have constructed the migration expectancy tables for the United States of America using the Census data for the year 1958 under the assumption that (1) a maximum of one move per person per time period and (2) non-migration for persons reporting the same address at both the beginning and end of the period involved. Both assumptions include some degree of error since undoubtedly some people move more than once and others have returned to their original place at the time of interview.
Expectancy tables are able to give the answers to the question
1. What is the chance of a person moving during his remaining life time?
2. How many times will be move during his remaining life time?
Expected future mobility behaviour data may be useful in projecting migration trends as well as gaining insights into policy measures that might control population movement. If the population redistribution is assessed in relation to different levels of socio-economic and demographic developments, migration as a tool in the development process will be better achieved.
Objective
The objective of the present study is to find out the pattern of migration expectancy characterized by age in two different types of villages of Varanasi.
Data Source and Methods
The present study has tried to find out the pattern of migration expectancy characterized by age in Varanasi district. This study is based on information collected from selected villages of Varanasi district and focus at the pattern of migration adopting a modified definition of a household, which is often adopted for migration study to be conducted at the place of origin. This study adopted "A household will be defined as a
group of people who usually stay together and share a common kitchen, inclusive of persons usually living outside of the village but claiming to belong to the respective households"
(RDPG survey, 1978). Six villages (three from remote villages and three form semi-urban villages) were selected from 14 villages included in the RDPG. The sample included a total of 1300 households from 6 villages by complete household enumeration. The data of this study has been collected by personal interview method and migration record including questions on the present age, education, marital status, occupation, year of migration, place of migration, reasons of migration, remittances, etc. for each migrated person of the households.
Calculation of Migration Expectancy
The calculation of migration expectancy is a straightforward operation involving a few simple steps. It is performed by
following the same routine as followed in Wilber (1963) to determine the expected number of moves in the remaining life time of a person. For completeness, the procedure of migration expectancy is given below:
1. The age specific distribution of sample population is presented in column 1. Since migration is a rare event and it is difficult to obtain one year migration rate for small area, data has been taken in five year age intervals. Column 2 gives the number of migrants during last ten years, which is annualized by dividing it by 10. Column 3 gives the total number of male population in the respective age-interval. The migration rate in column 4 has been achieved by dividing the number of migrants by corresponding population by each age group.
2. Life tables are generally made for a larger geographical area like state or country as a whole and therefore the reliable life tables for smaller units like district are not available. Since the computation require the knowledge of the life table for some larger unit such as that of the state (Uttar Pradesh in this case) or the appropriate model life table, consistent with the mortality condition of the area.
Here the researcher has taken Coale and Demeny’s (1966) ‘Model Life Table’ to represent the mortality condition of
the area.
The choice of the model life table is based on the rate of increase, the birth and death rates of the area and model stable
population. It has been seen that the level 16 of the ‘South Model’ is most appropriate and hence it is taken as the appropriate life table for the area.
3. In a specified age period, the expected number of moves may be obtained by multiplying the migration rate in column four by the stationary population in column six for the appropriate age-interval. These values are given in column seven.
4. The expected number of moves in the given age group and the all older ages in column eight are directly comparable to the Tx column of an ordinary life table. By
accumulating figure in column eight, from highest to the lowest ages, we may the total expected moves by the cohort.
5. To determine the expected number of moves per person in a specified age-group and for all later ages, the cumulative moves in column 8 are divided by survivors given in column 5. Migration expectancy is same to the life expectancy as far as computation and interpretation are concerned.
Computation of migration expectancy may be symbolized as
where,
x
M
x n : denotes the average number of moves during theremaining lifetime of a person at age x or the moves between age x and x+n years.
L x n
x x x n
x x n
L x x
P
L
M
l
x
P
: denotes the migration rate for population age x.x
L
x n : denote the stationary population between age x to x+nyears.
x
l
: denotes the number of survivors at age x.L x n
L x
: denotes the summation of the product of Pxand xLx+nfrom age x to x+n years.
It is well known that in India rural to urban migration is mainly male dominated. Male migration, mainly motivated by better job opportunities at destinations, is to improve and maintain the economic condition. Better education and health facilities at urban areas may be another important pull factors to motivate rural to urban migration.
RESULTS AND DISCUSSION
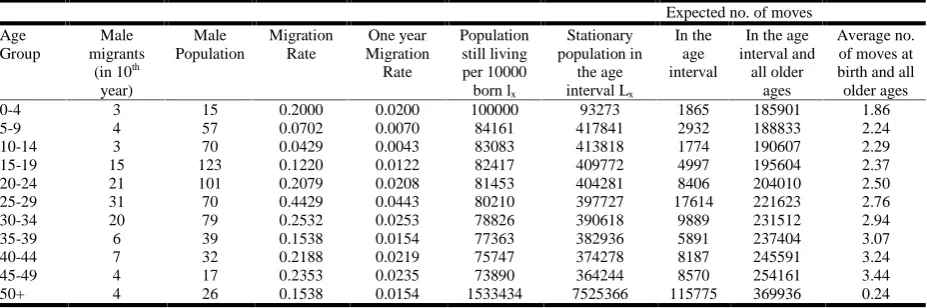
The average number of moves at birth and at older ages for male living in remote and semi-urban villages is given in Table 1 and Table 2. Results reveal that the migration expectancy was found to be increasing as age increased in the remote as well as in semi-urban villages. However, the migration expectancy for male living in remote villages was found to be higher in each age group compared to semi-urban villages.
This may be due to fact that the lack of adequate demand for jobs and others facilities in remote villages may be one of the responsible factors for the higher average number of moves for the male living in such type of villages. In contrast, the smaller number of expected moves by male people living in semi-urban villages may be due to the fact that these villages are situated near Varanasi city, which provides ample job opportunities for local unskilled daily wage earners in the non-agricultural activities, also the males engaged in agriculture may be less mobile as they generally grow cash crops for which they get lucrative prices. The daily migration from semi-urban village may also be one of the causes of less number of expected moves.
[image:4.595.57.532.426.579.2]It is also observed that, migration expectancy increases up to the age-group 45-49 years and then follows a declining pattern in both types of villages but higher in remote villages compared to semi-urban villages. It may be due to the fact that belonging to this age group people of the households of lack of employment opportunities within the village areas. The similar findings by Singh et al. (1980) have pointed out that upper strata of the rural society are more mobile. A major advantage of expectancy table is to get summary values for an entire population. If the complete residential records are available, one may develop a more powerful statement of migration probability. Migration is a recurrent event and future migration is dependent on previous migration experiences. Long (1973) has explained that migration expectancy is based on mobility rates for broad age groups, which are not suitable for showing
Table 1. Migration expectancy for male in remote villages, Varanasi, 2012
Expected no. of moves Age
Group
Male migrants (in 10thyear)
Male Population
Migration Rate
One year Migration Rate
Population still living per 10000 born lx
Stationary population in
the age interval Lx
In the age interval
In the age interval and all
older ages
Average no. of moves at birth and all older ages 0-4 4 10 0.4000 0.0400 100000 93273 3731 322449 3.22 5-9 8 30 0.2667 0.0267 84161 417841 11142 333591 3.96 10-14 18 65 0.2769 0.0277 83083 413818 11460 345051 4.15 15-19 39 139 0.2806 0.0281 82417 409772 11497 356548 4.33 20-24 29 80 0.3625 0.0363 81453 404281 14655 371203 4.56 25-29 39 90 0.4333 0.0433 80210 397727 17235 388438 4.84 30-34 42 83 0.5060 0.0506 78826 390618 19766 408204 5.18 35-39 33 72 0.4583 0.0458 77363 382936 17551 425755 5.50 40-44 18 43 0.4186 0.0419 75747 374278 15667 441423 5.83 45-49 18 35 0.5143 0.0514 73890 364244 18733 460155 6.23 50+ 7 24 0.2917 0.0292 1261559 6206098 181011 641167 0.51
Table 2. Migration expectancy for male in semi-urban villages, Varanasi, 2012
Expected no. of moves Age
Group
Male migrants
(in 10th year)
Male Population
Migration Rate
One year Migration Rate
Population still living per 10000 born lx
Stationary population in
the age interval Lx
In the age interval
In the age interval and
all older ages
[image:4.595.65.529.610.764.2]the proportions of life time mobility experienced up to or between specific points in life. The migration expectancy by single year of age is more suitable for showing the proportion of life time mobility experience to an individual. In this case, the data for number of migrants was less. Therefore, the migration expectancy was calculated for broad age groups.
Conclusion
Migration expectancy is found to be increasing as the age increases in remote as well as from semi-urban villages. However, the migration expectancy for male living in remote villages is higher in each age-group compared to semi-urban villages. The lack of adequate jobs opportunities and others facilities in remote villages may be one of the responsible factors for the higher average number of moves for the male from these villages. In contrast, the smaller number of expected moves by male living in semi-urban villages may be due to the fact that these villages are situated near Varanasi city, which provides ample job opportunities for local unskilled low wage earners in the non-agricultural sector. Also the males engaged in agriculture may be less mobile as they generally grow cash crops for which they get lucrative prices. The daily migration from semi-urban villages may also be one of the causes of less number of expected moves. It is also observed that migration expectancy is higher as age increases up to the age group 45-49 and then follows a declining pattern. However, computing the same based on data collected through RDPG, 1978 resulted the peak in the age group 30-35 years. This shift may be resulted due to increasing instability in employment opportunities in the region despite of various welfare schemes and flagship programmes.
Thus, the existing migration pattern and propensity to move at different age can be attributed to unavailability of sufficient job opportunities. In addition, The Mahatma Gandhi National Rural Employment Guarantee Act (MNREGA) is the flagship welfare programme of the UPA government. One of its main objectives is that to reduce the labour migration through provision of locally available work opportunities in rural areas. But, the MNREGA programme may not be working adequately in the study area. Therefore it can be said that migration expectancy is higher up to age 49 years. In addition to this, Ghose (2011) has found that migration has been the result of lack of employment opportunities within the village. The number of family members (per beneficiary household) who migrated due to non-availability of work in the village under MNREGA.
REFERENCES
Coale, A. J. and Demeny, P. 1966. "Regional Model Life Tables and Stable Population," Princeton University Press, Princeton, New Jersey.
Ghosh, J.B. 2011. “Impact of NREGA on wage rate, food security and rural urban migration in west Bengal”, Agro -economic Research Centre, Visva-Bharati Santiniketan. Grabill, W. H. 1945. "Attrition Life Tables for the Single
Population," Journal of the American Statistical association, Vol. (40), pp: 364-75.
Jaffe, A. J. 1960. "Handbook of Statistical Methods for Demographers," (Preliminary Edition-Third Printing) Washington, D. C.: U. S. Government Printing Office. Long, Larry, H. 1970. "On Measuring Geographical Mobility,"
Journal of the American Statistical Association, Vol. (65),
pp: 1195-1203.
Long, Larry, H. 1973. “New Estimates of Migration
Expectancy in the United States," Journal of the American
Statistical association, Vol. (68), pp: 37-43.
Mahatma Gandhi National Rural Employment Guarantee Act (MNREGA), welfare programme of the government. Ogburn, W. F. and Winston, E. 1928-29. "The Frequency and
Probability of Insanity," American Journal of Sociology, Vol. (34), pp: 822-7.
Rural Development and Population Growth Survey; 1978. Conducted under the auspices of Center of Population Studies, Banaras Hindu University, Varanasi, sponsored by the University Grants Commission, New Delhi.
Singh, S.N.,and Vadava, R.C., Sharma, L. and Sharma, H.L. 1980.“Out-migration from Varanasi (Rural); Some results
on Differentials”,Demography India Vol. 9 (1&2), pp:
28-34
Stockwell, E. G. and Nem Charles, B. 1963. "Illustrative Tables of School Life," Journal of the American Statistical
Association, Vol. (58), pp: 1113-1124.
Wilber, G. L. 1963. "Migration Expectancy in the United States," Journal of American Statistical Association. Vol. (58), pp: 444-453.
Wolfbein, S. L. 1949. "The Length of Working Life." Population Studies, Vol. (3), pp: 286-294.