Evolutionary Optimization Methods for Animal Leather
Image Segmentation
Murinto
Departement of
Informatics Engineering
Universitas Ahmad Dahlan
Yogyakarta
Sri Winiarti
Departement of
Informatics Engineering
Universitas Ahmad Dahlan
Yogyakarta
Adhi Prahara
Departement of
Informatics Engineering
Universitas Ahmad Dahlan
Yogyakarta
Eko Febri N. W.
Departement of
Informatics Engineering
Universitas Ahmad Dahlan
Yogyakarta
ABSTRACT
One of the processes undertaken to determine the quality of animal skin for leather craft in the form of digital images is the process of image segmentation. A disability detection process is required to ensure that animal skins used for craft are right-near as expected. In this research, the evolutionary method is used to process Darwinian segmentation of particle swarm optimization (DPSO) methods used for animal image segmentation process. The results were then compared with the Harmonic Search Algorithm (HSA) method. The process of image segmentation is important, if segmentation is done correctly then the next process will run correctly too. One of the problems usually faced is how to choose a good image segmentation method. Experiments had been done on four categories of animal leather images namely lizard leather, sheep leather, cow leather and goat leather. PSNR values were used to measure the quality of the segmentation method used. From the experimental results it is seen that there is little difference between the DPSO and HSA methods used in this study. It can be concluded, however, that the DPSO method is slightly better than the HSA in certain animal cases. PSNR value is higher when compared to using HSA methods on the same image.
Keywords
Image segmentation, images leather, harmonic search algorithm, Darwinian particle swarm optimizations
1.
INTRODUCTION
Animal leather handicraft is one of the most rapidly growing industries in Indonesia. The development of variations in the types and designs of quirk crafts in the region, apparently not balanced with the knowledge of the leather industry players. Leather industry craftsmen still have constraints in determining the handicap of materials used in handicraft making. The obstacle is a classification of skin type of processed scientifically found at the time of tannery. The type and quality of leather that will be used as leather craft is known only based on tradition from generation to generation. Understanding the quality and specific skin damage to craft products is very minimal. This results in a lack of matching skin types used for certain crafts. In the end the players of the leather craft industry itself that lost because of the resulting handicraft products to be not good, due to damage to skin types that are used. The first step in overcoming this problem is to identify the damage to the surface of animal skin used as a craft material. This is based on the fact that at the time of tanning until the tanning process of animal skin is not free from any damage. In the process of identification of animal skin image damage one of the process done is to perform
image segmentation process before the classification of the type of defect.
Image segmentation is a process of dividing a digital image into several regions or objects corresponding to the label similarity of each pixel. Image segmentation in recent years has been widely applied in various fields including: Engineering, medicine, craft industry, agriculture and so forth. The image segmentation method can be classified into four types: the method is based on histogram-thresholding, mtode is based on texture, the method is based on clustering and the method is based on split-region merging [1].
There are two main methods in threshoding commonly used in image processing i.e. the method proposed by Otsu’s [2] and the method proposed by Kapur’s [3]. The Otsu thresholding method maximizes variance among classes, while the Lime method uses the maximization of entropy to measure homogeneity among classes. The bi-level thresholding problem can be extended into multi-level thresholding, but the calculation of multilevel thresholding calculation complexity will increase exponentially as new threshold is entered. These problems can be solved by using the evolutionary optimization method.
A study by Hammouche et al [4] presented an important survey of how different evolutionary methods were used to solve the problems of Otsu and Kapur. One of the methods included in the evolutionary method is the Genetic Algorithm (GA) [5]. An evolutionary method inspired by swarm behavior, such as particle swarm optimization (PSO) [6] has been introduced for image segmentation problems. PSO is a population based on statistical optimization techniques introduced by Ebertian and Kennedy (1995). The advantages of PSO are easier and faster than GA [7]. A common problem with PSO and other opimization algorithms is that they are trapped in a local optimum point, so the algorithm is likely to work well and also fail in the same way. Tillet et al. [8] proposed a renewal of the PSO Darwinian Particle Swarm Optimization (DPSO) to overcome this. Another evolutionary method of harmonic search algorithm (HSA) introduced by Geem et al [9] is an evolutionary optimization algorithm based on the metaphor of the process of improvisation that arises when a musician seeks a better state harmony.
2.
LITERATUR REVIEW
2.1 Harmony Search Algorithm (HSA)
SA algorithm was first introduced by Geem et al (2009) is an evolutionary algorithm that is based on the metaphor of the process of improvises on musicians in searching for a better state of harmony. The HSA algorithm generates a solution candidate from all possible solutions. Each harmony (solution candidate) uses H different elements as a decision variable that represents a number of different threshold points used for segmentation. Population is represented as:
𝑃 = 𝑥1𝑐, 𝑥2𝑐, … , 𝑥𝑁𝑐 𝑇 (1) 𝑥𝑖𝑐 = 𝑡1𝑐, 𝑡2𝑐, … , 𝑡𝑁𝑐 (2)
Where T is transpose operator. N is size of harmony memory.
𝑥𝑖 is element to i of P. 𝑐 = 1,2,3 is RGB image, when 𝑐 = 1 is
gray level image. Bounded of space search is lower 𝑙 = 0 and upper 𝑢 = 255, correspondents to intensity level image. HSA algorithm implementation in this research is performing on Otsu’s object function. The HSA Otsu algorithm on multilevel threshold for image segmentation is as follows:
Algorithm HSA Otsu’s [10] Step1. Input image I
Step2. Compute and perform image I Step3. Compute probability distribution using
𝑃𝑖𝑐= 𝑖𝑐
𝑁𝑝, 𝑃𝑖 𝑐 𝑁𝑝
𝑖=1 , c=1,2,3 RGB image, c=1 Gray
level image
Where is i specific intensity level, Np is number of total pixel in image I, 𝑖𝑐 is histogram image that is number of
pixels correspondent to level intensity i in c.
4. Initialization HSA parameter that is harmony memory (HM), Harmony consideration rate (HMCR), Pitch adjusting rate (PAR), distance bandwidth (BN), Number of improvisations (NI).
5. Initialization HM 𝑥𝑖𝑐 of particles random HSA with M
dimension.
6. Compute values 𝜔1𝑐 and𝜇1𝑐.
Evaluation of elements HM in Otsu’s objective function
𝐽 𝑇𝐻 = max(𝜎2𝑐
𝑇𝐻), 0 ≤ 𝑡𝑖≤ 𝐿 − 1, 𝑖 = 1,2,3, …
Where is 𝑇𝐻 = 𝑡1, 𝑡2, … , 𝑡𝑘−1 vector contains multiple
threshold and variance calculates use as follow:
𝜎2𝑐
= 𝜎𝑖𝑐= 𝜔
1𝑐(𝜇1𝑐− 𝜇𝑐𝑇)2 𝑘
𝑖=1 𝑘
𝑖=1 (3)
7. Improvisation a new harmony 𝑥𝑛𝑒𝑤𝑐
8. Update HM as 𝑥𝑤𝑜𝑟𝑠𝑡𝑐 = 𝑥𝑛𝑒𝑤𝑐 if 𝑓(𝑥𝑛𝑒𝑤 )>𝑓(𝑥𝑤𝑜𝑟𝑠𝑡𝑐 )
𝑐
9. If NI complete or criteria to stop satisfied, then go to step 10. Else go back to step 6.
10. Choice the harmony has the best 𝑥𝑏𝑒𝑠𝑡𝑐 objective function
value.
11. Apply threshold values in 𝑥𝑏𝑒𝑠𝑡𝑐 for image I (multilevel
threshold)
2.2 Darwinian Particle Swarm Optimization
Particle swarm optimization (PSO) is a member of an effective stochastic optimization algorithm. This technique proposed by Eberhart dan Kennedy (1995) depends on common behavior from birds flocking and swarm theory. PSO is fully useful on any solution optimization problem in image segmentation and the result more accurate. Goal of PSO is find to global optimal solution in a space search complex. PSO has advantage more easy and fast computation than genetic algorithm (GA) [7] PSO algorithm is contain two main equation can be written as:
𝑣𝑖+1𝑛 = 𝑚𝑣
𝑖𝑛+ 𝑐1𝑟1 𝑔 𝑖𝑛− 𝑥𝑖𝑛 + 𝑐2𝑟2 𝑥 𝑖𝑛− 𝑥𝑖𝑛 +
𝑐3𝑟3 𝑛 𝑖𝑛− 𝑥𝑖𝑛 (4)
𝑥𝑖+1𝑛 = 𝑥
𝑖𝑛+ 𝑣𝑖+1𝑛 (5)
Where is 𝑣𝑖𝑛 velocity, 𝑥𝑖𝑛 is particle position in search space. 𝑟1, 𝑟2, 𝑟3 are number random with value (0,1). 𝑔 𝑖𝑛 is global best
that is the best value for all particles. Local best is best function for this particle and Neighborhood best is the best function for neighborhood particle represented by 𝑥𝑖𝑛 dan 𝑛
𝑖 𝑛
and the constant 𝑚, 𝑐1, 𝑐2, 𝑐3.
The PSO algorithm encountered problems trapped in a local optima (Tillet and Rao, 2005) which Darwinian Particle Swarm Optimization (DPSO) proposed to address the PSO problem. DPSO more efficient performance and also its processing time is better when compared with PSO. DPSO is extended to Fractional Order Darwinian Particle Swarm Optimization (FODPSO) when 𝛼 = 1. Generally FODPSO can be written as [10] :
𝑣𝑖+1𝑛 = 𝛼𝑣𝑖𝑛+ 1 2𝛼𝑣𝑖−1
𝑛 +1
6𝛼 1 − 𝛼 𝑣𝑖−2 𝑛 + 1
24𝛼 1 − 𝛼 2 − 𝛼 𝑣𝑖−3𝑛 + 𝑐2𝑟2 𝑥 𝑖𝑛− 𝑥𝑖𝑛 + 𝑐3𝑟3 𝑛 𝑖𝑛− 𝑥𝑖𝑛 (6)
2.3 Peak Signal to Noise Ratio (PSNR)
Peak Signal-to-Noise Ratio (PSNR) used to measure image quality. The small PSNR value of the image means that the image has a low quality. PSNR is evaluated in decibels. PSNR is defined as equation [11].
PSNR = 10log10(2
n−)2
MSE (7)
Mean Squared Error (MSE) is defined as the following equation (8).
MSE = 1
MN (x i, j − y i, j ) 2 N
j=1 M
i=1 (8)
Where x (i, j) represents the original image (reference) and y (i, j) represents the distorted image and i and j represents the pixel position of the image M x N. The MSE will be zero when x (i, j) = Y (i, j).
3. RESEARCH METHODS
3.1 Image Dataset and
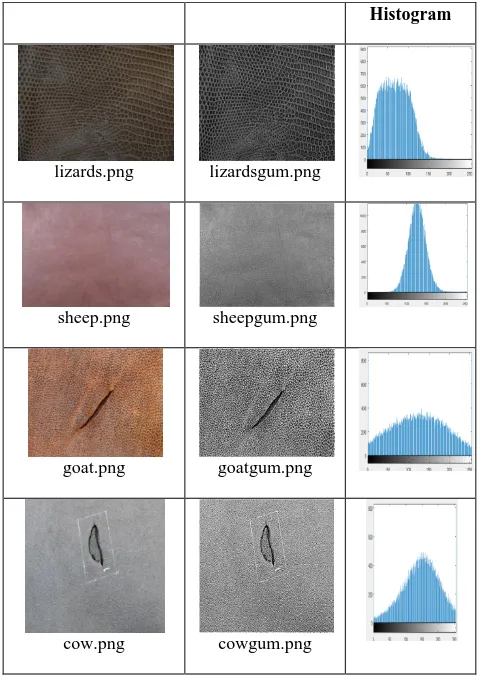
In the study used 4 different types of animal skin images. The four skin types are taken from the image of a defective animal skin. It has the purpose that the research process undertaken here is as the beginning of the introduction process of animal kulilt damage. In this research we use four types of animal skin images are lizards, sheep, goat and cow leather. Image has size 512 x 512 pixels. The original image is formatted RGB (*.png) and converted into grayscale image for easy processing. Table 1 shows the original image RGB, the resulting image conversion to the gray level scale and the histogram of the gray level image of the four animal leathers.
Table 1. Leather image and it’s histogram 4 image dataset
Histogram
lizards.png lizardsgum.png
sheep.png sheepgum.png
goat.png goatgum.png
cow.png cowgum.png
3.2 Proposed Method
In this research we proposed evolutionary methods leather image segmentation. Two evolutionary methods that are harmony search algorithm (HSA) and Darwinian particle swarm optimization (DPSO) used to image segmentation in this research. The flow diagram research is show in Fig.1.
3.3 Performance Image Segmentation
In this research two evolutionary methods used to leather image segmentation. The two methods are Harmony search Algorithm (HSA) and Darwinian particle swarm optimization (DPSO). Image segmentation result are shown in Fig. 3.While the image quality measurement used PSNR. In this research, image quality segmentation measurement is done through
peak-signal-to-noise (PSNR), as written in (7).
start
Input leather image
Convert RGB to Gray level
Image enhancement using unsharp masking
methods
Image segmentation using HSA and DPSO
Evalute image quality using PSNR
[image:3.595.47.288.71.413.2]end
Fig.1 Flow Diagram image segmentation using evolutionary methods
4. RESULTS AND DISCUSSION
In this research several digital images were used for the testing of the proposed method. We select four types of leather image are lizard leather (lizard.png), sheep leather (sheep.png), cow leather (cow.png) and goat leather (goat.png) as show in Table 1. Histogram of leather image can be seen in Table 1.
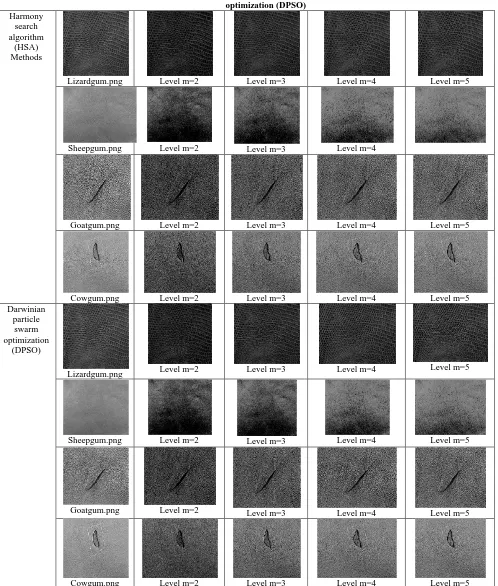
[image:3.595.366.481.93.342.2]Leather image segmentation is process using harmony search algorithm (HSA) and Darwinian particle swarm optimization (DPSO) for two, three, four and five level threshold. In the Table 2 we can see result of image segmentation for 4 leather images.
optimization (DPSO) Harmony
search algorithm
(HSA) Methods
Lizardgum.png Level m=2 Level m=3 Level m=4 Level m=5
Sheepgum.png Level m=2 Level m=3 Level m=4
Goatgum.png Level m=2 Level m=3 Level m=4 Level m=5
Cowgum.png Level m=2 Level m=3 Level m=4 Level m=5
Darwinian particle
swarm optimization
(DPSO)
Lizardgum.png Level m=2 Level m=3 Level m=4 Level m=5
Sheepgum.png Level m=2 Level m=3 Level m=4 Level m=5
Goatgum.png Level m=2 Level m=3 Level m=4 Level m=5
Cowgum.png Level m=2 Level m=3 Level m=4 Level m=5
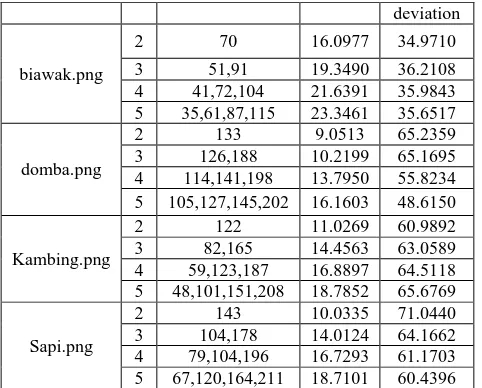
In Table 3 and Table 4 we presented experiment result of implementation evolutionary methods Darwinian particle swarm optimization and harmony search algorithm, respectively. Two parameters are compute that the peaks signal to noise ratio (PSNR) and standard deviation. From Table 3 and Table 4 we can see that the threshold values for
[image:4.595.52.550.72.658.2]levels 2, 3, 4 and 5 are slightly different. The difference is at level 5 for the leather image of sheep. In the image segmentation use DPSO the threshold at level 5 are 105,127,145,202, while in the HSA the threshold are 106,128,150,202.
Table 3 Experiment results of implementation Darwinian Particle Swarm Optimization (DPSO) algorithm in leather
animal image
deviation
biawak.png
2 70 16.0977 34.9710
3 51,91 19.3490 36.2108
4 41,72,104 21.6391 35.9843 5 35,61,87,115 23.3461 35.6517
domba.png
2 133 9.0513 65.2359
3 126,188 10.2199 65.1695 4 114,141,198 13.7950 55.8234 5 105,127,145,202 16.1603 48.6150
Kambing.png
2 122 11.0269 60.9892
3 82,165 14.4563 63.0589 4 59,123,187 16.8897 64.5118 5 48,101,151,208 18.7852 65.6769
Sapi.png
2 143 10.0335 71.0440
[image:5.595.48.289.71.265.2]3 104,178 14.0124 64.1662 4 79,104,196 16.7293 61.1703 5 67,120,164,211 18.7101 60.4396
Table 3 Experiment results of implementation Harmony search algorithm (HSA) in leather animal Image
Image m Threshold PSNR Standard deviation
biawak.png
2 70 16.0977 34.2359
3 51,91 19.3490 36.1695
4 41,72,104 21.6391 35.9848 5 35,61,87,115 23.3461 35.5927
domba.png 2 133 9.0351 65.2359
3 127,189 10.2199 65.1695 4 114,141,198 13.5355 56.9849 5 106,128,150,202 16.1577 48.5840 Kambing.png 2 122 11.0269 60.9892 3 82,165 14.4597 63.0589 4 60,124,188 16.8897 64.5118 5 48,101,151,204 18.7852 65.6760
Sapi.png 2 143 10.0335 71.0440
3 104,178 14.0124 64.1662 4 80,141,197 16.7293 61.1703 5 67,120,164,211 18.7008 60.4396
From the Table 3 and Table 4 we can see that image quality for 4 images is different. PSNR values when use DPSO slightly better on a particular image than HSA. In Sapi.png processing use DPSO at level 5, value of PSNR is 18.7101, goat.png image level 3 is 14.4563. The values PSNR better than when we use harmony search algorithm (HSA).
5. CONCLUSION
From the experimental results it is seen that there is little difference between the DPSO and HSA methods used in this study. It can be concluded, however, that the DPSO method is slightly better than the HSA in certain animal cases. PSNR value is higher when compared to using HSA methods on the same image.
6. ACKNOWLEDGMENTS
Thanks to Institute for Research and Development (LPP) of
Universitas Ahmad Dahlan Yogyakarta who has funded this research with Internal competitive research (PP) Scheme as outlined in the research contract number: PP-001 / SP3 / LPP-UAD / IV / 2017.
7. REFERENCES
[1] Ghamisi, P., Couceiro, M. S., Benediktsson, J. A., & Ferreira, N. M. 2012. An efficient method for segmentation of images based on fractional calculus and natural selection. Expert Systems with Applications, 39(16), 12407-12417.
[2] Otsu, N. 1979. A threshold selection method from gray-level histograms. IEEE transactions on systems, man, and cybernetics, 9(1), 62-66
[3] Kapur, J. N., Sahoo, P. K., & Wong, A. K. 1985. A new method for gray-level picture thresholding using the entropy of the histogram. Computer vision, graphics, and image processing, 29(3), 273-285.
[4] Hammouche, K., Diaf, M., & Siarry, P. 2010. A comparative study of various meta-heuristic techniques applied to the multilevel thresholding problem. Engineering Applications of Artificial Intelligence, 23(5), 676-688.
[5] Tao, W. B., Tian, J. W., & Liu, J. 2003. Image segmentation by three-level thresholding based on maximum fuzzy entropy and genetic algorithm. Pattern Recognition Letters, 24(16), 3069-3078.
[6] Eberhart, R., & Kennedy, J. 1995, October. A new optimizer using particle swarm theory. In Micro Machine and Human Science, 1995. MHS'95., Proceedings of the Sixth International Symposium on (pp. 39-43). IEEE.. [7] Lee, K. S., & Geem, Z. W. 2005. A new meta-heuristic
algorithm for continuous engineering optimization: harmony search theory and practice. Computer methods in applied mechanics and engineering, 194(36), 3902-3933.
[8] Geem, Z. W., Kim, J. H., and Loganathan, G. V. 2001. A new heuristic optimization algorithm: harmony search. simulation, 76(2), 60-68.
[9] Tillett, J., Yang, S., Rao, R., & Sahin, F. 2005. Application of particle swarm techniques in sensor network configuration.
[10] Oliva, D., Cuevas, E., Pajares, G., Zaldivar, D., and Perez-Cisneros, M. 2013. Multilevel thresholding segmentation based on harmony search optimization. Journal of Applied Mathematics, 2013.