Applying different Feature Selection and Classification
Parameters for Categorization
Syed Basit Ali
Taiyuan University of Technology Taiyuan, China
Yan Qiang
Taiyuan University of Technology Taiyuan, China
Saad Abdul Rauf
Taiyuan University of Technology Taiyuan, China
Farhan Zaka
International Islamic University Islamabad, Pakistan
ABSTRACT
In today’s data-intensive world, millions of data is generated, processed and transferred, The main factors for the generation of data is an increase in the usage of social media and so is the increase in data mining methodologies. Text Classification is one of the most important aspects of data mining which includes fetching of data, pre-processing it and then applying classifiers to divide the data into the categories so as it would be easy to process and subject to further experimentation. In this paper, data is subjected through certain feature selection techniques enhancing its parameters and then applied multiple Machine Learning classifiers on it so as to study various parameters of the data which include accuracy, precision and various averages. The impact of increasing or decreasing the categories for classification of text on accuracy through various classifiers is studied which include Naive Bayes, Support Vector Machine and K-Nearest Neighbour and also the combination of individual classifiers in an ensemble classifier. In this research the internal parameters of Feature Selection Techniques and classifiers are also changed which lead to a slightest increase in overall accuracy of the classifier. Reducing different categories also increases accuracy to a greater extent because it also reduces the presence of multiple similar categories which lead to decrease in overall accuracy. Certain changes in the feature selection parameters are also included which is trying algorithms on uni-gram, bi-gram and tri-gram models and out of which bi-gram shows the best overall accuracy result with Support Vector Machine classifier.
Keywords
Text Classification,Machine Learning, Naive Bayes, Support Vector Machine , K-Nearest Neighbors, Ensemble, Soft-voting’
1.
INTRODUCTION
Text classification is the technique which classifies any given text be it word based, sentence based or document based into the category from the given set of categories. Multiple techniques have been utilized to perform this operation . Three major techniques are used to perform classification which include lexicon based methods, linguistic methods[1] and machine learning approaches.Machine Learning has been widely used among all as it performs the given operations with greater ease and there are numerous algorithms which work on the given set of training and testing data.Some of the most prominent methods to classify text include Naive Bayes [2] , Support Vector Machines [3], k-nearest neighbour classifier [4] and also deep learning methods such as Convolutional Neural Networks (CNN)[5] and Recurrent Neural Networks(RNN)[6] and not only this many ensemble [7] based techniques as well . Text classification is widely used for sentiment analysis[7].
Multinomial Naive Bayes[2] , SVM[3] , KNN[4] and ensemble classifier[11] are implemented on the given data. The data-set includes news and research articles on the basis of categories from 20news.com data-set. Of all the available classifiers result of SVM on these data-sets is better . This could be due to may reasons, if the example of Naive Bayes Algorithm is considered, it is a probabilistic algorithm which assumes that individual classes are conditionally independent , so there has been an in-accuracy in the result when the given data contain some what similar classes. For eg- the category sports and recreation are somewhat similar but medical and sports categories are totally different and independent from each other. Pre-processing is an important step as the given data contains lot of useless words which come under the category of stop-words which have to be removed in order to increase the accuracy. Apart from that feature selection is another vital task that needs to be accomplished before data is subjected to training and testing. Total 12000 news articles based on 20 different categories and results are considered which are in the form of accuracy, recall, macro and micro averages . There has also been a significant increase in accuracy if the categories for the classification of data are decreased as there is now a less similarities between the categories. In the subsequent sections Section 2 contains Literature Review which includes the previous works that have been done on this, Section 3 contains the detailed description of data and the procedure and classifiers , Section 4 contains the set-up explanation for the implementation, Section 5 contains results while conclusions and direction of future research are explained in the 6th Section.’
2.
LITERATURE REVIEW
46 in terms of their Wikipedia based meanings in order to
represent documents semantically.Further more Bobacar and Niu[21] made an attempt in order to improve the text clustering performance by enriching document representation by concept level Wikipedia pages. Wang et al [24] proposed expansion vector space model with semantic relations such as synonymy and hyponym and associative relations derived from Wikipedia. Nim Jong[8] combined vector tensor space model with Naive Bayes to improve the accuracy and also tested Wikipedia based data on multiple classifiers such as NB and SVM as well as on deep neural networks such as DNN and RNN.
3.
METHODOLOGY
3.1
Data
11314 news articles from 20news.com were picked and data was divided into 20 different categories which vary from medical science to space exploration and from religion to automobile and sports and have made two subsets each for training and testing.
3.2
Procedure
3.2.1 Pre-processing and Feature Selection
Pre-Processing refers to the cleaning of data before subjecting to to actual classification . It includes several methods which start from tokenization then stemming and lemmatization, stopwords removal and Parts of speech tagging and then rejoining while feature selection if the process of converting words into feature vectors. All of these steps are called transformations while last step which is applied to some functions to achieve the required patterns is called filtering[9].3.2.2 TF-IDF(Term Frequency-Inverse Document
Frequency)
TF-IDF = TF * Log(N/DF)
Term frequency means how frequently a given term comes in a given document while N refers to the total number of documents present in our corpus and DF refers to the number of documents containing that particular feature[10] , so this is used to reduce the weight-age of stop-words such as the a an and which do not offer any advantage towards classification.
3.2.3 Classification
After the term frequency evaluation of data, it is to be subjected to algorithms, we used NB, SVM , KNN and ensemble classifier on it and result of each classifier was different. The data was also subjected to multiple parameter changes which are explained in later section. The categories were changed into which data is to be classified so as to study the impact of increasing or decreasing the categories as there are twenty categories in total but if the categories are changed, it has impact on the over all accuracy of the document results of which are also explained in later section.
3.3
Classifiers
3.3.1 Naive Bayes
This is a probabilistic classifier which makes the use of Bayes Theorem in which 2 entities A and B are supposed to be independent of each other. Mathematical formulation of Naive Bayes is
P(A/B) = P(B/A)*P(A)/P(B)
Where P(A/B) is referred as posterior probability , P(B/A) is called Likely hood while P(A) and P(B) are called class and
predictor prior probability.It is easy and fast and also predicts Multi - class functions. When independence assumption holds, it performs better compared to other classifiers such as Linear regression etc.
3.3.2 Support Vector Machine
It is a supervised machine learning algorithm which is used for the purpose of data analysis and regression. SVM constructs a hyper plane which can be used for classification and regression purposes and it is based on non probabilistic theory. A good separation is achieved by the hyper plane that has the largest distance to the nearest data training point of any class. They are highly useful for text categorization , image classification and handwritten character recognition as they show higher accuracy when too many categories are present. One of the most important parameter of SVM is C value which by default is equal to 1. When C value is changed from 1 to 2**5 and combined with bi-gram it leads to little bit increase in over all accuracy because it increases the range and also when C is set between 2**-5 it decreases the accuracy of SVM. More is the distance between the elements of any individual class , more is the accuracy.
3.3.3 K-Nearest Neighbour
In pattern recognition KNN is a non parametric method used for classification and regression.In both the cases the input consists of k closet training examples in feature space while the output in case of classification is class membership and in case of regression , it is property value of an object which is the average of the value of k nearest neighbors.
3.3.4 Ensemble Classifier
In the ensemble classifier, more than one classifiers are used to execute the task.This approach allows the production of better predictive performance compared to a single model. Basic idea is to learn a set of classifiers (experts) and to allow them to vote but it is not always true that all the ensembles will perform better than individual classifiers as it depends on data to data as per [7], when data is taken from magazine and review, ensemble performs better on magazine data as it is grammatically correct while NB performs better on customer reviews. Voting patters vary while making an ensemble of classifiers.In case of hard voting model is selected for from an ensemble on the basis of majority voting while in case of soft voting all classifiers can contribute to the probabilities of outcomes and result is the average of all the individual classifiers.
3.4 Classification Parameters
Classification parameters include accuracy, precision, micro, macro and weighted averages.
3.4.1 Accuracy
It is simply the measure of how much accurate the given data set has been classified . Accuracy varies from classifier to classifier , data set to data set and also from system to system.
Accuracy = mean of individual precision values
3.4.2 Precision
Precision is a mathematical term used to determine how many results our of the given results are correct.
Precision = number of correct result / Number of returned result.
3.4.3 Micro Average
Micro Average = Total number of Correct result / Total number of Returned result.
3.4.4 Macro Average
It is the mathematical value of ratio of sum of precision value of all the individual categories to the total number of support value of each category.
Macro Average = Sum of precision values / Total number of Labels.
3.4.5 Weighted Average
Weighted Average is the ratio of sum of precision value of all individual classes multiplied by its support value to the sum of support value of all the categories.
Weighted Average = (Sum of precision values of each label * support of each ) / Total number of support value.
The main point of distinction between the parameters is that accuracy, micro-average,macro-average and weighted average values are overall average values while precision belong to an individual category and rest all are calculated on the basis of that.
Table-1 Overall Average Accuracy Parameters of all Classifiers when all 20 Categories are included.
Classifier Accuracy Micro
Avg
Macro
Avg
Weighted
Avg
Naive Bayes
0.8074 0.81 0.82 0.82
SVM 0.8562 0.86 0.86 0.86
KNN 0.6473 0.65 0.66 0.66
Ensemble 0.7037 0.70 0.70 0.70
4.
IMPLEMENTATION
The experiment was implemented in Jupyter IDE using Python Scikit Learn Library as it contains all the built in functionaries. From data-sets, 20news.com data-set was imported. Required imported packages include nltk, stopwords, count vectorizer , tf-idf, chi square methodologies,Select k-best and machine learning algorithms.
5.
RESULTS
In this section, the data was evaluated through all classifiers one by one which include Naive Bayes[2] , Support Vector Machine[3](in which uni-gram, bi-gram and tri-gram were evaluated and with and without chi square methods) , k-nearest neighbour algorithm [4]and also through an ensemble classifier[7] using soft-voting methodology[11].
The overall accuracy of each algorithms applied with and without chi-square method were calculated and also of uni-gram, bi-gram and tri-gram for Support Vector Machine. Then the categories for classification were reduced into dissimilar categories and observed the accuracy calculations for each algorithms as by default there are twenty categories with many similarities such as sports and hockey are similar so similarity factor in categories decreases the over all accuracy . The similarity in the categories is clearly indicated through confusion matrix, more is the value of confusion matrix , more is the similarity in the content. Table-1 depicts the
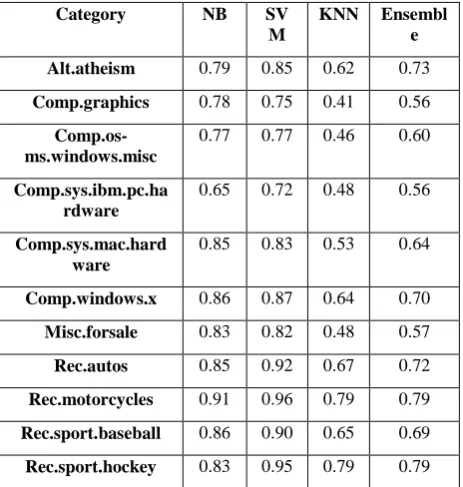
accuracy of all algorithms when all the 20 categories are included. Table-3 shows accuracy results of SVM when there is a variation is parameters and it shows how results vary with parameters while Table-2 shows results when fever classification categories(6) are used. Categories after getting reduced include alt.atheism, sci.crypt,com.os.ns-windows.misc, sci.space ,talk.politics.middleeast ,rec.autos. Table-4 shows the precision value of individual category with all the included classifiers which include NB,SVM,KNN and Soft voting based ensemble. Figure-1 and Figure-2show the accuracy graphs of individual classifiers with 20 and 6 categories respectively while Figure-3 depicts the change in the overall accuracy due to reduction in categories.
Figure-1 Accuracy graph of classifiers when all categories are included
Table-2 Overall Average Accuracy of all Classifiers when 6 Categories are taken into account
Classifier Accuracy Micro
Avg
Macro
Avg
Weighted
Avg
Naive Bayes
0.9241 0.92 0.93 0.93
SVM 0.9259 0.93 0.93 0.93
KNN 0.8443 0.79 0.82 0.82
Ensemble 0.8662 0.87 0.87 0.87
48 Figure-3 Increase in the overall Accuracy of individual
[image:4.595.310.542.69.247.2]classifiers
Table -3 Overall Accuracy of SVM when C and n-gram values vary
N-Gram C Accuracy
1,1 1 0.84773
1,2 1 0.85621
1,3 1 0.86811
1,1 2**5 0.83901
1,2 2**5 0.85321
1,3 2**5 0.85211
1,1 2**-5 0.79890
1,2 2**-5 0.79002
1,3 2**-5 0.80782
[image:4.595.311.524.500.717.2]There has been a slightest increase in accuracy of SVM when bi-gram values were used because uni-gram creates too much bag of words and change in C parameter of SVM also leads to little bit increase when it is combined with bi-gram as it now increases the range from 2 to 5.
Table-4 Precision value of each category with all classifiers when 20 categories are included
Category NB SV
M
KNN Ensembl
e
Alt.atheism 0.79 0.85 0.62 0.73
Comp.graphics 0.78 0.75 0.41 0.56
Comp.os-ms.windows.misc
0.77 0.77 0.46 0.60
Comp.sys.ibm.pc.ha rdware
0.65 0.72 0.48 0.56
Comp.sys.mac.hard ware
0.85 0.83 0.53 0.64
Comp.windows.x 0.86 0.87 0.64 0.70
Misc.forsale 0.83 0.82 0.48 0.57
Rec.autos 0.85 0.92 0.67 0.72
Rec.motorcycles 0.91 0.96 0.79 0.79
Rec.sport.baseball 0.86 0.90 0.65 0.69
Rec.sport.hockey 0.83 0.95 0.79 0.79
Sci.crypt 0.77 0.93 0.77 0.75
Sci.electronics 0.83 0.82 0.64 0.68
Sci.med 0.87 0.91 0.75 0.78
Sci.space 0.79 0.89 0.72 0.72
Soc.religion.christia n
0.71 0.87 0.86 0.86
Talk.politics.guns 0.69 0.76 0.73 0.73
Talk.politics.middle-east
0.90 0.97 0.81 0.81
Talk.politics,misc 0.93 0.85 0.74 0.75
[image:4.595.310.522.505.713.2]Talk.religion.misc 0.92 0.78 0.61 0.64
Table-5 depicts the precision value of individual class when 6 categories are taken into account with all the classifiers used which include NB,SVM,KNN and Ensemble. There one point can be observed that there is not much difference between the average accuracy of both the classifiers because there is less similar categories. For eg - rec.sport.baseball and rec.sport.hockey both belong to sports category so if there is word related to sport or game , there may be in accuracy in classifying that word or assigning any particular category to that word. In the second part of this research, different categories were taken like one from religion column, one from computer, one from automobile, one each from space, cryptography and medical science and there has been a significant increase in overall accuracy as well precision value for the individual class. In case of NB and SVM accuracy jumped from 0.80 and 0.86 to 0.924 and 0.925 but there has been a huge jump in accuracy from 0.64 to 0.78 and in case of soft-voting ensemble, accuracy increased from 0.70 to 0.86 as it takes into account all the algorithms so due to increase in the individual accuracy of NB,SVM and KNN , there has been a significant increase in accuracy of ensemble classifier.
Table-5 Precision value of each category with all classifiers when 6 categories are included
Category NB SV
M
KNN Ensemble
Alt.atheism 0.9
6
0.96 0.88 0.91
Comp.os.ms-windows.misc
0.8 9
0.89 0.90 0.88
Rec.autos 0.9
1
0.90 0.85 0.86
Sci.crypt 0.9
6
0.97 0.58 0.82
Sci.med 0.9
3
0.93 0.85 0.86
Sci.space 0.9
1
0.93 0.88 0.88
6.
CONCLUSIONS
[image:4.595.49.281.512.756.2]classification of data. When categories were reduced, accuracy also improved which shows that more different is the data, more is the accuracy such as rec.automobiles and rec.motorcycle is some what similar category or alt.atheism and soc.religion,christian are also similar categories with religion as main tool of connection. When the table is analyzed, precision value can be seen of different categories which are calculated based on certain formula. Comp.osc.mac and hardware are also similar as mac is one class of computers , so more diverse and different are the classification categories more accurate will be the result. Also bi-gram models improve accuracy than uni-gram as uni-gram creates too much Bag of words which reduce the effectiveness of classifier.
In the future , more categories can be created and more classifiers such as decision tree and random forests and multiple ensembles can be applied on them in order to further clarify the concepts . Articles written in
English language is used in this paper but python’s NLTK(Natural Language Toolkit) also contains data corpus of other languages such as German, French , Italian etc.
7.
REFERENCES
[1] Thelwall M, Buckley K, Paltoglou G. Sentiment in Twitter events. Journal of the American Society for Information Science and Technology. 2011 Feb;62(2):406-18.
[2] Nigam K, McCallum AK, Thrun S, Mitchell T. Text classification from labeled and unlabeled documents using EM. Machine learning. 2000 May 1;39(2-3):103-34.
[3] Joachims T. Text categorization with support vector machines: Learning with many relevant features. InEuropean conference on machine learning 1998 Apr 21 (pp. 137-142). Springer, Berlin, Heidelberg.
[4] Kwon OW, Lee JH. Text categorization based on k-nearest neighbor approach for web site classification. Information Processing & Management. 2003 Jan 1;39(1):25-44.
[5] Conneau A, Schwenk H, Barrault L, Lecun Y. Very deep convolutional networks for text classification. arXiv preprint arXiv:1606.01781. 2016 Jun 6.
[6] Lai S, Xu L, Liu K, Zhao J. Recurrent convolutional neural networks for text classification. InTwenty-ninth AAAI conference on artificial intelligence 2015 Feb 19.
[7] Perikos I, Hatzilygeroudis I. Recognizing emotions in text using ensemble of classifiers. Engineering Applications of Artificial Intelligence. 2016 May 1;51:191-201.
[8] Kim HJ, Kim J, Kim J, Lim P. Towards perfect text classification with Wikipedia-based semantic Naïve Bayes learning. Neurocomputing. 2018 Nov 13;315:128-34.
[9] Meyer D, Hornik K, Feinerer I. Text mining infrastructure in R. Journal of statistical software. 2008 Mar 31;25(5):1-54.
[10]Na JC, Sui H, Khoo CS, Chan S, Zhou Y. Effectiveness of simple linguistic processing in automatic sentiment classification of product reviews.
[11]Cao J, Kwong S, Wang R, Li X, Li K, Kong X.
Class-specific soft voting based multiple extreme learning machines ensemble. Neurocomputing. 2015 Feb 3;149:275-84.
[12] Tetlock PC, Saar‐Tsechansky M, Macskassy S. More than words: Quantifying language to measure firms' fundamentals. The Journal of Finance. 2008 Jun;63(3):1437-67.
[13] Wilson T, Wiebe J, Hoffmann P. Recognizing contextual polarity in phrase-level sentiment analysis. InProceedings of Human Language Technology Conference and Conference on Empirical Methods in Natural Language Processing 2005.
[14] Yu H, Hatzivassiloglou V. Towards answering opinion questions: Separating facts from opinions and identifying the polarity of opinion sentences. InProceedings of the 2003 conference on Empirical methods in natural language processing 2003 Jul 11 (pp. 129-136). Association for Computational Linguistics.
[15] Tan LK, Na JC, Theng YL, Chang K. Sentence-level sentiment polarity classification using a linguistic approach. InInternational Conference on Asian Digital Libraries 2011 Oct 24 (pp. 77-87). Springer, Berlin, Heidelberg.
[16] Das SR. News analytics: Framework, techniques and metrics. InThe Handbook of News Analytics in Finance 2011 May 16 (Vol. 2). John Wiley & Sons Chichester.
[17] Pang B, Lee L, Vaithyanathan S. Thumbs up?: sentiment classification using machine learning techniques. InProceedings of the ACL-02 conference on Empirical methods in natural language processing-Volume 10 2002 Jul 6 (pp. 79-86). Association for Computational Linguistics.
[18] Melville P, Gryc W, Lawrence RD. Sentiment analysis of blogs by combining lexical knowledge with text classification. InProceedings of the 15th ACM SIGKDD international conference on Knowledge discovery and data mining 2009 Jun 28 (pp. 1275-1284). ACM.
[19] Abbasi A, France S, Zhang Z, Chen H. Selecting attributes for sentiment classification using feature relation networks. IEEE Transactions on Knowledge and Data Engineering. 2010 Jul 15;23(3):447-62.
[20] Tan C, Lee L, Tang J, Jiang L, Zhou M, Li P. User-level sentiment analysis incorporating social networks. InProceedings of the 17th ACM SIGKDD international conference on Knowledge discovery and data mining 2011 Aug 21 (pp. 1397-1405). ACM.
[21] Boubacar A, Niu Z. Conceptual clustering. InFuture Information Technology 2014 (pp. 1-8). Springer, Berlin, Heidelberg.
[22] Gabrilovich E, Markovitch S. Wikipedia-based semantic interpretation for natural language processing. Journal of Artificial Intelligence Research. 2009 Mar 30;34:443-98.
[23] Hu X, Zhang X, Lu C, Park EK, Zhou X. Exploiting Wikipedia as external knowledge for document clustering. InProceedings of the 15th ACM SIGKDD international conference on Knowledge discovery and data mining 2009 Jun 28 (pp. 389-396). ACM.