‡ Corresponding author: Lancaster University Management School, Lancaster University, U.K., Tel. ++44 1524
594242, email [email protected]. †School of Computing and Communication, Lancaster University, U.K.
#Universidade Católica Portuguesa, Portugal and International Centre for Research in Accounting, Lancaster
University, U.K. *Alliance Manchester Business School, Manchester University, U.K. We are grateful for comments
and advice from Vasiliki Athanasakou, Ozlem Arikan, Helena Isidro, Thomas Schleifer, Richard Taffler, Stephen Zeff, two anonymous reviewers, the editor (Mark Clatworthy) and workshop participants at Coimbra, Lancaster, Instituto Universitário de Lisboa ISCTE, Manchester, Nottingham, Rice, Warwick, the Portuguese Accounting Research Network, the 2014 Financial Reporting and Business Communication conference, the 2015 South West Accounting Group Annual Conference, the 2016 Portuguese Xmas Accounting Workshop, the European
Accounting Association Annual Congress 2017, the 2017 Portuguese Accounting Network Conference, and the 10th
Internal Conference Católica Porto Business School. Research support was provided by José Costa and Stephen Wattam. Funding for this project was provided by the Economic and Social Research Council (contracts
ES/J012394/1, ES/K002155/1, and ES/R003904/1), the Research Board of the Institute of Chartered Accountants in England and Wales, and the International Centre for Research in Accounting. The software tool described in this paper is copyrighted to Lancaster University and is available for download as a desktop application (for
non-commercial use) at <insert doi>. The dataset of annual report scores is available at <insert doi> and the annual report section corpora are available at <insert doi>. Further details of these and related resources are available at
http://ucrel.lancs.ac.uk/cfie/. Elements of this paper previously formed part of a draft circulated under the title “Heterogeneous Narrative Content in Annual Reports Published as PDF Files: Extraction, Classification and Incremental Predictive Ability”.
Retrieving, Classifying and Analysing Narrative Commentary in
Unstructured (Glossy) Annual Reports Published as PDF Files
Mahmoud El-Haj† Paulo Alves# Paul Rayson† Martin Walker* Steven Young‡
Retrieving, Classifying and Analysing Narrative Commentary in
Unstructured (Glossy) Annual Reports Published as PDF Files
Abstract
1
Retrieving, Classifying and Analysing Narrative Commentary in
Unstructured (Glossy) Annual Reports Published as PDF Files
1. Introduction
Annual reports provide important information to support decision-making (EY 2015: 6, CFA Society U.K. 2016).1 Extant large sample automated analysis of annual report
commentaries focuses almost entirely on Form 10-K filings for U.S. registrants accessed through the Securities and Exchange Commission’s (SEC) EDGAR system (El-Haj et al. 2019). Several features make 10-Ks amenable to automated large-sample research including batch retrieval provisions, plain text formatting, and a standardized reporting template. However, 10-Ks are only part of U.S. registrants’ annual report disclosure package. Many registrants also publish a glossy report containing graphics, photographs and supplementary narratives such as the letter to shareholders (Dikolli et al. 2017). These documents are typically provided as a digital PDF file and outside the U.S. they represent the primary annual reporting vehicle. Barriers to large-scale automated analysis nevertheless mean that little is known about this ubiquitous reporting
channel. We provide a methodological contribution by developing, describing and evaluating an automated procedure for retrieving and classifying the narrative component of glossy annual reports presented as digital PDF files.
A typical annual report comprises two broad elements: a narrative component (often presented in the front portion of the document) and the mandatory financial statements, footnotes and other statutory information (often presented in the rear portion of the document). The
1 Respondents to the CFA Society U.K. survey ranked annual reports ahead of industry-standard databases such as
2
narrative component usually contains management commentary on financial performance during the period, together with supplementary information such as a letter to shareholders, information about principal risks and governance arrangements, corporate social responsibility policy, etc.
Lack of a standardized cross-sectional and temporal reporting template represents the main challenge to large-sample automated analysis of annual report narratives. Most regulatory regimes lack the rigid document structure that characterizes annual reports filed on Form 10-K in the U.S. Although glossy annual report content is typically shaped by legal mandate and
securities market requirements, management enjoys a high level of discretion over document content and structure. In particular, regulations do not normally: prescribe the order in which information is presented; mandate the precise format in which disclosures must be provided (e.g., running text versus tables versus infographics); require use of standard titles for mandatory sections; or impose upper limits on the type and degree of non-mandatory disclosures. Not surprisingly, reporting approaches vary significantly across firms and over time for the same reporting entity. Inconsistent document structure is a significant barrier to automated processing, which is further compounded by the PDF file type used for distributing digital reports.2
Lang and Stice-Lawrence (2015) conduct the first large sample analysis in the accounting literature of PDF annual reports. Lang and Stice-Lawrence (2015) approach the challenge of analysing unstructured PDF reports by converting files to ASCII format using proprietary software and then isolating running text with a Perl script. While the method facilitates analysis of text at the aggregate level, it does not capture the location of commentary within the
document. Lang and Stice-Lawrence (2015) are therefore unable to distinguish narrative
2 PDF (Portable Document Format) files were designed to be portable across platforms irrespective of hardware,
3
commentary from financial statement disclosures (e.g., footnotes) or isolate distinct sections of the narrative component. Pinpointing commentary associated with a specific report element is nevertheless a requirement for many research applications, particularly where themes and language properties vary across sections (Dyer et al. 2017).
We propose and evaluate a procedure for retrieving text and document structure from digital PDF annual reports published by firms listed on the London Stock Exchange (LSE). Our method uses JavaScript and iText libraries to locate the report table of contents, synchronize page numbers in the native report with page numbers in the corresponding PDF, and then retrieve content separately for each section listed in the table of contents. For reports where we are unable to detect the table of contents, we use pre-existing document bookmarks to retrieve text by section. The script is packaged as a desktop application to support academic research.
The ability of our text retrieval method to return information on report structure
represents an important contribution over Lang and Stice-Lawrence (2015) because it facilitates more granular classification of text by report section and theme. Specifically, section headings from tables of contents and bookmarks are used to partition retrieved text into the audited financial statements component of the report and the “front-end” narratives component, with the
latter further subclassified into a set of core sections that feature regularly in automated analyses of 10-Ks and manual analyses using PDF files, including the chair’s letter (Clatworthy and Jones 2006, Dikolli et al. 2017), management commentary (Li 2008 and 2010, Loughran and
4
We validate the accuracy of our retrieval and classification procedure using manual and statistical procedures. Manual tests on over 11,000 sections extracted from 589 processed reports selected at random compare section titles and adjusted page numbers from retrieved tables of contents with corresponding details from the native PDF files, as well as evaluating the accuracy of section classification procedures. Precision and recall statistics (Manning and Schütze 1999) for section retrieval, page synchronization, and section classification generally exceed 95%.
Manual validations are complemented by analyses that test for predictable intra- and inter-report variation in the length, tone and readability of narrative commentary using a sample of over 11,500 documents published between 2003 and 2014. Cross-sectional tests confirm extant evidence that document length is increasing in firm size, business complexity, and intangible assets (Lang and Stice-Lawrence 2015, Dyer et al. 2017). Report length also varies predictably with changes in disclosure regulations. In particular and consistent with Lang and Stice-Lawrence (2015), we show how annual report length increased for LSE Main Market (Alternative Investment Market) firms following mandatory adoption of International Financial Reporting Standards in 2005 (2007). As an extension to Lang and Stice-Lawrence (2015), we confirm expectations that these increases are concentrated in the financial statement component of the report (Morunga and Bradbury 2012).
Findings for net tone are also consistent with predictions and prior research. Like Henry and Leone (2016), we find net report tone is increasing in reported earnings and decreasing in the book-to-market ratio and stock return volatility. Further tests using a within-report design that controls for omitted variable bias confirms expectations that net tone is more positive in
5
limited. Finally, readability tests also provide some evidence of expected intra- and inter-report variation in the Fog index (Gȕnning, 1968), although we are unable to replicate some of the
associations reported by Li (2008).
An important residual question is whether our method is applicable to reports published in other languages and regulatory settings. Since much of our tool is regime and language independent, it is possible to adapt the method to other settings without making changes to the JavaScript code. The primary adaptations involve: substituting the keyword list used to identify the document table of contents in U.K. reports with a comparable keyword list optimized for the chosen reporting language and regulatory setting; and developing new synonym lists that serve as inputs to our section classification algorithms to replace those optimized for U.K. reports. We illustrate the tailoring process directly using a case study of annual reports published in
Portuguese by firms listed on Euronext Lisbon, and report retrieval and classification accuracy rates similar to those obtained for our sample of U.K. reports.
6
In addition to our methodological contribution, we also provide a unique dataset of structure and content for over 26,000 annual reports for fiscal year-ends January 2003 through December 2017 published by 4,131 financial and non-financial firms listed on the LSE Main Market and Alternative Investment Market (AIM). The dataset provides researchers with the first opportunity to undertake large-sample analysis of annual report narrative disclosures that are not constrained by the SEC’s 10-K reporting template. We also provide an annual report corpus consisting of nearly 200 million words, together with a set of corpora for common annual report sections including the chair’s letter, governance statements, remuneration reports, risk reports, and audit reports.
The remainder of the paper is organised in six sections. Section 2 reviews relevant research and summarizes regulations governing annual reporting. Section 3 describes our extraction and classification procedure. Section 4 reports details of our manual and large sample statistical validity tests, while section 5 presents details of annual report data resources created to support future research. Section 6 demonstrates how our procedure can be adapted to analyse non-English language reports published outside the U.K. Conclusions are presented in section 7.
2. Background and overview
7
Many U.S. registrants complement their statutory 10-K filing with a brochure-style annual report distributed as a digital PDF file in which summary information is combined with additional disclosures.3 Outside the U.S., these glossy brochure-style PDF reports represent the primary format in which firms’ mandatory annual report and accounts are available (Lang and
Stice-Lawrence 2015).4 The International Accounting Standards Board (IASB) does not provide a formal definition of either financial reporting or the annual report.5 Instead, specific
components of the annual report have evolved in practice (Financial Reporting Council 2012: 8), with significant local variation from a mandated core. For example, European Union Directive 2013/34/EU requires annual financial reports of public-interest entities traded on a regulated market of any Member State to include: a management report, a corporate governance statement, and the financial statements. Corporate laws and securities regulations in individual Member States further refine and supplement these baseline requirements. At a more primitive level, the typical PDF annual report file can be decomposed into two distinct elements: a narrative component (often presented in the front portion of the document) and the mandatory financial statements, footnotes and other statutory information (often presented in the rear portion of the document). The narrative component usually contains management commentary, together with
3 SEC rules require companies to supply shareholders with an annual report prior to annual meetings involving
election of boards of directors. While some companies send their 10-K filing to shareholders in lieu of a separate annual report, many produce a separate document that contains a summary of the 10-K plus additional content such as infographics and a letter to shareholders from the CEO. A significant fraction of registrants incorporate much of their mandatory 10-K filing by reference to these separate annual reports (Loughran and McDonald 2014: 98).
4 Electronic filing and retrieval systems are rare outside the U.S. Examples include TSX SecureFile and the System
for Electronic Document Analysis and Retrieval (SEDAR) in Canada, and the Data Analysis and Retrieval Transfer (DART) system in South Korea.
5 International Standard on Auditing (ISA) 720 (Revised) describes the annual report as “a document, or
8
supplementary information such as a letter to shareholders and reviews of strategy, risk, corporate governance, and executive remuneration policy. Text is often augmented with photographs, tables and infographics aimed at improving disclosure quality.
Glossy annual reports supplied as PDF files lack the consistent, linear structure of the 10-K. Instead, management enjoys significant discretion over the information disclosed, the order in which information is presented, and the labels used to describe individual sections. Discretion over content, placement and nomenclature helps management tailor commentary to their firm’s particular circumstances (Institute of Chartered Secretaries and Administrators 2015). However, inevitable variation in report structure across firms and over time renders automated document processing a significant challenge (Dikolli et al. 2017). Research examining these documents is therefore scarce and limited primarily to manually-coded samples involving individual report sections (Merkl-Davies and Brennan 2007).6 The lack of large sample evidence on the properties of these documents is startling given the degree of regulatory scrutiny they attract, coupled with high preparation costs and their enduring status as a key element of corporate communication.
Lang and Stice-Lawrence (2015) conduct the first large sample analysis of English-language annual reports using more than 87,600 PDF files for over 15,000 non-U.S. firms from 42 countries for calendar years 1998 through 2011. Results reveal how text attributes correlate predictably with regulatory features and managers’ reporting incentives, and how higher quality
disclosures are associated with positive stock market outcomes. They extract text from
unstructured PDF English-language reports by converting files to ASCII format using Xpdf and QPDF proprietary software and then construct aggregate measures of the entire textual content of glossy annual reports. While these aggregate measures are reasonable for the research questions
6 Notable exceptions include Schleicher et al. (2007), Grüning (2011), Lang and Stice-Lawrence (2015),
9
examined by Lang and Stice-Lawrence (2015), the inability to associate narratives with specific annual report sections is inconsistent with the majority of extant research that studies narrative content at a more granular level (e.g., Clatworthy and Jones 2006, Li 2010, Loughran and McDonald 2011, Campbell et al. 2013, Dyer et al. 2017, Dikolli et al. 2017).
3. Document processing procedure
This section summarizes our procedure for: retrieving text and document structure from PDF annual report files; partitioning reports into the “front-end” narratives component
(hereinafter Narratives) and the “back-end” mandatory financial statements and footnotes
component (hereinafter Financials); and classifying the Narratives component into core sections that are cross-sectionally and temporally comparable.
Annual report structures vary significantly across reporting regimes and therefore to make the initial development task feasible we focus on reports for a single reporting regime. We select the U.K. due to the LSE’s position as one of the largest equity markets by capitalization outside the U.S. The extraction process is nevertheless designed to be generalizable insofar as reports published in other reporting regimes and languages can be analysed by modifying the language- and regime-dependent aspects of our procedure without editing the underlying JavaScript. (See section 6 for further details and an application to Portuguese annual reports.)
3.1 Retrieval
Our procedure for retrieving text and document structure from digital PDF reports involves the following four steps:7
7 Image-based PDF files cannot be processed reliably using our procedure. We convert image-based PDFs to digital
10
1) Detect the page containing the annual report table of contents. The contents table serves as the map by which we navigate the remainder of the report. Information in the table of contents is used to identify individual sections and the pages on which they begin and end. Lack of a common location and format for the table of contents, together with the absence of regularized section headers makes detecting the contents page a nontrivial task.8 Our
approach involves identifying a set of common section titles and associated synonyms based on an initial sample of 50 reports selected at random. We use this provisional list of headers to identify the contents page by matching the text on each page of the document against our key-phrase list. This provisional list is augmented through several iterations where we extract tables of contents from 1,000 reports selected at random in each cycle and then use the results to update our list for frequently occurring headers and synonyms based on manual review. The final “gold standard” list is presented in an online appendix.
To further improve detection accuracy and minimize Type 1 errors, we match gold standard headers to lines of text that follow a contents page-like style (i.e., gold standard phrases preceded or followed by alphanumeric characters representing a number). Each page in the PDF is matched against the gold standard header set and the page with the highest similarly score (Levenshtein 1966) is identified as the potential contents page;
2) Isolate the report table of contents and discard co-located material. Our algorithm involves matching each line of text in the candidate contents page against a regular expression command that extracts any line of text starting or ending with an alphanumeric
not guaranteed to extract content reliably. Although we have processed image-based PDFs, we do not include the results in our final dataset due to validity concerns.
8 Many firms present information such as highlights, overview, etc. prior to the contents page. Tables of contents
11
representation of a number between one and the number of pages in the annual report. To be classified as a valid table of contents for use in retrieval steps (3)-(4) described next, results must satisfy conditions detailed in the appendix;
3) Synchronize page numbers in the digital PDF file with page numbers in the valid table of contents. Pagination in the PDF file rarely corresponds to pagination in the native annual report because the front and inside front cover pages, which are almost always included in the PDF, are not normally paginated in the actual report. We develop a page detection algorithm that crawls through a dynamic set of three consecutive pages with the aim of detecting a pattern of sequential numbers with increment one (e.g. 31, 32, 33). The extracted sequence is then used to calibrate page numbers across the entire PDF file;
4) Use synchronized page numbers to determine the start and end of each section in the annual report table of contents, insert bookmarks into the PDF for each section based on the page mapping, and extract annual report content section by section using these bookmarks.9 All retrievable text is captured including text from tables and infographics. The absence of HTML-type tags in PDF files means we are currently unable to isolate tables and charts, capture different font styles and sizes, and pinpoint the relative position of text on the page.
Steps (2) - (4) are tested and refined using multiple iterations for samples of 1,000 reports selected at random from years 2004 through 2010, with manual evaluation of precision and recall performed at each step (Manning and Schütze 1999).
Step (2) distinguishes between valid and invalid candidate tables of contents. We apply an alternative retrieval procedure based on bookmarks assigned by the PDF originator for reports where the candidate table of contents is classified as invalid in step (2). We create a flag for such
9 Pre-existing bookmarks are overwritten. The majority of annual report sections start on a new page. In the rare
12
reports indicating that document structure and section-level text retrieval is based on document bookmarks rather than the report table of contents.10
3.2 Classification: Narratives and Financials
Most applications involving annual report narratives require researchers to distinguish between content from the Narratives and Financials components of the annual report. The absence of a standardized reporting format means that management are free to present individual report sections in any order, and therefore Narratives and Financials components are often not delineated clearly and consistently. Isolating these two generic elements of the report is therefore a non-trivial task. We use a two-step classification procedure based on section headers in the table of contents (or bookmarks where a valid table of contents is not detected). Step one involves applying a binary split based on the naïve linear document structure represented in Figure 1, with the delineating point set at either the audit report or directors’ statement of
responsibilities (whichever occurs first).11 Sections occurring before this cut-off point in the table of contents are allocated to Narratives_Null while sections including and following the cut-off point are allocated to Financials_Null. Step two of the process adjusts both components for sections misclassified in the first pass. Specifically, we search all section headings in
Narratives_Null for character strings associated with standard section headers expected to form part of Financials (e.g., consolidated statement of net income, consolidated statement of
10 Most digital PDF annual reports published since 2012 contain bookmarks that either replicate sections from the
table of contents or provide additional granularity beyond headers listed in the table of contents. Inconsistency across reports in the mapping from the table of contents to bookmarks creates comparability problems for analyses requiring the complete report structure, hence our preference for basing retrieval on the published table of contents. Retrieval based on bookmarks represents a reliable second-best option where the report table of contents cannot be identified reliably. Retrieval using bookmarks does not impair the reliability of report partitioning and classification of core narrative sections. Further details are provided in the appendix.
11 Figure 1 is a representative annual report based on a combination of the median structure of all documents
13
financial position, notes to the accounts, etc.) and reallocate these sections to the Financials
component. Analogously, we search all section headings allocated to Financials_Null for strings associated with headers expected to form part of Narratives in a U.K. annual report (e.g.,
chairman’s statement, CEO review, financial review, business review, remuneration report, corporate governance statement, etc.) and reallocate these sections to the Narratives component.
3.3 Classification: Narratives subcomponents
Analysing the entire textual content of Narratives provides a useful starting point for exploring the properties of annual report disclosures. However, more granular analysis of
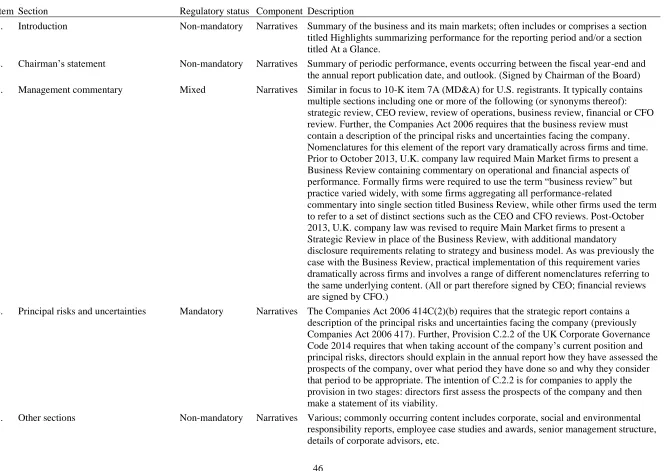
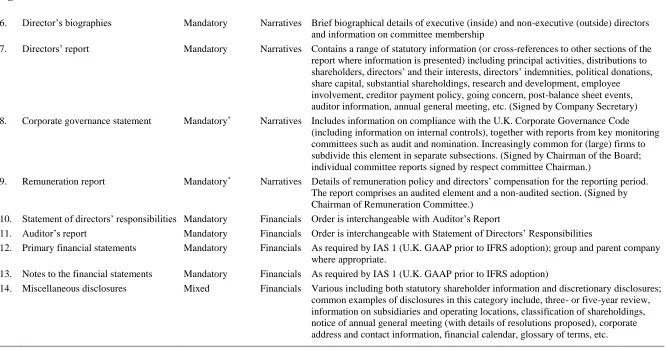
common subcomponents such as management commentary is the norm in most applications. The 10-K filing template makes this decomposition relatively straightforward for U.S. registrants because reports contain a prescribed list of standardized schedules. Unstructured PDF annual reports lack such standardization, with content varying significantly across firms and time. Different naming conventions are also used to describe the same report section.12 We approach this classification problem by identifying a set of core report categories based on Institute of Chartered Secretaries and Administrators (2015) and Financial Reporting Council (2014) guidance, coupled with manual review of reports selected at random. Our final category list includes the following elements: performance highlights, statement from the board chair, management commentary (including CEO review, operating review, business review, strategic review, CFO review, financial review, etc.), governance statements (including internal control),
12 For example, the annual letter to shareholders has 33 distinct labels in our dataset after controlling for minor
14
and remuneration reports. Remaining sections are allocated to an aggregate residual category.13 A synonym list for each category is developed and used as the basis for a search algorithm that crawls through the table of contents classifying sections.14 Synonyms for each core section are presented in the appendix.
3.4. Text processing
Retrieved text is processed automatically by our procedure and outputs are provided in a spreadsheet (.csv format).15 We provide aggregate scores for the Narratives and Financials
components, along with scores for each section in the Narratives component. Default metrics comprise: total word count; total page count; Fog index of readability (Gȕnning, 1968) computed using a version of Fathom (Svoboda 2013); Flesch-Kincaid readability index (Kincaid et al., 1975); and counts for positive and negative words from Henry (2006, 2008) and Bill
McDonald’s webpage (http://www3.nd.edu/~mcdonald/Word_Lists.html), forward-looking
words drawn from prior research, strategy-related words (Athanasakou et al., 2019), uncertainty words from Bill McDonald’s webpage (http://www3.nd.edu/~mcdonald/Word_Lists.html), and
causal reasoning words from based on an author-defined list. (Details of wordlist elements are provided in the appendix.) Our tool also offers users the option of uploading and applying their own bespoke wordlists in addition to our default lists. Raw text retrieved at the section level is
13 The following four additional core report sections are classified in version of the tool available at the date of
publication: risk report, corporate social responsibility, chair’s governance overview, and group audit report. See section 5 and the appendix for further details.
14 Preliminary synonym lists were based on a sample of 1,500 annual reports selected at random. To address the
problem of variable word ordering and the presence of stop words (e.g. “the”, “of”, “and”, etc.) in the header title we used Levenshtein distance to compare header strings (Levenshtein 1966). The Levenshtein distance between two words is the minimum number of single-character edits (insertion, deletion, or substitution) required to change one word into the other. To work at the phrase level we modified the algorithm to deal with words instead of characters.
All headers with a Levenshtein distance value less than six were manually reviewed and used to create revised lists. The process was repeated two further times to determine the final gold standard synonym lists.
15 The text scoring procedures described below can be applied to plain text files containing textual content derived
15
also saved as a .txt file for further analysis in software packages such as Diction, WordSmith, AntConc and WMatrix (Rayson, 2008: http://ucrel.lancs.ac.uk/wmatrix/).
4. Evaluations
This section reports results of tests designed to evaluate the performance of our retrieval and classification procedure. Section 4.1 reports results for manual comparisons of extracted text against source PDF files while section 4.2 presents additional large-sample validity tests that correlate the length, tone and readability of retrieved narratives with expected determinants.
4.1 Manual evaluation
Manual evaluations are performed to assess the following four aspects of retrieval and classification performance: (i) detecting and extracting the annual report table of contents; (ii) synchronizing page numbers for each section reported in the annual report table of contents with corresponding page numbers in the PDF file; (iii) classifying the annual report into Narratives
and Financials; and (iv) classifying Narratives into generic categories.
Evaluations are based on a random sample of 586 reports that were not used to
16
We use precision and recall constructs to evaluate extraction and classification performance (Manning and Schütze, 1999). Precision measures the fraction of retrieved instances that are relevant (or the incidence of Type I errors) and is viewed as a measure of exactness or quality, while recall measures the fraction of relevant instances that are retrieved (or the incidence of Type II errors) and reflects a measure of completeness or quantity:
) ( ) ( ) ( fp N tp N tp N precision
(1a)
) ( ) ( ) ( fn N tp N tp N recall
, (1b)
where N(tp) is the number of true positives, N(fp) is the number of false positives (Type I errors), and N(fn) is the number of false negatives (Type II errors). We also compute the F1 score,
defined as the harmonic mean of precision and recall, as an overall measure of retrieval and classification accuracy (Van Rijsbergen 1979):16
recall precision recall precision F 2
1 . (2)
Table 1 reports evaluation results computed at the section-level. Results are presented for the pooled annual report (Narratives plus Financials) as well as separately for the Narratives
component. Panel A of Table 1 presents results for retrieval accuracy. Our random sample of 586 processed annual reports contains 11,009 individual sections in aggregate as listed in the tables of contents. Our tool extracts 10,820 headers in total, of which 10,534 sections are correct. The 286 Type I errors (10,820 – 10,534) correspond to conditional retrieval precision of 97.4 percent, while the 475 Type II errors (11,009 – 10,534) correspond to a conditional recall rate of 95.7 percent. Overall conditional retrieval accuracy as measured by the F1 score is 96.5 percent.
16 The F score is derived such that F measures the effectiveness of retrieval with respect to an individual who
attaches times as much importance to precision as recall. The F1 score places equal weight on precision and recall,
17
Results for Narratives are quantitatively similar with precision, recall and F1 scores equal to 95.9 percent, 95.8 percent, and 95.8 percent, respectively.
Panel B of Table 1 reports conditional error rates for page number assignment. Findings presented in columns 2-4 treat Type I extraction errors from Panel A as incorrectly assigned page numbers and as such provide a lower bound assessment of pagination performance. Findings reported in columns 5-7 are computed using the subsample of 10,534 sections extracted correctly and therefore represent an upper bound on pagination accuracy. Pagination error rates in Panel B for the entire annual report range from 93.2 percent for the more restrictive test to 95.7 percent using the more lenient test. Similar findings are reported in the second row of Panel B for
Narratives.
Results for document partitioning and header classification are presented in Panel C of Table 1. Evaluations are conducted using the subsample of 10,534 sections extracted correctly by our system. The first two rows in Panel C report results of partitioning reports into the Narratives
and Financials components. The total number of misclassified sections is 171 (1.6 percent), of which 88 (83) are Financials (Narratives) misclassified as Narratives (Financials). These results translate into conditional precision and recall scores of approximately 98 percent for Narratives
(Financials).
The final six rows in Panel C present evidence on classification accuracy for generic sections in the Narratives component. Classification accuracy as reflected in the F1 score is highest for chair’s statements (99.3 percent), remuneration reports (98.6 percent) and summary
18
provides a valid approach for large samples of documents. Accuracy rates are particularly encouraging given the complex, highly unstructured nature of PDF annual reports.
4.2 Statistical evaluation
This section evaluates extraction and classification performance by examining
correlations between properties of annual report disclosures and known or expected determinants thereof. We focus on three properties of annual report narratives that have featured prominently in prior accounting research and policy debates: length, tone, and readability. Tests are
conducted using a sample of annual reports published in calendar years 2003 through 2014 by non-financial firms listed on the LSE. Our tool processed 20,446 reports from an initial set of 24,142 available reports (85%). Non-processed reports comprise 1,700 image-based PDF files (7%) and 1,996 other reports (8%). Processed reports are filtered further to exclude: 609 booklet style reports comprising two annual report pages on a single PDF page (2.5%); non-English language reports (one case); and 28 regulatory filings including reports containing 20-F
reconciliations (0.1%). The resulting 19,808 reports for 3,302 financial and non-financial firms are matched with firm identifiers and fiscal year-ends from Thomson Reuters Datastream to permit collection of accounting and market data.17 Further analysis suggests that these criteria do not introduce material selection bias into the final annual report sample, apart from the image-based file condition which tends to result in a disproportionate loss of reports for small firms and
17 PDF annual report filenames do not contain a unique firm identifier. Instead, filenames typically use a standard
19
fiscal years prior to 2006 in the U.K. setting. Excluding matching errors, missing Datastream accounting and market data, fiscal years greater (less) than 15 (nine) months, and financial firms reduces the sample to 11,856 non-financial firm-years, although some tests use fewer
observations where additional data restrictions apply.
Report length
Factors identified in prior research as correlating with longer annual report commentary include: firm size, because larger firms tend to disclose more (Watts and Zimmerman 1986); organisational complexity, because more complex businesses and business models are likely to have more complex annual reports (Li 2008, Dyer et al. 2017); accounting losses, because poor financial results are harder to explain (Bloomfield 2008) or involve more management
obfuscation (Li 2008); return volatility, because communication to investors is likely to be more complicated for firms with more volatile operations (Li 2008); and intangible assets proxied by the book-to-market ratio, because narratives provide information about assets and future revenue streams that extend beyond the scope of financial statements (Dyer et al. 2017).18 We test for similar relations in our data. We also expect firms listed on the LSE Main Market to have longer reports than their AIM counterparts because Main Market firms face more extensive disclosure requirements. Finally, International Financial Reporting Standards (IFRS) (IASB 2010 para. 23) and ISA 720 (Revised) require auditors provide assurance on the degree of consistency between the Financials and Narratives components of the annual report. This consistency requirement is expected to induce a positive association between the volume of information presented in these two components. We therefore estimate the following OLS regression:
18 While Dyer et al. (2017) find evidence consistent with their prediction, Li (2008) finds that intangible rich firms’
20 it it it it it it it it k it Financials Length Main Segments ReturnVol BTM Loss Size Length _ 7 6 5 4 3 2 1 0
. (3)
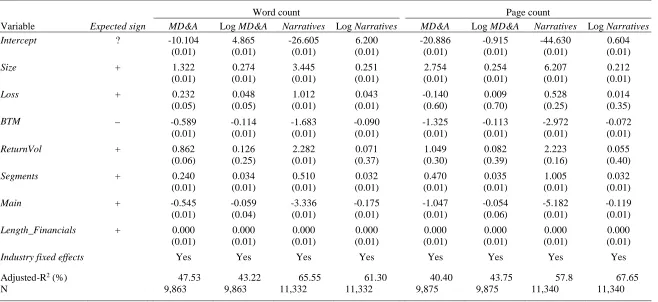
Length is report length, where k indicates either word count (scaled by 103 to simplify reporting) or page count for firm i's report in fiscal year t. We estimate model (3) using both management commentary (i.e., MD&A-equivalent sections) and the entire Narratives component. Length is positively skewed and so we report results using both raw values and log-transformed values for completeness. Covariates in model (3) are defined as follows: Size is the natural logarithm of total assets; Loss is an indicator for firm-years where earnings from continuing operations are negative; BTM is book-to-market ratio and proxies for intangible assets; ReturnVol is the standard deviation of monthly stock returns computed over fiscal year t; Segments is number business segments and proxies for organisational complexity; Main is an indicator variable equal to one if firm i is listed on the LSE Main Market in fiscal year t and zero otherwise;
Length_Financials is the number of words in the Financials component of the annual report;
represents industry fixed effects; and is the regression residual. Based on prior research we test
1, 2, 4, 5, 6 and 7 > 0 and 3 < 0.
All accounting and market data required to estimate model (3) are obtained from Thomson Reuters Datastream. All continuous (lower-bounded) variables are winsorized at the top and bottom (top) percentile. Coefficient estimates and model summary statistics are presented in Table 2. Findings are broadly consistent with expectations. Size, BTM, Segments,
21
stock return volatility also have longer annual report commentaries using raw word count, whereas results are insignificant for log word count and all specifications using page count. Overall, we interpret results in Table 2 as evidence that our retrieval and classification procedure extracts annual report text reliably.19
In addition to the variables included in model (3), prior research highlights a link between annual report length and financial disclosure regulations (Dyer et al. 2017; Lang and
Stice-Lawrence 2015). We therefore conduct supplementary validity tests by extending model (3) to capture the impact of key regulatory developments predicted to affect annual report length. These tests also address endogeneity concerns by exploiting phased adoption of regulations.
Lang and Stice-Lawrence (2015) document an increase in report length for an international sample of firms following mandatory adoption of IFRS. We test for a positive impact of IFRS adoption on annual report length using an identification strategy that exploits staggered IFRS adoption by LSE firms. Specifically, while Main Market firms adopted IFRS for fiscal years beginning on or after January 1, 2005, mandatory IFRS adoption was delayed for AIM firms until January 1, 2007. Accordingly, we expect to observe a structural increase in report length for Main Market (AIM) firms after 2005 (2007). Further, because IFRS relate primarily to financial statements and accompanying footnote disclosures, the IFRS-related impact on disclosure length should centre on the Financials component of the annual report.
More generally, Dyer et al. (2017) show how FASB and SEC compliance requirements have increased the length of 10-K disclosures. We therefore use the introduction of enhanced
19 In supplementary tests we replaced Loss in model (3) with a vector of indicator variables corresponding to ROA
22
compliance requirements on corporate governance reporting for Main Market firms post-2007 as an additional setting in which to validate our extraction and classification procedure.
Specifically, implementation of European Directive 2006/46/EC in 2008 increased annual report disclosure requirements on corporate governance for Main Market firms with a registered office in the European Community. Additional governance- and remuneration-related disclosure requirements were also mandated for Main Market firms following revisions to the U.K.
Corporate Governance Code in 2008 and 2010. Crucially, these requirements relate exclusively to Narratives and do not apply to AIM firms. Contrary to the relative increase in the post-2007 length of Financials for AIM firms following IFRS adoption, we therefore expect to observe a decline in Narratives length for AIM firms post-2007 relative to their Main Market counterparts.
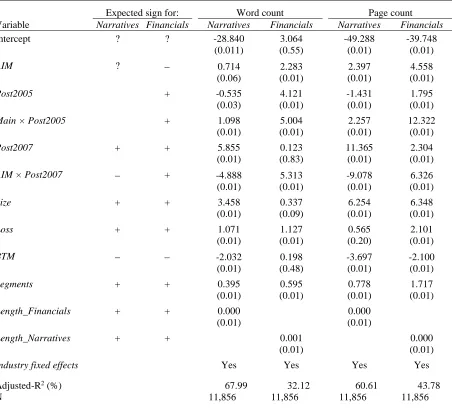
We test the above predictions by estimating the following extended version of model (3):
it q it it it it it it it it p it LengthAR Segments BTM Main Loss Size Post AIM Post Post Main Post LengthAR 10 9 8 7 6 5 4 3 2 1
0 2005 2005 2007 2007
, (4)
where LengthAR is either the number of words or the number of pages for the pth (qth) annual report component for firm i and fiscal year t (p = Narratives, Financials; q = Financials,
Narratives); Main is an indicator variable for LSE Main Market firms in year t and AIM is the converse of Main;Post2005 and Post2007 are indicator variables for fiscal years beginning on or after 1 January 2005 and 1 January 2007, respectively; other variables are as defined in model (3); and is the regression residual.20 We test
1, 2, and 4 > 0 for LengthARFinancials, 3 > 0 for both LengthARFinancials and LengthARNarratives, and 4 < 0 for LengthARNarratives.
20 The Stable Unit Treatment Value Assumption (SUTVA) applies to equation (4). The SUTVA requires that the
23
Findings for model (4) in Table 3 are consistent with expectations. Columns 4 and 5 are estimated using word counts for Narratives and Financials, respectively, while columns 6 and 7 are estimated using page counts. As predicted, Post2005 loads positively for Financials,
reflecting IFRS-adoption effects. Similarly, Post2007 loads positively for Narratives and
Financials, reflecting the concurrent impact of expanded disclosure rules on corporate governance (for Main Market firms) and IFRS adoption (for AIM firms). Consistent with mandatory IFRS adoption increasing financial statement disclosures for Main Market firms,
Main×Post2005 loads positively for Financials in column 5 (word count) and column 7 (page count). A similar effect is evident following mandatory adoption by AIM firms in 2007: coefficients on AIM×Post2007 are positive in columns 5 and 7 for Financials reflecting a relative increase in financial statement disclosures for AIM firms post-IFRS implementation. Since IFRS adoption effects are likely concentrate in the Financials component of the annual report, AIM×Post2007 is not expected to load positively in columns 4 and 6 when the model is estimated for Narratives. Indeed and as expected, AIM×Post2007 loads with a negative
24
Report tone
Our second large sample validation test focuses on net tone, defined as the number of positive words minus the number of negative words, scaled by the sum of positive and negative words (Henry and Leone 2016). We test for predictable variation in tone using both cross-sectional and within-report approaches.
Within-report tests exploit predictable variation in tone across different sections from the same annual report. Examining within-document variation in tone helps mitigate endogeneity concerns regarding omitted variable bias because firm- and time-specific factors affecting reporting style and content are held constant. Tests compare tone for governance statements and remuneration reports with tone in the management commentary and the letter from the board chair. Governance statements and remuneration reports are mandatory disclosures for Main Market firms, with content shaped by compliance considerations that limit scope for relentless management optimism. In contrast, management face few constraints on the form and content of key performance-related commentaries such as the letter to shareholders and management’s commentary (MD&A). Consistent with management exploiting their reporting discretion to present a favourable view of periodic performance, evidence of systematic positive reporting bias has been widely reported for management performance commentaries generally (Merkl-Davies and Brennan 2007, Li 2010) and for U.K. annual report commentaries in particular (Clatworthy and Jones 2006). Accordingly, we expect performance-focused sections such as the chair’s letter and management commentary to be associated with more positive tone than
governance statements and remuneration reports in the same annual report.21
21 Dikolli at el. (2017) use similar arguments to motivate their within-firm comparison between the MD&A and the
25
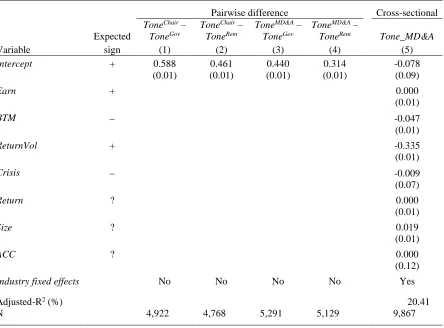
We compute the within-report difference in net tone between Main Market firms’ kth
performance section and their pth mandatory governance-related section, where k is equal to the chair’s letter or management commentary and p is equal to the governance statement or
remuneration report. We expect Tonek Tonep to be positive. Findings for the resulting four pairwise combinations are reported in models (1)-(4) in Table 4. Consistent with expectations, intercept coefficients capturing the pairwise difference in tone are consistently positive and significant at the 0.01 level. The average chair’s letter is over five (four) times more positive than the corresponding governance statement (remuneration report), while the average management commentary section is over four (three) times more positive than the corresponding governance statement (remuneration report). These within-document tests suggest our classification method is capable of reliably identifying key annual report sections.
Cross-sectional validity tests assess the replicability of established correlations between annual report tone and firm characteristics. Henry and Leone (2016, Table 8) report a robust positive correlation between MD&A tone and reported earnings, and robust negative associations with the book-to-market ratio and contemporaneous stock return volatility (due to lower growth options and higher uncertainty, respectively). Building on Henry and Leone (2016), we also expect annual report tone to have been less positive during the global financial crisis when valuations declined and economic forecasts looked bleak. Similar to Henry and Leone (2016), we estimate the following OLS regression:
it it it it it it it i it ACC Size Return Crisis ReturnVol BTM Earn A MD Tone 7 6 5 4 3 2 0 & _
. (5)
26
scaled by lagged price; ReturnVol is the standard deviation of monthly stock returns in the 12 months prior to the fiscal year-end date; Crisis is an indicator variable equal to one for reports published during the financial crisis period (June 2007 through December 2010);22Return is cumulative stock returns for the fiscal year; ACC is earnings from continuing operations minus
cash from operations, scaled by total assets; and Size,BTM and are as defined in model (3).
Following Henry and Leone (2016) we test 1 > 0, and 2 and 3 < 0. We also test 4 < 0 based
on the prediction that management commentary was systematically less optimistic during the financial crisis. We treat Returns, Size, and ACC as control variables in equation (5) because findings reported by Henry and Leone (2016) for these covariatesdiffer across tone measures.
Results for regression (5) are presented in the final column of Table 4, with all
continuous (lower-bounded) variables winsorized at the top and bottom (top) percentile. Earn,
BTM and ReturnVol load significantly with the expected signs. The estimated coefficient on
Crisis is also negative at the 0.1 level. Management tone also correlates positively with
contemporaneous 12-month stock returns which is intuitive despite not being evidenced robustly by Henry and Leone (2016). Finally, we note that tone is increasing in firm size although no prediction is offered for this variable. Evidence that the tone of management commentary varies cross-sectionally in ways predicted by prior research provides further support for the validity of our retrieval and classification procedure.
22 The start of our financial crisis window coincides with U.S. congressional testimony on 1 June 2007. The end of
our crisis window is 31 December 2010 following announcements on 1 December 2010 by the Federal Reserve (details of actions taken to stabilize markets since the start of the crisis) and 7 December 2010 by the U.S. Treasury Department (sale of remaining stake in Citigroup). We set Crisis equal to one for fiscal years ending after 1 March 2007 and before 31 March 2011) to allow a three months publication lag for the annual report. See
27
Report readability
Our third large sample validation test focuses on document readability measured using the Fog index. Consistent with our analysis for net tone, we test for predictable variation in the Fog index using both within-report and cross-sectional approaches.
Our document-level approach tests for predictable disparity in readability across different sections of the same annual report. We expect narratives linked to regulatory compliance to be characterized by more complex language due to a higher incidence of jargon and a more legalistic writing style. Governance statements and remuneration reports are two U.K. annual report sections where content is determined by prevailing regulations to a large degree. In contrast, the chair’s letter to shareholders is a voluntary disclosure designed specifically to provide a concise, accessible overview of firm performance and corporate milestones. We therefore expect the average chair’s letter to display higher readability (lower Fog index) compared with governance statements and remuneration reports contained in the same report.
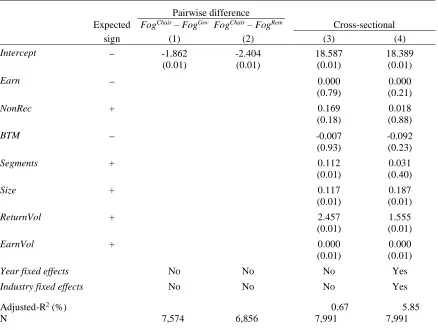
We compute the within-report difference in Fog index between the chair’s letter and the
pth governance-related section, where p is equal to the governance statement or remuneration report. We expect ReadabilityChair Readabilityp to be negative.23 Findings for pairwise
comparisons are reported in columns (1) and (2) in Table 5. Intercept coefficients capturing the pairwise difference in Fog are negative and significant at the 0.01 level. The average chair’s
letter requires 1.9 years less education to read compared with the typical governance statement
23 Descriptive statistics for readability reveal a high number of extreme values. For example, the minimum Fog
index value for the chair’s letter is zero and 95th percentile value is 30. We address this issue by trimming at the one
28
and 2.4 years less training relative to the average remuneration report. (Untabulated descriptive statistics reveal that the chair’s letter is associated with a Fog index of 19.7.)24
Cross-sectional validity tests for readability follow Li (2008) who predicts the Fog index for management commentary is increasing in weak earnings performance and transitory losses (due to managerial obfuscation), the market-to-book ratio (because growth options require more complex disclosures), firm size and the number of business segments (because disclosures tend to be more complicated for larger firms with more complex operations), and stock return
volatility and earnings volatility (because high business and operating uncertainty are associated with more complex disclosures). Results reported by Li (2008, Tables 2 and 3) broadly support the predicted associations, although size and number of business segments do not load as expected. Following Li (2008) we estimate the following OLS regression:
Fog_MD&Ait= λ0 + 𝜆1Earnit+ λ2NonRecit +λ3BTMit + λ4Segmentsit
, (6) + λ5Sizeit+λ6ReturnVolit + λ7EarnVolit + φ + ϕ + υit
Variable definitions are as follows: Fog_MD&A is the Fog index (Gȕnning 1968) for the management commentary section of firm i’s annual report published in year t, computed using Svoboda’s (2013) algorithm; Loss is equal to one where reported earnings are negative and zero otherwise; NonRec is equal to one where GAAP earnings include negative exceptional items and zero otherwise; EarnVol is the standard deviation of earnings per share for the three-year period
ending in year t; represents calendar year fixed effects; and all other variables are as defined in
models (4) and (5). Following Li (2008) we test 1, 2,4, 5, 6 and 7 > 0 and 3 < 0.
Results for regression (6) are presented in models (3) and (4) of Table 5, with all continuous (lower-bounded) explanatory variables winsorized at the top and bottom (top)
24 Loughran and McDonald (2016) note that differences in readability are often economically small although
29
percentile, and Fog_MD&A trimmed at the one and 95 percentiles. With the exception of Earn, all explanatory variables in model (3) load with their expected signs, and Segments, Size,
ReturnVol and EarnVol are significant at conventional levels. Similar results are evident in model (4) when the regression is extended to include time and industry fixed effects, with the exception that Segments is no longer significant. Lang and Stice-Lawrence (2015) also report mixed results using the Fog index. Our evidence suggests that caution is necessary when using readability scores for annual report text retrieved by our procedure. The mixed findings are also consistent with concerns about the Fog index as a measure of financial readability (Loughran and McDonald 2016) and evidence reported by El-Haj et al. (2019, Appendix) that award winning U.K. annual reports are not associated with reliably lower Fog scores. Collectively however, results reported in Tables 2-5 support conclusions from manual validation tests which suggest that our retrieval and classification procedure provides a reliable means of measuring textual content and document structure for large-sample analyses.
5. Annual report data resources
This section provides brief details of annual report narrative resources constructed using our procedure to support further research in this area. The first data resource is a comprehensive dataset of U.K. annual report features designed to support large-sample research into the
30
uncertainty for key report sections, and for the aggregate Narratives and Financials components. The dataset is available at <doi>, along with variable definitions, full details of the sampling procedure, and instructions on how to match reports with firm identifiers from Thomson Reuters Datastream.25
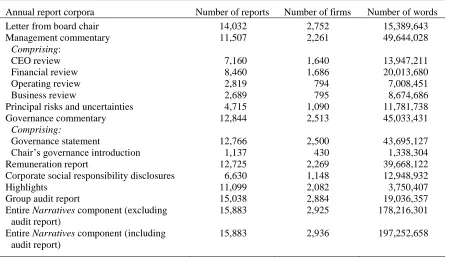
The second data resource is a set of annual report corpora designed to support corpus-based approaches to studying financial report narratives (Hardie, 2015). Using the subsample of 15,883 reports processed using the table of contents, we pool text from the kth annual report section across all reports containing section k, where k is equal to the following generic categories: letter from the board chair, business review, CEO review, finance director review, operating and financial review, governance statement, remuneration report, risk report, corporate social responsibility disclosures, and the group audit report. (We also pool business reviews, CEO reviews, finance director reviews, and operating and financial reviews into a single management commentary category.) The K section corpora are available at <doi> for further analysis. Summary details for the corpora are presented in Table 6 and further details regarding corpus construction are provided on the appendix.
6. Extension to non-English language and reporting regime
This section provides evidence on the generalizability of our retrieval and classification procedure to non-English language annual reports published in regulatory settings other than the U.K. (See the appendix for more detailed guidelines.) We select Portuguese annual reports for because the authors have good knowledge of the Portuguese language and reporting
environment, Portuguese is a structurally different language to English and therefore presents
25 The dataset is revised on an annual basis. Old versions of the dataset are archived on GitHub. See appendix for
31
new linguistic challenges that help shed additional light on the robustness of our method, and the Portuguese regulatory environment governing annual reports differs significantly from the U.K. PDF reports published in Portuguese by firms listed on Euronext Lisbon are retrieved from Perfect Information for calendar years 2006 through 2015. The final sample of consists of 606 digital PDF reports for 77 firms (ranging from 64 firms in 2011 to 38 firms in 2015).
While much of our retrieval and classification procedure is independent of language and reporting regime, key elements rely on domain-specific gold standard wordlists and detailed knowledge of local reporting norms and therefore manual intervention is unavoidable. The two areas where manual intervention is required are: (a) constructing the list of section headers used to identify the report table of contents; and (b) developing new synonym lists that serve as inputs to our section classification algorithms.
We create the gold standard list of section headers for Portuguese annual reports by extracting all section titles from the contents table of 67 reports selected at random. The initial set contains 2,053 headers, which collapses to 694 after screening for duplicates and extraction errors. The resulting list contains multiple synonyms for the same section.26 For example, our list contains 12 different titles for chair’s letter to shareholders and 35 versions for the auditor’s report. The complete list of synonyms is included in the appendix.
Synonym lists used as inputs to our section classification algorithm are constructed using the same approach as described in section 3. We start by reviewing Portuguese reporting rules and practices to determine a set of core sections that appear in the Narratives component of the representative report. We identify the following generic sections: chair’s letter, CEO review, and performance commentary. All Narratives sections not classified into one of these three generic
26 We retain commas and hyphens which leads us to treat two otherwise identical headers.as distinct elements of a
32
categories are allocated to a residual catch-all category (other). (Generic sections identified for the Financials component are audit report and financial statements.) We also identify
performance commentary as the section that most frequently delineates the Narratives
component of the annual report from the Financials component. (The equivalent to Figure 1 for Portuguese reports is presented in the appendix.) Next we run our retrieval algorithm over all reports to recover a comprehensive list of section headers from the tables of contents and then review the list manually to construct final synonym lists for our three generic Narratives
categories. These lists are used as inputs to our classification algorithm that compares section headers in the table of contents with elements from the synonym lists. (Character string comparisons are performed after removing all spacing and punctuation from both table of contents headers and elements in the synonym lists.) Synonym lists are refined through several iterations where classified sections are reviewed manually to identify and fix errors.
Our procedure processed 396 reports via the table of contents, representing 65% of the 606 documents in the initial sample. Further analysis reveals that problems detecting or reading the table of contents are the primary reason why reports are not processed. (The majority of such reports can be processed using bookmark-based extraction.) Specifically, 62 reports do not contain a table of contents; 52 reports contain a table of contents that is not detected; 45 reports contain a table of contents that is unreadable due to unconventional formatting; 39 reports’ table of contents do not contain page numbers; and 12 reports contains a table of contents spread over two or more pages.
33
similar to those presented in Table 1 for U.K. reports. Panel A presents error rates relating to section identification. The overall accuracy rate as indicated by the F1 score is 95.9%, compared with 96.5% reported for U.K. annual reports in Table 1. Our procedure correctly identifies 2,628 of the 2,682 actual sections in the 100 reports analysed, equating to a recall rate of 98%. The precision rate, although lower at 94% (169 type I errors), is nevertheless respectable in absolute terms. Results are broadly identical if we focus exclusively on the Narrative report component. Page number synchronization rates reported in Panel B and document classification rates reported in Panel C are above 95% in all cases with the exception of performance commentary classification (94.7%). These rates are also consistent with results reported for U.K. annual reports in Table 1. Collectively, these findings confirm that the retrieval and classification method developed for U.K. annual reports is generalizable to non-English language annual reports published in regulatory settings other than the U.K.
7. Summary and conclusions
We develop, describe and evaluate a procedure for automatically retrieving and analyzing textual content in digital PDF annual report files. Extant large-sample research examining annual report content is confined primarily to 10-K filings prepared by U.S. registrants (El-Haj et al. 2019). However, most firms also publish an unstructured, glossy annual report containing additional disclosures and graphics. These documents are typically distributed as PDF files and represent the normal annual reporting method outside the U.S.
34
bookmarks added by the PDF originator for reports where a valid table of contents cannot be identified. Our method retains information on document structure, facilitating delineation between narrative and financial statement components of reports, and between individual sections in the narratives component.
Manual and large-sample validity tests confirm the procedure provides a reliable means of capturing and classifying unstructured narrative disclosures. While the method is implemented using U.K. reports published in English, tests on Portuguese reports confirm that the procedure is generalizable to annual reports published in other languages and regulatory environments. The tool is available for researchers to use. At the date of publication, a dataset of text properties for over 26,000 annual reports published by 4,131 LSE-listed financial and non-financial firms between 2002 and 2017 is also available, together with a suite of annual report corpora derived from almost 16,000 reports.
An important limitation of our method that is mirrored in the large-sample text processing literature more generally is the failure to capture important aspects of disclosure format. The IASB’s disclosure initiative outlines the features of effective communication, which
35
References
Athanasakou, V., M. El-Haj, P. Rayson, M. Walker and S. Young (2019). Large sample evidence on the properties and impact of strategic commentary in annual reports. Available at:
http://ssrn.com/abstract=3212854
Bloomfield, R. (2008). Discussion of ‘‘Annual report readability, current earnings, and earnings persistence”. Journal of Accounting and Economics 45: 248– 252
Campbell, J. Chen, H., Dhaliwal, D., Lu, H., Steele, L. (2013). The information content of mandatory risk factor disclosures in corporate filings. Review of Accounting Studies 19(1): 396-455
CFA Society U.K. (2016). CFA UK annual survey on Financial Reporting and Analysis. Available at: https://secure.cfauk.org/assets/1345/Analysis_of_FRAC_survey_2015.pdf Clatworthy, M. and M. Jones, 2006. Differential patterns of textual characteristics and company
performance in the chairman's statement. Accounting, Auditing and Accountability Journal 19 (4): 493-511
Dikolli, S., T. Keusch, W. Mayew and T. Steffen (2017). Using shareholder letters to measure CEO integrity. Available at SSRN: http://ssrn.com/abstract=2131476
Dyer, T., M. Lang and L. Stice-Lawrence (2017). The evolution of 10-K textual disclosure: Evidence from Latent Dirichlet Allocation. Journal of Accounting and Economics 64: 221-245
El-Haj, M., P. Rayson, V. Simaki, M. Walker and S. Young (2019). In search of meaning:
Lessons, resources and next steps for computational analysis of financial discourse. Journal of Business Finance and Accounting forthcoming
EY (2015). Annual Reporting in 2014: Reflections on the Past, Direction for the Future. Available at:
http://www.ey.com/Publication/vwLUAssets/EY_-
_Annual_reporting_in_2014_reflections_on_the_past_direction_for_the_future/$FILE/EY-Annual-reporting-in-2014.pdf
Financial Reporting Council (2012). Thinking About Disclosures in a Broader Context: A Road Map for a Disclosure Framework. London: FRC Publications. Available at:
36
Financial Reporting Council (2014). Guidance on the Strategic Report. London: FRC
Publications. Available at: https://www.frc.org.uk/Our-Work/Publications/Accounting-and-Reporting-Policy/Guidance-on-the-Strategic-Report.pdf
Gunning, R. (1968). The Technique of Clear Writing. McGraw-Hill
Grüning, M. (2011). Artificial intelligence measurement of disclosure (AIMD). European Accounting Review 20(3): 485–519
Hardie, A. (2015). Corpus linguistics. In: The Routledge Handbook of Linguistics: 502-515. London: Routledge.
Henry, E. (2006). Market Reaction to verbal components of earnings press releases: Event study using a predictive algorithm. Journal of Emerging Technologies in Accounting 3: 1-19 Henry, E. (2008). Are investors influenced by how earnings press releases are written? Journal
of Business Communication 45(4): 363-40
Henry, E. and A. Leone (2016). Measuring qualitative information in capital markets research: Comparison of alternative methodologies to measure disclosure tone. The Accounting Review
91(1): 153-178
Hooghiemstra, Y. F. Kuang and B. Qin (2017). Does obfuscating excessive CEO pay work? The influence of remuneration report readability on say-on-pay votes. Accounting and Business Research 47(6): 695-729
Institute of Chartered Secretaries and Administrators (2015). Guidance note Contents List for the Annual Report of a UK Company. London, ICSA. Available at:
https://www.icsa.org.uk/assets/files/free-guidance-notes/contents-list-for-the-annual-report-of-a-uk-company.pdf
International Accounting Standards Board (2017a). Exposure Draft: Improvements to IFRS 8 Operating Segments (Amendments to IFRS 6 and IAS 34). IFRS Foundation. Available at:
https://www.ifrs.org/-/media/project/improvements-to-ifrs-8-operating-segments/exposure-draft/published-documents/ed-proposed-amendments-ifrs8-ias34.pdf
International Accounting Standards Board (2017b). Disclosure Initiative - Principles of
Disclosure (Discussion Paper DP/2017/1). March 2017. International Accounting Standards Board: London