Cross-Device Taxonomy:
Survey, Opportunities and Challenges of
Interactions Spanning Across Multiple Devices
Frederik Brudy
University College London
London, United Kingdom
[email protected]
Christian Holz
Microsoft Research
Redmond, WA, USA
[email protected]
Roman Rädle
Aarhus University
Aarhus, Denmark
[email protected]
Chi-Jui Wu
Lancaster University
Lancaster, United Kingdom
[email protected]
Steven Houben
Lancaster University
Lancaster, United Kingdom
[email protected]
Clemens Nylandsted Klokmose
Aarhus University
Aarhus, Denmark
[email protected]
Nicolai Marquardt
University College London
London, United Kingdom
[email protected]
ABSTRACT
Designing interfaces or applications that move beyond the
bounds of a single device screen enables new ways to
en-gage with digital content. Research addressing the
opportu-nities and challenges of interactions with multiple devices
in concert is of continued focus in HCI research. To inform
the future research agenda of this field, we contribute an
analysis and taxonomy of a corpus of 510 papers in the
cross-device computing
domain. For both new and experienced
researchers in the field we provide: an overview, historic
trends and unified terminology of cross-device research;
dis-cussion of major and under-explored application areas;
map-ping of enabling technologies; synthesis of key interaction
techniques spanning across multiple devices; and review of
common evaluation strategies. We close with a discussion of
open issues. Our taxonomy aims to create a unified
termi-nology and common understanding for researchers in order
to facilitate and stimulate future cross-device research.
Permission to make digital or hard copies of all or part of this work for personal or classroom use is granted without fee provided that copies are not made or distributed for profit or commercial advantage and that copies bear this notice and the full citation on the first page. Copyrights for components of this work owned by others than the author(s) must be honored. Abstracting with credit is permitted. To copy otherwise, or republish, to post on servers or to redistribute to lists, requires prior specific permission and/or a fee. Request permissions from [email protected]. CHI 2019, May 4–9, 2019, Glasgow, Scotland UK
© 2019 Copyright held by the owner/author(s). Publication rights licensed to ACM.
ACM ISBN 978-1-4503-5970-2/19/05...$15.00 https://doi.org/10.1145/3290605.3300792
CCS CONCEPTS
•
Human-centered computing
→
HCI theory, concepts
and models
;
Ubiquitous and mobile computing systems
and tools
;
Interaction paradigms
;
Ubiquitous and mobile
com-puting design and evaluation methods
.
KEYWORDS
Cross-device interaction; cross-device computing; survey;
multi-device; taxonomy; cross-surface; distributed user
in-terfaces
ACM Reference Format:
Frederik Brudy, Christian Holz, Roman Rädle, Chi-Jui Wu, Steven
Houben, Clemens Nylandsted Klokmose, and Nicolai Marquardt.
2019. Cross-Device Taxonomy: Survey, Opportunities and
Chal-lenges of Interactions Spanning Across Multiple Devices. In
CHI
Conference on Human Factors in Computing Systems Proceedings
(CHI 2019), May 4–9, 2019, Glasgow, Scotland UK.
ACM, New York,
NY, USA, 28 pages. https://doi.org/10.1145/3290605.3300792
1
INTRODUCTION
The way we interact with computers has fundamentally
changed in the last 30 years. Never in the history of
com-puting did we have access to so many powerful comcom-puting
devices with different forms factors, affordances,
functional-ities, and technical capabilities [250]. Since Weiser’s seminal
paper [355] on
Ubiquitous Computing
, we have seen an
ex-plosion of research into these device form factors to envision
new interaction paradigms that transcend the individual
device and user. From early
smart-space
to
multi-display
,
distributed surface
, and
multi-device
; to
cross-display
,
understanding of people’s interactions with various device
configurations
and
ecologies
is at the forefront of modern
Human-Computer Interaction (HCI) research [17, 26, 83, 107,
168, 273, 285].
However, this explosion of research topics has led to
dis-connected
terminology
,
techniques
, and
systems
creating a
fragmented
research landscape. In this paper, we unify this
fragmented research under the umbrella of
cross-device
computing
. To inform future research, we analysed 510
pa-pers in the cross-device interaction domain to synthesise the
state of the field. Based on our analysis of terminology,
ap-plications, systems, techniques, and evaluations, we present
a unified taxonomy and overview of the state of the art. We
discuss open issues and challenges in the cross-device
do-main, and outline an agenda for future research in the space
of cross-device interaction.
The goal of this taxonomy is to contribute a general
work-ing- and discussion-ground for the wider area of HCI. We
provide newcomers to cross-device research with a starting
point, but also create a common ground for discussions with
current researchers in the field and to allow for a time of
reflection within the cross-device community. This work
di-rectly incorporates and extends earlier taxonomies of
multi-device research
. Our taxonomy spans across the research
areas of distributed user interfaces [76, 86], second-screen
and multi-device research [229], and mobile multi-device
ecosystems [111]. We build upon other related taxonomies
(all with their own specialised focus): for example, covering
the scale of multi-display systems [330], display switching
for multi-displays [275], interaction techniques for
sponta-neous device association [62], or characteristics of devices’
ownership, access, and distance [292]. Our goal is to unify the
terminology and strategies in the cross-device space,
extend-ing the scope of earlier taxonomies. In particular, we focus on
themes around
interactions
within cross-device settings. We
cover relevant technical aspects (e.g. tracking systems and
evaluation strategies for cross-device interactions), but other
engineering aspects are outside of the scope of this
taxon-omy, for example cross-device architectures or development
frameworks (an overview is available in [149]).
In summary, our paper contributes: (1) a unified
taxon-omy and terminology for cross-device research; (2) the
map-ping and reflective discussion of the current design space
(across application domains, tracking systems, interaction
techniques, and evaluation strategies); and (3) the
identifi-cation of opportunities and challenges informing a future
research agenda of cross-device computing. Our data and the
complete tagging tool are released as open-source
1, and we
invite the research community to contribute to the collection
and to extend the taxonomy.
1https://github.com/frederikbrudy/cross-device-taxonomy
2
METHODOLOGY
Creating Corpus of Relevant Publications:
In order to
create the collection of papers for this analysis, we
con-ducted a systematic search in the ACM Digital Library (May
2018). Our search terms included all possible combinations of
cross-
and
multi-
with each of
device
,
surface
,
monitor
and
display
; and
distributed user interfaces
as well
as acronyms. By looking at references within our corpus
as well as using our own expertise of the cross-device
re-search domain, we identified an additional 48 articles that
were missing from the search results (which is a common
strategy for survey and taxonomy papers, e.g. [111, 184]).
After merging duplicates, our selection comprised a set of
738 papers.
Filtering and Inclusion Criteria:
Papers had to be
con-cerned with interaction tasks or techniques, tracking
tech-nology for people and/or devices, or technologies involving
multiple devices. We excluded papers without a contribution
(e.g. proceedings front matter, keynotes, workshop calls for
participation) or short contributions with a full paper
follow-up. Our resulting corpus included 510 tagged papers in total,
which are incorporated in our taxonomy.
Tagging:
We iteratively developed the tagging categories
for our taxonomy (through both top-down specification of
categories and bottom-up trial-tagging). Final tagging
cate-gories included: contributions, application areas, interaction
technique details, deployments, evaluation techniques,
defi-nitions, technological aspects, and several further fields. We
tagged all 510 papers with a custom-built web-based
paper-tagging system. The front-end includes forms for paper-tagging and
annotation, pre-set tags, free text fields, and auto completion.
During tagging we frequently discussed emerging patterns,
revisited tagging schemes, and iterated on previously
re-viewed papers. The final tagging dataset was cleaned up (e.g.
filling missing tags, correcting misspellings, and merging
identical tags) and exported as JSON for analysis.
Analysis:
We primarily analysed three data collections:
Cross-device | Multi-device | Distributed
Cross-surface | Multi-surface | Trans-surface
Cross-display | Multi-display
Multi-monitor/screen Multi-slate/tablet
Dual-display/monitor
includes: Large surfaces Digital walls Interactive Whiteboards Tabletops Projectors Television sets
includes:
•Tangibles
•IoT Devices
•Wearables
•AR/VR headsets
•Smart glasses
•Other networked devices
includes: Smart-phones includes: two
displays/monitors. Focus on
>=2 static monitors.
Usually local connection,
single master device Often with local or remote serverdistributed systems,
includes: Tablets E-readers
+
USUAL FOCUSInteractions | Collaboration Interaction techniques, interfaces, collaboration (User) Interfaces User interface design, techniques, adaptive interfaces Applications | Systems Concrete use-case applications
Platform | Middleware Technology, middleware, development Environments | Ecologies Larger setups or deployments
Computing General research area
Tracking (see Table 2):
often inside-out Tracking (see Table 2): often outside-in
e.g.: Cross-device e.g.: Interactions
Usually static setups, no location tracking
a
d
c
b
e
f
[112, 228, 342] [52, 53, 114, 116, 263, 366]
In particular:
Multi-display Environments (MDE)
[39, 70, 82, 92, 110, 197, 227, 272, 289, 305, 352] [63, 166]
[135, 142, 144] [102, 120, 209, 301, 306, 309, 357]
[89] [58, 116, 136, 141, 142, 159, 204, 206,
230, 231, 232, 233, 270, 271, 312, 373] [16, 24, 31, 103, 111, 187, 229, 245, 278, 279, 290, 304, 376] [13, 76, 77, 86, 200, 215, 216]
Multi-mobile[121, 169]
Earliest papers: MEMEX [35], Multi-display [201, 202]
Cross-device
\cite{Hamilton2014, Chi2015, Marquardt2018a, Marquardt2012, Nebeling2015a, Nebeling2016a, Homaeian2018, Houben2015a, Radle2015, Yang2014, Simeone2013, Jin2015a, Houben2017}
Multi-device
\cite{Grubert2016, Zagermann2017, Baur2012, Biehl2006a, Brudy2018, Goel2014, Li2012, Neate2017, Rekimoto1997, Rekimoto1998, Seyed2015, Santosa2013, OLeary2017}
Distributed
\cite{Elmqvist2011, Melchior2009, Melchior2011a, Bardram2012, Demeure2005, Dey2001, Manca2016}
Cross-surface
\cite{ Houben2017, Houben2015, Homaeian2017}
Multi-surface
\cite{ Wigdor2009, MartinezMaldonado2016, Gjerlufsen2011, Chokshi2014, Scott2014, Hartmann2013, Seyed2013a, ShakeriHosseinAbad2014}
Trans surface \cite{ Fei2013a}
Cross-display
\cite{Jokela2016, Nacenta2009, Chung2018}
Multi-display
\cite{Chung2014, Forlines2006, Forlines2008, Grubert2017, Heikkinen2014, Lander2015, Nacenta2005, Nacenta2007, Rashid2012, Schneegass2014, vandeCamp2013a, Wallace2009}
MDE
\cite{ Cauchard2011a, Dang2014, Dostal2013a, Forlines2008,
GonzaloRamos2009, Grubert2017, Mahyar2016, Nacenta2006, Sakurai2008, Seyed2012, Wallace2008}
Multi-monitor
\cite{ Grudin2001, Neate2015, Vatavu2014}
Multi-slate
\cite{ Chen2012, Chen2013, Hamilton2014, Plank2017, Wozniak2016}
Multi-mobile
\cite{ Hasan2015, Kim2017a}
Earliest papers: MEMEX \cite{ Bush1945}, Multi-display \cite{ Mano1981, Mano1982}
includes:
•Tangibles \cite{Valdes2014} •IoT Devices
•Wearables •AR/VR headsets
•Smart glasses \cite{Grubert2015}
[64, 91, 92, 110, 124, 183, 223, 226, 276, 295, 339, 353]
Figure 1: Ontology of cross-device research terminology.
Scale of Survey:
The goal of our taxonomy was a
compre-hensive analysis of the cross-device design space, though at
the same time we carefully selected references to avoid
over-long lists of references or tables that are difficult to read. We
prioritised seminal publications, earlier work and first
contri-butions, and frequently cited papers – but also included other
relevant work. We acknowledge that our references are not
an exhaustive listing of every paper in cross-device research,
but a representative and curated subset most relevant for
this taxonomy.
Open Data:
Our complete dataset and tagging system are
released as open source
2. We invite other researchers to
contribute to this corpus of data, suggest new tags and
cate-gories, and join a discussion about cross-device computing.
3
HISTORY AND UNIFYING TERMINOLOGY
In this section, we synthesise related work to build a unified
understanding of the domain of cross-device computing. The
goal is to weave together the related but disparate threads of
research – often described with diverse terminology – into
2https://github.com/frederikbrudy/cross-device-taxonomy
one taxonomy that helps to inform and guide current and
future researchers in this area.
Three Areas of Cross-Device Research
We begin by unpacking a brief history of the earliest work in
the area, and by highlighting the main trends over time. We
distill this work into three key areas of cross-device work: (1)
early work on multi-monitor workstations, (2) emergence of
multi-display/surface environments, and (3) the increasingly
mobile, ad hoc cross-device use.
Area 1: Multi-Monitor Workstations.
One of the
ear-liest visions for a personal workstation, the Memex [35],
featured a setup consisting of multiple monitors, two for
dis-play and one for pen input. Early work included in our survey
covers multi-screen systems [201, 202] from as early as 1981,
where the effect of having four monitors at a workstation
was studied. Wellner [356] took this notion further with
Dig-italDesk
. Similar – albeit later – work includes Grudin’s [112]
work on peripheral awareness in multi-monitor use, and the
advantages of spreading information across connected, but
distinct, output screens. Prior work has extensively studied
multi-screen setups [82, 153, 225, 276, 290].
Area 2: Multi-Device Environments and Spaces.
Weiser’s
“The Computer for the 21st Century”
[355] inspired
research on computing that went beyond the single user at
a single computer. Notably, Rekimoto’s work from the late
90s [278, 281] explored interaction techniques that crossed
device boundaries, after Fitzmaurice introduced the notion
of spatially aware palmtop devices a few years earlier [90].
Around the same time, research on
large interactive spaces
started to appear, with seminal work like i-LAND [324].
Di-verse
multi-display environments
emerged, enabling
interac-tions that spread across landscapes of devices: digital
wall-displays, tabletops, and tablets (e.g. [18, 39, 91, 110, 138, 205,
227, 305, 352, 357]).
Area 3: Ad hoc, Mobile Cross-Device Use.
Different from
fixed spaces and ecologies, the third area of cross-device
work focuses on mobile and flexible ad hoc cross-device
se-tups. Enabled by ubiquitous availability of smartphones and
tablets, this research strives towards individual or
collabora-tive applications spanning across portable devices,
provid-ing a digital information space to support the task at hand
[11, 31, 52–54, 109, 111, 128, 129, 204, 206, 270, 272, 280, 362].
Ad hoc portable setups lead to new challenges for
technol-ogy, tracking, and field studies, as we explain in more depth
shortly.
Towards Unified Terminology
Synchronous
(Simultaneous use)
Mirrored
Second screen
Asynchronous
(Sequential use)
vs.
iOS Android
Migratory interfaces
Description: adaptive interfaces that are capable to migrate between multiple devices (in particular, different form factors).
Related taxonomy: Reference model [76]
Key terms:
§Migratory interfaces [19, 20]
§Application migration [100, 341]
§Adaptive interfaces [257]
§Model-based approach [200]
§Component migration [101]
§Continuity [273, 318]
§Plasticity [76, 86]
§Multi-target interfaces [86]
§Device shifting [56]
Cross-platform
Description: development of interfaces that run on different device form factors and operating system platforms.
Key terms:
§Cross-platform, multi-platform, cross-modal [221, 248, 336]
§Adaptive interfaces [21]
§Consistency across devices [221]
§Liquid software [95, 96]
Description: focus on TV + device
Related taxonomy: [229]
Key terms:
§Second screen [1, 85]
[image:4.612.51.558.93.393.2]§Companion app [84, 85]
§Cross-media [229]
§Actual use [132]
A A
1 2
3
Distributed UI
Logical distribution Spatial distribution
Description: logical distribution of distinct UIs or elements across a number of devices.
Related taxonomy: [86]
Key terms:
§Distributed, seamless, continuous UI [64, 143, 174, 271]
§Multiple coordinated/synchronized views [91, 263, 276, 322]
§Federated UI [52, 206]
§Divisible UI [154]
§Interface beaming [141, 227]
§Joint Interactions [28, 54]
§Extending application’s UI [261]
Description: spatial distribution of the continuous visible area of one screen across a number of devices.
Related taxonomies: [276, 292, 330]
Key terms:
§Extended, connected screens [109, 192, 276, 297]
§Annexing [127, 373]
§Display Contiguity [276]
§Spatial awareness; peephole navigation [90, 193, 270]
§Perspective aware UI [226, 227]
§Stitching views [7]
Description: mirroring the exact same content on multiple screens/displays.
Key terms:
§Cloned [276]
§Screen casting [214, 240]
§Screen sharing [302]
§Mirroring [213, 214]
Temporal
1
Configuration
2
Relationship
3
Scale
4
Dynamics
5
1…1 1…m 1…1 x 1…1 n…m
Near Personal Social Public
Ad-hoc, Mobile Semi-fixed Fixed
wearables, on or
close to body person’s reachwithin a group spaceslarger areas, rooms or building scale
And: possible fluid transitions between (hybrid) Multiple devices (m >= 2)
Single user Multiple users (n >= 2), collaboration
Related to:
•Device/space taxonomy [330]
•Hall’s proxemic zones [115]
•Tab/Pad/Yard [355]
6
SpaceCo-located Remote
Majority of cross-device research is in co-located spaces.
Related taxonomies and surveys: [86, 111, 142, 229, 256, 276, 292, 330]
Examples: [13, 174]
Related taxonomies and surveys:[76, 86]
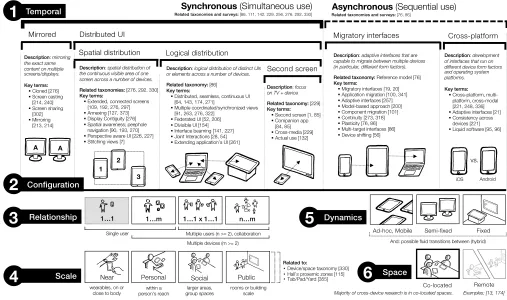
Figure 2: Taxonomy of cross-device design space dimensions: temporal, configuration, relationship, scale, dynamics and space.
identical research areas. At other times, it is the other way
round, when identical terms in fact refer to different areas
of research. We untangle the diverse terminology of
cross-device work and map terms out into a single ontology in
Figure 1. The main goal of this synthesis is to provide better
guidance about scope and specialisations of research within
our field. The unified ontology is formed of two parts of key
terms used to refer to cross-device literature:
•
The
top part
of Figure 1 categorises key terms of
cross-device sub disciplines. The nested categories begin
at the bottom with
dual-display
and
multi-monitor
work (1a), extend to work with
multiple mobile
de-vices, tablets or slates
(1b), further to the category of
cross/multi-display
(1c) and
cross/multi/trans-surfaces
(1d), and finally to
cross/multi-device
and
distributed
covering the broadest scope (1e). The nested structure
in the figure indicates focus areas associated with each
term as well as the often included device form factors.
It is important to note that a large subset of the terms
are used interchangeably.
•
The
bottom part
of Figure 1 includes a list of terms
indicating focus areas of research projects (1f):
inter-actions and collaboration; interfaces; applications or
systems; platform or middleware; environments or
ecologies; and computing. We annotated these terms
with the most common research focus of papers using
each term.
How to use the ontology:
For anyone entering the field it
clarifies terminology used, while at the same time highlights
that some terms are used interchangeably. For current
re-searchers framing their work, it can help to identify the best
terms to describe the work. And within the cross-device
com-munity, the ontology can provoke reflection on the use and
appropriateness of terminology.
4
TAXONOMY OF KEY CHARACTERISTICS
In this section, we dive deeper into our derived taxonomy of
key characteristics of the cross-device design space. In
par-ticular, our taxonomy in Figure 2 is a fine-grained synthesis
of the disparate but interwoven threads of the research field.
We explain the six key dimensions and discuss how to use
this taxonomy as a lens to look at existing or inform new
-research.
Dimension 1: Temporal.
Cross-device work can be
clas-sified as either
synchronous
(when interactions happen at
the same time) or
asynchronous
(with a sequential flow of
Dimension 2: Configuration.
This dimension classifies
the actual setup of the cross-device system as well as its
use of input and output modalities. The main categories
within
synchronous
use are
mirrored
and
distributed user
in-terfaces
. Most active research is done within the distributed
UI category, investigating the
spatial
and
logical distribution
of interfaces. The
asynchronous
work is divided across two
categories: interfaces that allow
migration
across devices,
and
cross-platform
research to make applications run
consis-tently across diverse operating systems. Related taxonomies
align with this dimension, in particular Elmqvist’s taxonomy
of distributed UIs [86] and Rashid’s focus on multi-device
attention switching [276].
Dimension 3: Relationship.
Research addresses
differ-ent people-to-device relationships. While one person
inter-acting with a single device (
1..1
) is usually not part of
cross-device work, one person interacting with two or more cross-devices
(
1..m
) covers work on cross-device workstations.
Collabo-rative settings fall mostly in two categories: group
activi-ties where each person primarily uses a single device (
1..1 x
1..1
), and collaborative settings with n-people and m-devices
(
n..m
). Examples of the last two categories relate closely to
research and studies done in the CSCW community.
Dimension 4: Scale.
Interactions can vary across the
di-mension of scale: from near, to personal, social, and public
rooms or buildings. Edward Hall’s
proxemics
is a commonly
used anthropological lens for the scale of interactions [115],
which was later operationalised for cross-device work as
proxemic interactions
[12, 107, 205].
Scale
dimension relates
closely to Terrenghi’s taxonomy of display ecosystems across
scale [330] and the progression of Weiser’s Tab/Pad/Yard
computing [355].
Dimension 5: Dynamics.
Dynamics can vary between
se-tups, and the categories of
ad hoc/mobile
,
semi-fixed
, and
fixed
spaces closely relate to the phases of cross-device research
we introduced earlier. Fixed spaces often include larger-scale
wall displays and tabletops, while semi-fixed spaces allow a
certain degree of reconfigurability, and ad hoc/mobile spaces
focus on portable devices, allowing dynamic changes and
re-configuration.
Dimension 6: Space.
The last dimension differentiates
be-tween co-located and remote interactions (and corresponds
to Johnson’s CSCW matrix [162]). The large majority of
cross-device work covers co-located scenarios, but few examples
address the challenges of providing cross-device interactions
across remotely distributed locations [13, 174].
Note
: research projects do not necessarily have to fall into
one single category. Instead, it is common that projects
ad-dress different areas across this design space. Furthermore,
research might follow lateral transitions, where the scope of
the research shifts over time across any of these dimensions.
How to use this taxonomy:
This taxonomy has different
functions helping researchers: (1) it compresses the large
research field and synthesises seminal work to ease entry into
an unfamiliar research domain, (2) the specific dimensions
(and subcategories) can support framing and scoping of new
and ongoing research, and (3) it allows discussing research
in the context of the major related categories within the
six dimensions. This taxonomy works in conjunction with
the analysis across applications (starting in the next section),
technology, interaction techniques, and evaluation strategies.
Knowledge work (62)
→Project management: task management [265], productivity [356], project management [13], ad-hoc sharing of resources [252], job scheduling [353] →Presenting: presentation software [379],
proxemic-aware presenter [205], multi-display environment [201]
→Searching: search [283], finding information [90]
→Browsing: cross-screen browsing [164]
→Other examples: note-taking[246], scientific work [148], activity-aware computing [140], police analyst station [4]
Games and Installations (31)
→Museum experiences: museum activities and simulations [194], museum guide and artwork [93], spatial music experience [205]
→Playing and dancing: interactive dance club and music creation [10], proxemic-aware pong [205], snake game [147], Where's Waldo game [156], tower defense game [147], multi-device AR game [332], VR storyboard creation [125]
→Guides: city guide [291], tourist guide [119], conference guide [334], exploring neighborhood [178]
→Businesses:retail [266], restaurant menu [80]
Home Computing (61)
→Creativity: drawing [278], photo sorting [218], comic strips and collage [24], scrapbook [236]
→Media consumption: mixed-reality TV [9], TV access [208], active reading [52]
→Planning: travel planning [113], calendar [294], online shopping [100]
→Smart environments: child monitor [131], smart kitchen [145], IoT coffee machine [199]
→Other examples: garden [36], polling [254], advertising [11]
Collaboration(21)
→Mediating discussions: brainstorming and discussions [329], meeting room [105], interactive brainstorming [203], voting system [182]
→Content creation: creative collaborative work [324], collaborative synthetic bio-design [108], collaborative writing [174]
→Planning:emergency response planning [59], university campus planning [44]
→Other examples: collaborative browsing [146], collaborative cognitive walkthrough [361], scientific collaboration [148], collaborative data visualization [7] Data Exploration (39)
→Medical data:3D medical data [66], brain scans [102], synthetic bio-design rules [108]
→Scientific visualization: molecular visualization [92], astrophysics [357]
→Spatial data: terrain analysis [249], geospatial disease data [210], oil and gas [306], city maps [46], interior rendering and design [319]
→Financial data: financial computing [204]
→Other data exploration: scatter plot [322], learning about dataset [296]
Education(15)
→Learning and educational games: games for training math [71], simulated classroom distributed applications [345], learning task for children [29], games for training memory [71], biology simulation [195]
→Presenting and critique: class presentation [117], critique student writing [163], electronic blackboards [37]
→Managing classroom activities: classroom capture [344], classroom polling [262], collaborative financial activity in groups [179]
Mobile Computing (33)
→Public displays and advertisements:
communicating with public displays [97], interaction with display at a distance [28], tracking engagement with public displays [167], bus stop display [326], airport public display [326]
→Sharing information: business card sharing [371], scanning tangibles [71], data transfer on the fly [177], ad-hoc connection [280]
→Input redirection: UI distribution [154], content distribution across keyboard and display [170], mouse cursor operations [350], secure entry on public display [371]
→Other examples: extending screen space [297], authentication [130, 133, 134]
Health(7)
→Patient management: physician mobiles [3], patient registration [363]
→Surgery management: medical surgery and operations [87], medical operating room [217]
→For patients: monitoring physical activity for diabetes treatment [172], memory game for elderly [72] Software Development (6)
→UI design: UI design [313], GUI builder [219], multi-user interface design [221]
[image:5.612.318.562.234.567.2]→Debugging and programming: cross-device development [233], debugging cross-device [150], Java applications [155]
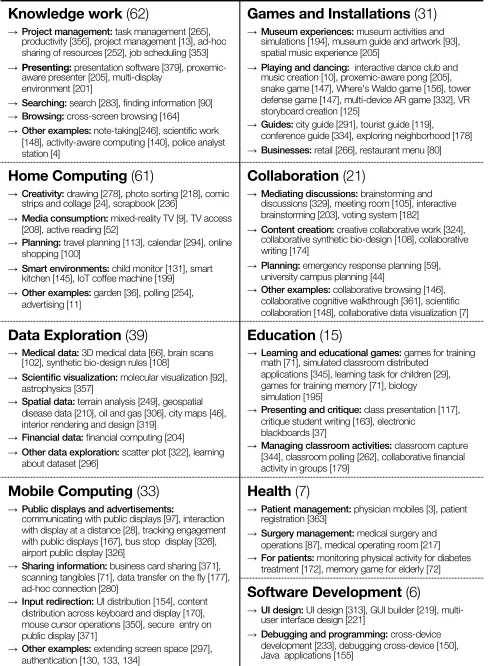
Table 1: Cross-device application domains: Nine application
categories (and sub categories) with examples use cases.
5
APPLICATION DOMAINS
Our survey revealed a range of different application
do-mains for cross-device computing. Although only 63/510
pa-pers were tagged as making an ‘
application
’ contribution,
computing
, (iii)
data exploration
, (iv)
mobile
comput-ing
, (v)
games/ installations
, (vi)
collaboration
, (vii)
ed-ucation
, (viii)
health
, and (ix)
software development
(Ta-ble 1).
The largest category of applications focuses on knowledge
work with 62 papers. Typical knowledge work is information
management across various displays and devices [90, 201,
283], sharing information and resources across devices [164,
252], multi-device activity and task management [13, 140,
265, 353], or productivity and creativity tasks [148, 205, 246,
356, 379]. Other domains include police analyst
worksta-tions [4], industrial facilities [180], aviation cockpits [88],
and collaboration between aerospace scientists and
engi-neers [148].
Starting in the year 2000, we see a growing interest in
applying cross-device interaction to data exploration.
Infor-mation visualisation leveraging mobile devices including
tablets and smartphones has called for new interaction
vo-cabulary [18, 138, 171, 322]. In particular, Horak et al. [138]
described interaction concepts for a smartwatch-display
con-figuration in a crime analysis scenario using a real city
crim-inal dataset. Other kinds of data sets that has been explored
including geography [210, 249], physics [18, 315, 357], life
science [66, 92, 102, 108, 296], city planning [46, 340],
en-ergy [43, 306], and finance [204].
Education [37, 179, 365] and health [3, 87, 217, 363] have
also been popular application domains, where there has been
an emphasis on collaborative and distributed work.
Educa-tion applicaEduca-tions have primarily focused on supporting
class-room capture [344], classclass-room presentation [37, 117],
edu-cational games [29, 71, 195], and simulations of classroom
activities [163, 232, 262, 345, 365]. Kreitmayer et al. [179]
present one of the few in-the-wild studies, where they
ob-served collaborative activities in the classroom to inform the
design of a group finance management activity with a shared
tablet and large display. In the health domain there have been
a few studies in the wild, including work on exploring
pre-surgery scenarios [3], supporting patient registration [363],
and designing distributed user interface systems in surgery
practice [87, 217]. Other health applications are designed for
personal use, namely memory games [72], cognitive
train-ing [73], and physical activity monitortrain-ing [172].
6
TRACKING SYSTEMS FOR CROSS-DEVICE
INTERFACES
The cornerstone of cross-device interaction is a mechanism
for exchanging data between devices. This often requires a
tracking system that can reliably track individual devices and
(more recently) also the individuals operating these devices.
Various tracking systems have distinct qualities. For example,
spatial resolution (3D position in space vs. distances between
devices), degree of instrumentation required, or scale (e.g.
tracking devices on a table vs. in a room).
Of 510 papers in the dataset, 55 papers have a core
con-tribution that involved developing or customising a
ing system; all other papers either leveraged existing
track-ing systems, designated fixed device locations (e.g.
multi-device systems where the multi-devices are stationary), or used
non-spatial tracking systems (e.g. discovering devices that
are on the same network).
We organised all tracking-focused papers in Table 2, which
we obtained through bottom-up analysis of the tracking
char-acteristics (proximity vs. relative location vs. 2D vs. 3D) and
modalities (capacitive, inertial, acoustic, magnetic, optical,
radio). Tracking systems typically fall into one of two
cat-egories: (1)
outside-in
, which use (static) sensors in the
environment for tracking, or (2)
inside-out
, which use only
sensors built into devices and occasionally utilise signal
emit-ters in the environment. Inside-out tracking is especially
practical for mobile cross-device applications scenarios, and
Table 2 shows the dominant use of acoustic, radio, and more
recently optical signals using device cameras. This type of
tracking typically provides devices’ 2D locations or relative
adjacency configurations. Reliably tracking devices’ 3D
lo-cations with non-spatial sensors is still a major challenge
[160, 267]. In outside-in systems (depth) cameras are the
dominant technology. Despite their 3D capabilities, most of
these systems use cameras to track the 2D locations and
ori-entations of devices (see Table 2). The table also shows that
recent larger-scale capacitive area sensors are superseding
former large-surface optical sensing (e.g. as used in former
tabletops and wall screens).
Contrasting these two main categories, none of the
inside-out papers tracked
users
as part of the sensing. However,
most outside-in systems integrated this capability to also
detect user interaction above and around the devices.
A trend we identified in tracking systems was the ambition
to work almost “out of the box”. We recognise the challenges
for future cross-device tracking systems to provide high
fidelity, reliable and accurate tracking information while
keeping user input for device discovery, calibration, and
pairing to a minimum, particularly for mobile systems. We
foresee future inside-out systems delivering more of the
capabilities of current outside-in systems, including user
and identity tracking. We also anticipate outside-in systems
increasingly sensing more of the users’ context, such as their
spatial configuration and activity.
How to use the tracking classification:
Selecting an
Modality Type Examples
acoustic
standalone Distance without cross-device synchronization [258] , motion-resistant distance calculation [378] Relative 2D positioning using custom ultrasound dongles [123, 97]
Absolute 3D positioning on unmodified mobile phones [159] , conceptual relative 3D positioning on static mobile phones [267] , [159]
user-generated Doppler-based gesture recognition between 2 phones [50] , Doppler-based multi-device selection [6] , swiping between devices on surface [103] , relative positioning from ambient sounds [327] , positioning from ambient sounds [137]
capacitive capacitive Pinch across screens to define neighbours [237] , Recognizing neighbouring devices from touch patterns through brackets [204] IMU IMU Bump devices to define neighbours [127]
magnetic magnetic Detect upper/lower device in device stacks [176] , detect magnetic field change to define neighbours [147]
optical
fiducial markers Detect configuration of devices [187] IrDA Detection of neighbouring cubes [218]
RGB camera Detects display position by searching for display content in the camera image [28] , relative positioning from inside-out tracking [67] , compare camera images across devices [74]
RF-based
Bluetooth Track users' positions around their homes using BLE positioning [132] , detects neighbour devices on 2D plane based on BLE RSSI distributions [160]
NFC / RFID NFC tags in bezel of large display allows location detection of mobile device placed on the bezel [89] , RFID tags in screens to detect neighbouring displays [241] detecting 2d position using matrix of NFC tags [119]
radio (other) Detects presence other devices (RFM) [131] , custom RF trackers integrated into phones [190] WiFi Measures distance between devices using PAHR [175]
any input Through synchronously providing (tap) input to two or more devices [280]
capacitive capacitive Tracks proximity of person with wearable device through BLE [134] , tracks wearable device through body-coupled communication on touch [134] , tracks devices' capacitive footprints on touchscreen [371] , tracks tangible and device footprints on capacitive surface [346] , capacitive markers on phone bezel for touch on large screen [374] , [371] , [346] , [374] , reads biometric data through body-coupled communication on touch [134]
optical depth camera Tracks screens in image [270] , overhead Kinect camera [206] , surrounding Kinect cameras [304] , depth camera to track mobile devices in 3d space [320] , compare device IMU with depth camera optical flow [359] , computing device orientation using a RANSAC-based plane fitter [320] , displayed codes on screens [270] , identifies tracked devices by flashing a marker on the screen [270] , QSRCT radio nodes [206] , Tracks users’ hands for above the device interaction [270] , overhead Kinect camera [269]
fiducial markers PixelSense table tracks markers attached to phones [362] , overhead camera tracks attached fiducials [281] , overhead stereo cameras and LED illuminants [8] , [362] , overhead camera [8]
marker based IR Vicon+Kinect [205] , RGB image + IR marker projection [46]
markerless IR Detects phone contact point on diffused-illumination table [293] , detects object using an overhead camera [360]
RGB camera Flashes displays and compares pixel colors in overview camera image [242] , tracks 2d position and orientation exploiting display polarization [269] , flashes temporal codes on all phones to identify pixels in one overview camera [299] , uses an overhead camera [356] , compares the head position inside two adjacent phones’ camera images [110] , determines device orientation from aspect ratio and polarization change [269] , identifies devices by marker on the screen [269]
RF-based radio (other) Uses a set of anchor notes to observe RSSI signal of mobile node [25] , every radio node has a unique ID [25]
In
si
d
e-out
t
ra
ck
ing
Proximity/distance , Relative locations (top, right, bottom, left) , Location 2D , Location 3D , Orientation , Identity , and people tracking
Ou
ts
id
e-in
t
ra
ck
in
g
2D 3D
L O ID P
D Legend:
D
2D
O 2D
3D
D
3D O I D
2D
L D
2D
L
2D L
D 2D
L
D 2D
3D
L
D
L L
2D
2D
2D 2D
L
O
2D O
2D O
2D
3D 2D
I D P
D
O 2D
I D P
O
2D
3D
P
D
O 2D
3D
L O
2D I D P
O
2D P
2D
3D
I D 2D
I D D
2D
2D 2D 2D
[image:7.612.53.558.95.371.2]3D
Table 2: Tracking characteristics and modalities of the cross-device papers with tracking as a main contribution. Our tracking
classification directly relates to surveys of tracking technologies in ubicomp [126, 137].
light-weight but lower fidelity inside-out tracking
technol-ogy. This classification shows the breadth of state-of-the-art
research of cross-device tracking technologies, including
those off-the-shelf. It serves as a reference table to help
in-form which tracking technologies might be most suitable for
a particular usage scenario.
7
INTERACTION TECHNIQUES
The fundamental method by which people use cross-device
computing is through
interaction techniques
. In our sample,
130/510 explicitly mention ‘interaction techniques’ as the
main contribution of the paper. Further in-depth analysis
reveals that another 221 papers introduce interaction
tech-niques as part of new tracking methods, applications, or
systems, totalling 351 papers that describe and use
cross-device interaction techniques.
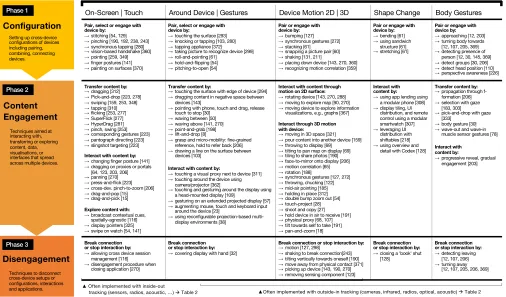
Phases of Cross-Device Interaction Techniques
We identified three phases of cross-device interaction
tech-niques (see a complete overview
3in Table 3): (Phase 1)
the
configuration phase
, (Phase 2)
the content engagement
3The table is not an exhaustive or complete list of all interaction techniques,
but a representative sample from our dataset that is exemplary for the three stages and six modalities identified in our analysis.
phase
, and (Phase 3)
the disengagement phase
. Our
analy-sis reveals that input modalities through which users perform
the interaction can be grouped into five distinct categories: (i)
on-screen
interaction, (ii)
around the device
interaction
and gestures, (iii) device
motion
, (iv)
changing the shape
of the devices, and (v) using
body gestures
.
On-Screen | Touch Around Device | Gestures Device Motion 2D | 3D Shape Change Body Gestures
Pair, select or engage with device by:
→stitching [54, 129] →pinching [190, 192, 238, 243] →synchronous tapping [280] →vision-based handshake [360] →pointing [259, 349] →finger postures [141] →painting on surfaces [370]
Pair, select or engage with device by:
→touching the surface [293] →knocking or tapping [103, 280] →tapping appliance [372] →taking picture to recognize device [299] →roll-and-pointing [61]
→hold-and-flipping [54] →pitching-to-open [54]
Pair or engage with device by: →bumping [127] →synchronous gestures [272] →stacking [61] →snapping a picture pair [60] →shaking [131, 211]
→placing down device [143, 270, 360] →recognizing motion correlation [359]
Pair or engage with device by: →bending [61] →using sandwich
structure [61] →stretching [61]
Pair or engage with device by: →approaching [12, 203] →turning body towards [12, 107, 205, 369] →detecting presence of
person [12, 30, 145, 369] →detect groups [30, 206] →detect head position [110] →perspective awareness [226]
Transfer content by: →dragging [312] →Pick-and-drop [223, 278] →swiping [159, 253, 348] →tapping [310] →flicking [253, 277] →SuperFlick [277] →HyperDrag [281] →pinch, swing [253] →corresponding gestures [223] →pantograph directing [223] →slingshot targeting [223]
Interact with content by: →changing finger posture [141] →dragging on proxies or portals
[64, 123, 203, 206] →panning [270] →press-and-flick [223] →cross-dev. pinch-to-zoom [206] →drag-and-pop [15] →drag-and-pick [15]
Explore content with: →broadcast contextual cues,
spatially-agnostic [116] →display pointers [325] →swipe on watch [54, 141]
Transfer content by:
→touching the surface with edge of device [294] →dragging content in negative space between
devices [143]
→pointing with phone, touch and drag, release touch to stop [30]
→waving between [50] →waving above [141, 270] →point-and-grab [198] →lift-and-drop [8]
→grasp and micro-mobility: fine-grained reference, hold to refer back [206] →drawing a line on the surface between
devices [103]
Interact with content by:
→touching a visual proxy next to device [311] →touching around the device using
camera/projector [362]
→touching and gesturing around the display using a head-mounted display [109]
→gesturing on an extended projected display [57] →augmenting mouse, touch and keyboard input
around the device [23]
→using reconfigurable projection-based multi-display environments [38]
Interact with content through motion on 2D surface: →rotating device [143, 270, 288] →moving to explore map [90, 270] →moving device to explore information
visualizations, e.g., graphs [367]
Interact through 3D motion with device:
→moving in 3D space [321] →pour content into another device [159] →throwing to display [69] →tilting to pan map on display [69] →tiling to share photos [190] →face-to-mirror onto display [206] →motion correlation [65] →rotation [188]
→synchronous gestures [127, 272] →throwing, chucking [122] →mid-air pointing [185] →holding in place [312] →double bump zoom out [54] →touch-project [28] →shoot and copy [27] →hold device in air to receive [191] →physical proxy [68, 107] →tilt towards self to take [191] →pan-and-zoom [18]
Interact with content by: →using app lending using
a modular phone [308] →display tiling, UI
distribution, and remote control using a modular smartwatch [307] →leveraging UI
distribution with shiftables [218] →using overview and
detail with Codex [128]
Transfer content by: →propagation through
f-formation [206] →selection with gaze
[183, 303] →pick-and-drop with gaze
[333] →body gesture [30] →wave-out and wave-in
muscle sensor gestures [78]
Interact with content by:
→progressive reveal, gradual engagement [203]
Break connection or stop interaction by: →allowing cross device session
management [116] →disengagement procedure when
closing application [270]
Break connection or stop interaction by: →covering display with hand [32]
Break connection or stop interaction by: →motion [127, 298]
→shaking to break connection[243] →tilting vertically towards oneself [190] →move away from physical contact [371] →picking up device [143, 190, 270] →removing sensing component [123]
Break connection or stop interaction by: →closing a 'book' shut
[128]
Break connection or stop interaction by: →detecting leaving
[12, 107, 206] →turning away
[12, 107, 205, 206, 369]
▲Often implemented with inside-out
tracking (sensors, radios, acoustic, …) àTable 2 ▲Often implemented with outside-in tracking (cameras, infrared, radios, optical, acoustic) àTable 2
Input Modalities (Touch, Gestures, or Device Manipulation)
Techniques aimed at interacting with, transferring or exploring content, data, visualisations, or interfaces that spread across multiple devices. Setting up cross-device configurations of devices including pairing, combining, connecting devices.
Techniques to disconnect cross-device setups or configurations, interactions and applications.
Disengagement
Content
Engagement
Configuration
Phase 1 Phase 2 Phase 3Table 3: Overview of interaction techniques for cross-device computing.
Gestural pairing techniques include Rekimoto’s seminal
tap-ping [280], and techniques such as roll-and-pointing [61] or
hold-and-flipping [54] to combine devices.
Most techniques in the configuration phase are designed
with 2D or 3D device motion as the main input modality. As
seen in Table 3, examples of pairing techniques using motion
include bumping [127], stacking [61], or shaking devices [131,
211]. The few shape-changing techniques examined how
modifying the physical shape of devices through bending,
sandwiching, or stretching [61] can be used to relate devices
to each other.
Using eye, gaze, or head orientation, techniques such as
perspective-aware interfaces [226], perspective-aware
cur-sor [227], or display change visualisations [81] are used to
select the right device or screen. Finally, techniques such as
gradual engagement [203] and proxemic interactions [107]
leverage the location, position, and orientation of the entire
body to create semantic relations between devices. As
com-bining various devices into a cross-device configuration or
ecology is a central precondition for any application or
tech-nique to work across devices, it is unsurprising that so many
techniques
explicitly
focus on this pairing or configuration
phase.
Phase 2: Content Engagement
.
The second phase occurs
after devices have been configured for cross-device usage,
and includes direct or indirect interaction with content, data,
visualisations, applications or interfaces that are spread across
multiple devices.
Content engagement
encapsulates the
projection systems that extend the interaction space to
vi-sual proxies next to a device [311], extended projected
dis-plays [57], touch-enabled surfaces around the device [362],
or even augmented mouse, touch, and keyboard input [23].
Mid-air gestures have also been considered for cross-device
interaction. Some of these are variations of
waving
: such as
waving between devices [50] or waving above devices [141].
Other mid-air examples are performed after a touch or 3D
motion interaction, such as point-and-grab [198],
lift-and-drop [8], or grasp and micro-mobility [375].
The majority of interaction techniques for
content
engage-ment
use the 2D or 3D
device motion
modality. A first
cate-gory of techniques focuses on 2D movement on a flat
sur-face. Techniques include rotating devices to interact with
content [143, 270, 288], moving devices to explore spatially
aware maps [90, 270], or to explore information
visualisa-tions [367]. The second category focuses on advanced 3D
motions with devices for content interaction. Examples
in-clude pouring [159] or throwing content onto a display [69],
and tilting actions to pan a map [69]. Further techniques
include rotating [188], throwing and chucking [122],
shoot-and-copy [27], and tilting [191] techniques to interact across
devices (see the full list in Table 3).
There are only a few full-body gestures, such as content
transfer propagated through F-formations [206], or gaze and
head gestures to select devices or screens [183, 303], and pick
and drop content [333]. Many of these techniques leverage
the physicality and affordances of the devices to enable
ex-pressive 3D device motion to receive, use, or send data to
other devices that are very easy and intuitive to perform.
Phase 3: Disengagement
.
The last phase covers
interac-tion techniques for a person to stop cross-device content
engagement on a device, infrastructure, or application level.
While the first configuration phase has received much
atten-tion in earlier work, the disengagement phase remains less
well explored. Few examples for on and around-the-device
include cross-device session management [116] or covering
a smartwatch to reset the cross-device configuration [32].
Using 3D motion, there are techniques to break connection
by moving the device [127, 298], picking up the device from
the tracked area [143, 190, 270], tilting devices vertically
to-wards oneself to stop sharing [190], shaking to break
connec-tion [243], or implicit disconnecconnec-tion of the device by breaking
physical contact [371]. Finally, proxemic interaction supports
implicit disengagement by leaving the operation-space [206]
or by turning away from the display [369].
It is important to note that interaction techniques can
occur in – or combine – multiple functions from different
phases at the same time. For example, techniques discussed
in PhoneTouch [294], WatchConnect [141], Gradual
Engage-ment [206], or Gluey [303] combine Phase 1 configuration
and Phase 2 content engagement functions in one
interac-tion technique. However, applying this taxonomy can be a
helpful analytical lens to understand the breadth and focus
of most cross-device interaction techniques.
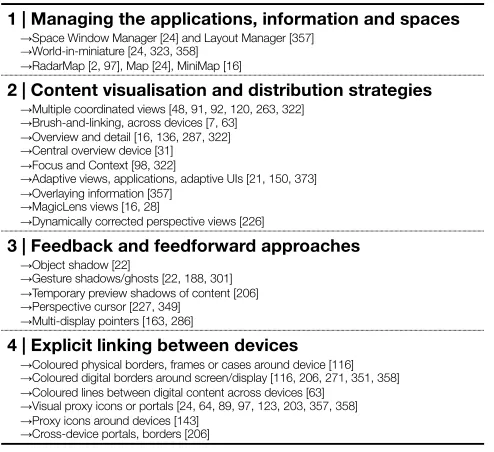
1 | Managing the applications, information and spaces
→Space Window Manager [24] and Layout Manager [357] →World-in-miniature [24, 323, 358]
→RadarMap [2, 97], Map [24], MiniMap [16]
2 | Content visualisation and distribution strategies
→Multiple coordinated views [48, 91, 92, 120, 263, 322] →Brush-and-linking, across devices [7, 63] →Overview and detail [16, 136, 287, 322] →Central overview device [31] →Focus and Context [98, 322]
→Adaptive views, applications, adaptive UIs [21, 150, 373] →Overlaying information [357]
→MagicLens views [16, 28]
→Dynamically corrected perspective views [226]
3 | Feedback and feedforward approaches
→Object shadow [22]
→Gesture shadows/ghosts [22, 188, 301] →Temporary preview shadows of content [206] →Perspective cursor [227, 349]
→Multi-display pointers [163, 286]
4 | Explicit linking between devices
→Coloured physical borders, frames or cases around device [116] →Coloured digital borders around screen/display [116, 206, 271, 351, 358] →Coloured lines between digital content across devices [63]
→Visual proxy icons or portals [24, 64, 89, 97, 123, 203, 357, 358] →Proxy icons around devices [143]
[image:9.612.318.565.157.383.2]→Cross-device portals, borders [206]
Table 4: Cross-device visualisation and management.
Visualisation and Cross-Device Management
Related to the interaction techniques, we identified four
ma-jor categories of visualisation and feedback that have been
used to help users understand how a particular cross-device
interaction technique or application works (Table 4).
Informative
→observational studies (e.g. interviews, diary study) [40–42, 75, 112, 148, 153, 252, 290] →gesture elicitation studies [166, 230, 271, 305]
Usage (219)
→qualitative lab study[31, 32, 49, 116, 133, 143, 230, 231, 263, 357]
→quantitative user study [8, 16, 28, 97, 109, 122, 136, 165, 187, 189, 198, 212, 249, 271, 274, 314, 352, 366]
→mixed method lab study[7, 54, 190, 191, 206, 255, 264, 302, 352, 367] →deployment in
→social setting, conference [224, 317, 335] →classroom, students [37, 53, 158, 179] →office [49, 279, 357]
→other in-the-wild [148, 189, 210] →lab study with experts (e.g. developers,
researchers) [14, 58, 99, 197, 202, 205, 236, 261, 373]
→lab study with users[13, 30, 64, 110, 114, 116, 128, 136, 138, 143, 157, 165, 169, 191, 200, 206, 238, 246, 301, 302, 347]
Demonstration (70)
→example applications and case studies →of a technical system (e.g. development
framework, toolkit, middleware) [124, 145, 152, 174, 193, 235, 243, 304, 328, 373] →of an interaction technique [54, 66, 94, 118, 147,
186, 300, 322, 374]
→of a theoretical framework; constructive-conceptual [245, 316, 324]
→focus groups and workshops [59, 158, 179, 245, 246, 283, 306]
→design sessions and co-creation [234, 283] →other informal & early demonstrations
[128, 138, 279, 303, 363]
Technical evaluation (66)
→performance, compared to other systems [159, 227, 269, 320, 333]
→quality measurements (e.g. accuracy of tracking) [6, 7, 47, 54, 55, 103, 110, 123, 145, 159, 186, 227, 230, 258, 267, 269, 270, 280, 293, 320, 362, 378] →system performance (e.g. time, frequency, FPS,
round trip time, memory, etc.)[6, 47, 103, 255, 258, 270, 282, 320, 339, 378]
Heuristic evaluation (5)
[image:10.612.54.295.92.290.2]→as only evaluation method [173, 174] →together with qualitative user studies
[197, 353]
→together with case studies [304] →qualitative user study based on heuristic
criteria [236]