Turbulence-mediated facilitation of resource uptake in patchy stream macrophytes
1Authors: 2
Loreta Cornacchia1,5, a [email protected], [email protected] 3
Sofia Licci2 [email protected] 4
Heidi Nepf3 [email protected] 5
Andrew Folkard4 [email protected] 6
Daphne van der Wal1,6 [email protected] 7
Johan van de Koppel1,5 [email protected] 8
Sara Puijalon2 [email protected] 9
Tjeerd J. Bouma1,5 [email protected] 10
11
Affiliations: 12
1 NIOZ Royal Netherlands Institute for Sea Research, Department of Estuarine and Delta Systems, and 13
Utrecht University, P.O. Box 140, 4400 AC Yerseke, the Netherlands. 14
2 Univ Lyon, Université Claude Bernard Lyon 1, CNRS, ENTPE, UMR 5023 LEHNA, F-69622, 15
Villeurbanne, France 16
3 Dept. of Civil and Environmental Engineering, Massachusetts Institute of Technology, 77 17
Massachusetts Ave., Bldg. 48-216D, Cambridge, MA 02139, USA. 18
4 Lancaster Environment Centre, Lancaster University, Lancaster, UK 19
5 Groningen Institute for Evolutionary Life Sciences, University of Groningen, PO Box 11103, 9700 20
CC Groningen, The Netherlands 21
6 Faculty of Geo-Information Science and Earth Observation (ITC), University of Twente, P.O. Box 22
217, 7500 AE, Enschede, The Netherlands 23
24
a Present address: UMR 5023 LEHNA, Université Lyon 1, CNRS, ENTPE, Villeurbanne Cedex, 25 France 26 Corresponding author: 27 Loreta Cornacchia 28
Université Lyon 1 29
CNRS, UMR 5023 - LEHNA 30
Laboratoire d'Ecologie des Hydrosystèmes Naturels et Anthropisés 31
6, rue Raphaël Dubois - Bât. Forel 32
F-69622 Villeurbanne Cedex FRANCE 33
e.mail: [email protected] 34
Tel.: +33 (0)4 72 43 12 93 35
Fax: +33 (0)4 72 43 11 41 36
Running head: Turbulence-driven facilitation in macrophytes 39
Keywords: submerged macrophytes; nutrient uptake; mass transfer
Abstract
41Many landscapes are characterized by a patchy, rather than homogeneous, distribution of vegetation. 42
Often this patchiness is composed of single-species patches with contrasting traits, interacting with 43
each other. To date, it is unknown whether patches of different species affect each other’s uptake of 44
resources by altering hydrodynamic conditions, and how this depends on their spatial patch 45
configuration. Patches of two contrasting aquatic macrophyte species (i.e., dense canopy-forming 46
Callitriche and sparse canopy-forming Groenlandia) were grown together in a racetrack flume and 47
placed in different patch configurations. We measured 15NH4+ uptake rates and hydrodynamic 48
properties along the centerline and the lateral edge of both patches. When the species with a taller, 49
denser canopy (Callitriche) was located upstream of the shorter, sparser species (Groenlandia), it 50
generated turbulence in its wake that enhanced nutrient uptake for the sparser Groenlandia. At the 51
same time, Callitriche benefited from being located at a leading edge where it was exposed to higher 52
mean velocity, as its canopy was too dense for turbulence to penetrate from upstream. Consistent with 53
this, we found that ammonium uptake rates depended on turbulence level for the sparse Groenlandia
54
and on mean flow velocity for the dense Callitriche, but Total Kinetic Energy was the best descriptor 55
of uptake rates for both species. By influencing turbulence, macrophyte species interact with each other 56
through facilitation of resource uptake. Hence, heterogeneity due to multi-specific spatial patchiness 57
has crucial implications for both species interactions and aquatic ecosystem functions, such as nitrogen 58
Introduction
60In many ecosystems, vegetation shapes entire landscapes by interacting with physical processes 61
(Dietrich and Perron 2006; Corenblit et al. 2011). In coastal and fluvial aquatic ecosystems, vegetation 62
modifies habitats through its effects on hydrodynamics and sedimentation (Leonard and Luther 1995; 63
Madsen et al. 2001; Schulz et al. 2003; Bouma et al. 2007), hence acting as an ecosystem engineer 64
(Jones et al. 1994). Many studies first considered interactions between hydrodynamics and 65
homogeneous vegetation (Kouwen and Unny 1973; Nepf 1999; Nepf and Vivoni 2000; Järvelä 2005; 66
Chen et al. 2013), and later focused on isolated or pairs of patches (Sand-Jensen and Vindbœk Madsen 67
1992; Folkard 2005; Bouma et al. 2009; Vandenbruwaene et al. 2011; Chen et al. 2012; Zong and Nepf 68
2012). Generally, vegetation patches locally reduce flow velocities, while increasing them in some 69
adjacent areas (Bouma et al. 2007; Chen et al. 2012; Schoelynck et al. 2012; Meire et al. 2014). 70
In aquatic ecosystems, the interaction between vegetation and hydrodynamics regulates important 71
ecological processes such as nutrient delivery and uptake by plants, as nutrients can be taken up from 72
the water column through plant shoots (Madsen and Cedergreen 2002; Bal et al. 2013). These 73
processes are crucial for community primary productivity and ecosystem function (Thomas et al. 2000; 74
Morris et al. 2008; Levi et al. 2015). Previous studies on uptake rates in relation to hydrodynamic 75
conditions mainly focused on seagrasses, using flume experiments with dissolved 15N-labeled 76
ammonium or nitrate (often the main inorganic nitrogen sources in natural conditions; Haynes and Goh 77
(1978)). These works identified the important effects of water velocity and flow alteration by seagrass 78
canopies on resource uptake (Thomas et al. 2000; Cornelisen and Thomas 2006), and the dependence 79
of uptake rates on the rate of mass transfer to the leaf surface under unidirectional flow (Cornelisen and 80
Thomas 2004). Further, Morris et al. (2008) identified spatial patterns in ammonium uptake within 81
seagrass patches, with higher uptake observed at the leading edge of the patch where the turbulent 82
macrophytes, Bal et al. (2013) found that ammonium uptake increased with flow velocity. Because the 84
diffusive boundary layer decreases with increasing velocity, the uptake rate also increases with 85
increasing velocity (Thomas et al. 2000; Cornelisen and Thomas 2004; Morris et al. 2008; Bal et al. 86
2013). 87
However, most of the previous studies dealt with monospecific canopies or focused on a single 88
species at a time, creating a monospecific community, while in reality natural landscapes are a diverse 89
community made up of multiple species. Different patches of single species are heterogeneously 90
distributed, and this patchiness is a common characteristic of aquatic habitats (Sand-Jensen and 91
Vindbœk Madsen 1992). A few examples are patchy seagrass meadows (Fonseca et al. 1983), and 92
streams characterized by a ‘pseudo-braided’ distribution of plant stands between areas of faster flow 93
(Dawson and Robinson 1984; Cotton et al. 2006; Wharton et al. 2006). This additional level of 94
complexity has just started to be integrated in studies of hydrodynamic-vegetation interactions. For 95
instance, Weitzman et al. (2015) focused on hydrodynamic implications of multi-specific canopies, but 96
considered canopy heterogeneity in the vertical dimension. Adhitya et al. (2014) focused on 97
hydrodynamics and spatial configurations of seagrass patches with different densities, but did not test 98
the consequences for resource uptake. Bal et al. (2013) focused on nutrient uptake rates within 99
monospecific patches of two species next to each other, but they only tested a single spatial 100
configuration and therefore did not investigate the effects of spatial patchiness. To date, it is still 101
unknown how patches of different species interact with each other by altering hydrodynamics and 102
uptake of resources, and how this depends on their landscape configuration. 103
Multispecies effects could be important for hydrodynamics and nutrient uptake because the 104
density, flexibility and canopy structure of different species affect hydrodynamics differently (Peralta 105
et al. 2008; Bouma et al. 2013). As we cannot easily predict the flow alteration by heterogeneous 106
reduction in aquatic ecosystems is limited. Generally, the hydrodynamic controls on uptake rate are 108
expected to be dependent on the macro-scale rate of delivery (mean flow velocity; e.g. Cornelisen and 109
Thomas (2006)), or on the micro-scale processes that determine the concentration gradient at the leaf 110
boundary layer (turbulence; e.g. Morris et al. (2008)). However, in a diverse community there might be 111
cases where a single hydrodynamic parameter is not sufficient to describe uptake rates for multiple 112
species with different traits and effects on hydrodynamic conditions. For instance, turbulence can have 113
a significantly smaller scale in very dense canopies, compared to sparser ones (Nepf 2012). On the 114
other hand, the mean flow speed can be relatively constant within sparse canopies, but turbulence 115
might be locally variable. Therefore, understanding the interaction between multiple species in terms of 116
nutrient uptake, mediated by their hydrodynamic effects, is essential to gain a more realistic 117
understanding of species interactions and productivity in heterogeneous, multi-specific communities. 118
In this study, we use streams colonized by aquatic macrophytes as a model system. We 119
investigate how patches of two different species with contrasting morphological traits interact with 120
each other by influencing hydrodynamics, and thereby ammonium uptake. Moreover, we test how this 121
depends on their spatial configuration (patchiness). Here, we define multi-specific patchiness as a 122
community composed of patches of different species. Specifically, we study the interaction between 123
two macrophyte species that co-occur under field conditions and have contrasting density and canopy 124
structure. Callitriche platycarpa Kütz., 1842 forms very dense patches that exhibit increasing canopy 125
height with increasing patch length (‘dense’ species). Groenlandia densa (L.) Fourr. has a more open 126
canopy, and its canopy height is constant along the patch length (‘sparse’ species). In the field, the 127
dense patches of Callitriche are distributed quite regularly at a distance of about 8 meters, and 128
Groenlandia patches tend to aggregate around them (Cornacchia et al. 2018). Given the differences in 129
shoot density and canopy architecture between the two species (Table 1), we hypothesize that the 130
resources by the sparse Groenlandia patches. To test this hypothesis, patches of the two species were 132
arranged in different configurations in a laboratory flume. To investigate the role of spatial 133
configuration and reciprocal species effects on nutrient uptake, both the species upstream and the 134
relative location of the species downstream were varied. We discuss the implications of multi-specific 135
spatial patchiness on facilitation and aquatic ecosystem functions, such as nitrogen retention. 136
Materials and methods
137Plant material 138
We tested the effect of macrophyte patch species and configuration on ammonium uptake rates using 139
two submerged macrophytes species, Callitriche platycarpa and Groenlandia densa. Both species were 140
collected in February 2015 from a wetland on the Ain River, France (5.2825 E, 45.9855 N). Plants 141
were stored in plastic bags and transported to the laboratory in NIOZ Yerseke (The Netherlands) within 142
24 hours from collection. Until installation in the flume, the two macrophyte species were stored in a 143
green house, in tanks filled with freshwater that was continuously aerated, and exposed to natural light. 144
The macrophytes were allowed to recover for two days in the green house before starting the 145
experiments. In order to be used for the experimental setup, individual plants were transplanted in 146
stainless steel trays (30 29.5 5 cm). The trays were filled with a bottom layer of river sand (4.5 cm) 147
and a top layer (0.5 cm) of fine gravel (0.2 cm grain size). A false bottom in the flume allowed the trays 148
to be inserted with the soil surface at the same level as the flume bed. Based on the naturally occurring 149
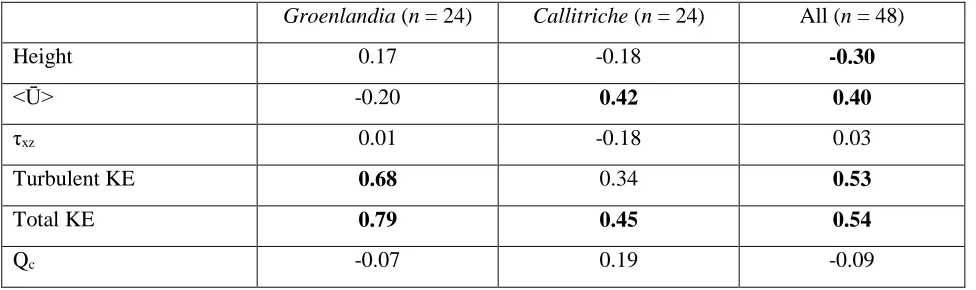
densities of the two species in the field, we constructed patches of 97 ± 28 g DW m-2 (mean ± SD) for 150
Groenlandia (‘sparse’ species) and 318 ± 67 g DW m-2 for Callitriche (‘dense’ species) (Figure 1; 151
Table 1). The biomass of the constructed patches was estimated by collecting all plant material within 152
range of 208 – 256 g DW m-2 reported in Sand-Jensen and Vindbœk Madsen (1992). The mean patch 154
biomass for Groenlandia corresponded to ca. 500 shoots m-2, which represents a relatively low shoot 155
density in natural plant beds (Sheldon and Boylen 1977). We used a different patch length for each 156
species to resemble the typical lengths observed in the field, i.e. 2.7 m and 1.2 m on average for 157
Groenlandia and Callitriche respectively. These values are representative of average patch sizes 158
observed in field conditions (2.5 ± 1.7 m for Groenlandia, n = 20; 1.4 ± 0.8 m for Callitriche, n = 20; 159
Supporting Information Fig. S1). We used a total of 9 trays for Groenlandia, for a total patch coverage 160
of 2.7 0.3 m. For Callitriche, plants were rooted in two trays (0.6 0.3 0.05 m). When Callitriche
161
was placed upstream, three trays (filled with the same soil as the plant trays) were placed between the 162
two patches, to account for the presence of the typical overhanging canopy for this species. That is, 163
when the flume was running, a total coverage of 1.20 0.3 m2 was observed due to shoots bending; 164
this region was considered as part of the Callitriche patch (see Figure 2). A distance of one tray (0.3 m) 165
between the two patches was used for the configurations in which Groenlandia was in the upstream 166
position. The flume section next to each patch was left open (without plants, but filled with the same 167
soil substrate used in the plant trays) in all configurations. Thus, the patches occupied one half of the 168
flume, rather than extending across the width of the flume. As patches in the field do not span the 169
whole channel, this configuration is representative of the typical distribution of vegetation patches in 170
streams, with an empty (unvegetated) zone next to the patch into which water flow is deflected and 171
accelerated around the patch (Fonseca et al. 1983; Gambi et al. 1990; Bouma et al. 2007; Follett and 172
Nepf 2012). The canopies of both species were fully submerged during the experiments. The relative 173
depth of submergence (H/h, ratio of water depth to maximum canopy height; Nepf (2012)) was 174
relatively constant along the Groenlandia patch due to its uniform height. Values of H/h ranged 175
between 8.75 and 4.3, corresponding to shallow submerged (H/h < 5). Instead, canopy height along the 176
the middle of the patch (indicating shallow submergence (H/h < 5), and even 1.30 at the downstream 178
end of the patch, which is very close to emergent conditions (H/h = 1). 179
Flume setup and experimental configurations 180
All experiments were performed within a unidirectional racetrack flume using a water depth of 0.35 m 181
and with a cross-sectionally-averaged velocity of 0.24 ± 0.03 m s-1. This is a moderate flow velocity, 182
representative of the summer flow conditions in streams typically colonized by Callitriche and 183
Groenlandia (0.21 ± 0.01 m s-1, based on our field measurements in 2014 and 2015; Cornacchia et al. 184
(2018)). For a more detailed description of the flume, see Bouma et al. (2005). To test for the effects of 185
patch spatial configuration on ammonium uptake rates, the two patches were arranged one downstream 186
of the other, either on the same side of the flume (‘aligned’ configurations), or on opposite sides 187
(‘staggered’ configurations) (Figure 2). These different spatial configurations are both commonly 188
observed in natural streams, where patches grow downstream of other patches, or in a staggered 189
arrangement (L. Cornacchia, pers. obs.). Moreover, patches of different species in the field can be 190
found co-occurring at very short distances from each other, at the scale of 0.5 m (Cornacchia et al. 191
2018). To test for interactions between the two species, in terms of reciprocal effects on ammonium 192
uptake rates, we also switched the species located upstream for each of these configurations (‘Sparse-193
Dense’ or ‘Dense-Sparse’ configurations). 194
Measuring spatial patterns in 15N-NH4+ uptake rates and canopy hydrodynamics 195
To determine spatial patterns of ammonium uptake rates by the macrophyte species, we measured 196
uptake rates at selected locations within the patches (Figure 2). Nutrient uptake rates were determined 197
inside the two patches at 10%, 50% and 90% of the patch length (0.27, 1.45 and 2.43 m from the 198
leading edge in Groenlandia; 0.12, 0.6 and 1 m from the leading edge in Callitriche) and, for each 199
macrophyte individuals were randomly selected from the tanks where they were kept with freshwater 201
and were transplanted into plastic pots (5 shoots per pot). Before transplantation in the flume, roots 202
were removed from the plants at the selected test locations, to prevent ammonium uptake by that means 203
from the labeled water that inevitably penetrated into the sand (following Bal et al. (2013)). Since the 204
sediment was not changed in between treatments (as that would have meant destroying and recreating 205
the patches), this avoided an effect of treatment order on uptake rates. While some nutrients are 206
obtained through roots in field conditions, the nutrient demands of many macrophyte species can be 207
satisfied by shoot nutrient uptake alone (Madsen and Cedergreen 2002). Although root removal may 208
have potentially affected the plant response to the flow, it was unlikely to affect their ability to resist 209
the flow during a short-term experiment (6 hours). Each plastic pot was then placed in one of the patch 210
locations described above, and inserted in the trays so that their upper part was in line with the 211
sediment level to avoid scouring effects. The pots were replaced after each incubation experiment and 212
new plants were transplanted. The renewal of plants between each run allowed us to avoid an effect of 213
treatment order on uptake rates, due to plants being exposed to the labeled water for a longer time. 214
Moreover, it provided natural variability in plant structure, while maintaining a constant patch structure 215
by keeping the trays forming the plant patches in the same positions between runs. The treatments were 216
run in the order shown in Figure 1. 217
In the incubation experiments, 15N-NH4+ was added to the water creating a 20 to 30 mol-218
NH4+L-1 solution, with 30% of the N as 15N abundance, following Bal et al. (2013). This range of 219
values is representative of nutrient concentrations found in natural ecosystems: in summer 2015, 220
average ammonium levels recorded in the studied region were 24.5 ± 28.54 mol-NH4+L-1, with a 221
maximum value of 79.6 mol-NH4+L-1.Such a high enrichment (30%) was chosen to minimize 222
dilution effects of the 15N source pool over the course of the experiment. At the start and end of the 223
same labeled water was used to perform four experiments, before replacing it with freshwater and a 225
new label for the next runs (based on Bal et al. (2013)). Incubations were performed under artificial 226
light conditions. Lamps were mounted above the flume tank throughout the test section to provide 14 h 227
d-1 of light (photosynthetic photon flux density of 550 mol m-2 s-1; measured 35 cm above the 228
sediment surface). The stable isotope was added near the paddles that drive the flow in the flume to 229
ensure mixing. Each incubation experiment lasted for 6 hours, and two replicate runs were performed 230
for each configuration. At the end of the 6 hours, macrophytes were collected from the test positions, 231
rinsed with tap water to remove excess isotope from the plant surface, and folded into aluminum foil. 232
In addition to the samples collected (n = 30 for each species), five specimens per species were 233
randomly selected during the experiments from our species stock, to determine the background 15N 234
signal. The plants were dried in the oven for 48 hours at 60° C, and individual biomass was weighed. 235
Dried macrophytes were ground to a fine powder using a ball mill (MM 2000, Retsch, Haan, 236
Germany). A subsample of about 3 mg of powder per plant was sent to the laboratory for mass 237
spectrometry analysis of the isotope ratio.The samples were analysed for total N content and 15 N-238
atomic percentage (as (15N/total N) × 100) with an Elemental Analyser (Thermo Electron FlashEA 239
1112) and subsequent isotope ratio mass spectrometry (Thermo Delta V - IRMS). For recent guidelines 240
on stable isotope notations, see Coplen (2011). 241
The 15N atomic fraction of the dissolved N source pool in the water column (x(15N)aq.N) was 242
calculated according to Morris et al. (2013): 243
𝑥( 𝑁)15 𝑎𝑞.𝑁 =
([𝑁𝐻4+]
𝑡𝑟𝑎𝑐𝑒𝑟𝑥( 𝑁)15 𝑡𝑟𝑎𝑐𝑒𝑟) + ([𝑁𝐻4+]𝑤𝑎𝑡𝑒𝑟𝑥( 𝑁)15 𝑖𝑛𝑖𝑡𝑖𝑎𝑙)
[𝑁𝐻4+]
𝑡𝑟𝑎𝑐𝑒𝑟+ [𝑁𝐻4+]𝑤𝑎𝑡𝑒𝑟
(1)
where x(15N)tracer is the atomic fraction of the added tracer (0.98), [NH4+]water is 20.7 ± 3.1 μmol‐
244
reflect 15N of atmospheric N, 3.7 × 10− 3). To provide an estimate of the change in 15NH4+ ( mol-246
NH4+L-1) concentrations between runs (i.e., [NH4+]tracer), mean 15NH4+ uptake rates (µmol g-1 (DM) h-1) 247
for each species were multiplied by their total estimated biomass (g DM m-2) and by the incubation 248
time (6 hours). Given the large volume of the flume water, the estimated 15NH4+ tracer concentrations 249
remained high, between 8.0 and 8.8 mol-NH4+L-1, corresponding to an increase in total water column 250
[NH4+] of between 27.5% and 29.7%. 251
To calculate the NH4+ uptake rate (V in µmol g-1 (DM) h-1) of each sample, we followed the 252
equation in Morris et al. (2013): 253
𝑉 = [𝑁]𝐷𝑀_𝑠𝑎𝑚𝑝𝑙𝑒∙
(𝑥𝐸( 𝑁)15
𝐷𝑀_𝑠𝑎𝑚𝑝𝑙𝑒)
(𝑥( 𝑁)15
𝑎𝑞.𝑁∙ ∆𝑡)
(2)
where xE(15N)DM_sample is the 15N excess atom fraction, calculated as the difference between the atomic 254
fraction measured in the biomass of the sample after incubation (x(15N)DM_sample) and the background 255
15N abundance x(15N)DM_nat.ab measured on five background specimens for each species ((3.70 ± 0.008) 256
10-3 for Callitriche, (3.69 ± 0.018) 10-3 for Groenlandia); ∆𝑡 (h) is the incubation time (6 h) and 257
[N]DM_sample is the N content of the dry biomass (µmol g-1 (dry mass (DM)) of each sample. 258
Hydrodynamic measurements
259
To test the relationship between hydrodynamic parameters and nutrient uptake, vertical profiles of 260
velocity were measured with a 3D acoustic Doppler velocimeter (ADV, Nortek) over 30 s at 10 Hz. 261
Within each profile, velocity was measured at seven vertical locations at 2, 5, 10, 12, 15, 17 and 27 cm 262
above the channel bed. The profiles were measured in the same streamwise and lateral locations as the 263
plant samples collected for nutrient uptake estimation, i.e. at 10%, 50% and 90% of the length of each 264
direction (Figure 2). To minimize interference by vegetation structures within the sampling volume of 266
the ADV probe, the probe started at the lowest measuring point for each vertical profile within the 267
vegetation. This prevented the canopy from being compressed as the probe moved towards the bed. To 268
ensure that measurements were based on reliable data points, spikes and low-quality data points (i.e., 269
correlation below the standard quality threshold of 70%) were removed during post-processing.The 270
height of the vegetation canopy in each location was measured with a ruler in cm. The canopy height 271
(h) was 0.17 ± 0.08 m for Callitriche, and 0.07 ± 0.01 m for Groenlandia (Table 1). Freshwater 272
macrophytes are flexible, mesh-like structures (Sand‐Jensen 2005), often with highly branched stems 273
that get entangled in each other. Their flexibility and complex morphology make it very challenging to 274
measure individual plant parameters like shoot height, frontal area, shoot density or average distance 275
between shoots. Thus, the frontal area per water volume (a, m-1) and frontal area per bed area (ah, 276
dimensionless) for the two species were calculated from water depth (H) and canopy length (l), width 277
(y) and height (h) measurements (Table 1) through the following equations: 278
𝑎 = ℎ 𝑦 𝐻 𝑦 𝑙=
ℎ
𝐻 𝑙 (3)
𝑎ℎ = ℎ 𝑦 𝑦 𝑙 =
ℎ
𝑙 (4)
As the frontal area of flexible submerged macrophytes is highly variable (i.e. their shape and canopy 279
height change with flow velocity; Sand‐Jensen (2005)), the values are indicative for the incoming flow 280
velocity of 0.24 m s-1 used in the experiments. 281
The instantaneous velocity (𝑢(𝑡), 𝑣(𝑡), 𝑤(𝑡)) measured in the streamwise, lateral, and vertical 282
directions, respectively, were separated into time-averages (𝑈̅, 𝑉̅, 𝑊̅), and instantaneous turbulent 283
fluctuations (𝑢′(𝑡), 𝑣′(𝑡), 𝑤′(𝑡)), e.g. as 𝑢′(𝑡) = 𝑢(𝑡) − 𝑈, and similarly for v and w. The vertical 284
averaged velocity (<Ū>, ms-1) at each profile position. The Total Kinetic Energy (Total KE) per unit 286
mass is defined from the instantaneous velocities (𝑢, 𝑣, 𝑤), defined as: 287
𝑇𝑜𝑡𝑎𝑙 𝐾𝐸 = 1
2 (𝑢
2+ 𝑣2+ 𝑤2) = 𝑇𝑢𝑟𝑏𝑢𝑙𝑒𝑛𝑡 𝐾𝐸 + 𝑀𝑒𝑎𝑛 𝐾𝐸 (5)
which can be partitioned into turbulent kinetic energy (Turbulent KE) and mean kinetic energy (Mean 288
KE), defined as (e.g. Kundu et al. (2004)): 289
𝑇𝑢𝑟𝑏𝑢𝑙𝑒𝑛𝑡 𝐾𝐸 = 1
2 (𝑢′2+ 𝑣′2+ 𝑤′2) (6)
𝑀𝑒𝑎𝑛 𝐾𝐸 = 1 2 (𝑈
2
+ 𝑉2 + 𝑊2) (7)
The Total Kinetic Energy (m2 s-2) provides a better metric for the instantaneous velocity, 290
because it reflects both the time-mean and turbulent fluctuations, and as such it is more relevant to 291
boundary layer dynamics, especially in cases with low time-mean velocity but high Turbulent KE. 292
Specifically, previous studies have suggested that strong instantaneous velocity and/or plant motion can 293
periodically strip away the diffusive sub-layer, which, if frequent enough, will enhance flux to the plant 294
surface (Koch 1994; Stevens and Hurd 1997; Huang et al. 2011). 295
Reynolds shear stress (τxz, Pa) at the top of the canopy at each location was calculated as: 296
𝑥𝑧 = −𝑢̅̅̅̅̅̅̅̅̅̅̅̅̅′(𝑡)𝑤′(𝑡) (8)
in which =1000 kg m-3 is the density of the flume water. 297
Volumetric flow rate of water through the patches (Qc, m3 s-1) was calculated as: 298
𝑄𝑐 = ∑ 𝑄𝑖 ℎ
0
in which ℎis the canopy height, 𝑄𝑖 the volumetric flow rate of water through the layer (ℎ𝑖− ℎ𝑖−1), y is 299
the patch width (0.3 m) and 𝑢̅ℎ𝑖the double-averaged u component (i.e., averaged in time and spatially
300
averaged in the two lateral positions) of the velocity at depth ℎ𝑖. 301
Measuring channel-scale patterns of ammonium uptake 302
To investigate how the relationship between hydrodynamic parameters and ammonium uptake 303
develops at the scale of a whole channel, we tested the correlation between the total in-patch NH4+ 304
uptake rates and in-patch average hydrodynamic parameters (mean velocity, Turbulent KE and Total 305
KE). This allowed us to test whether spatial patch configurations that generated higher mean flow 306
velocity, Total KE or Turbulent KE levels within the canopies promoted higher uptake at the channel 307
scale. The total in-patch NH4+ uptake rate for each configuration was calculated as the sum of the 308
uptake rates estimated in all sampling points (n = 6 per species; Figure 2). This total uptake was used as 309
an estimate of channel-scale uptake, but is not necessarily a measure of total ammonium uptake rates 310
per biomass or aerial cover. 311
Statistical analyses 312
The flume incubation experiments yielded n = 30 samples per experimental run (i.e. from 3 x-positions 313
2 y-positions 5 shoots per position) for each species, and two replicate runs were performed for 314
each configuration. As we were interested in differences in uptake rates among positions within 315
patches, the average uptake rates of the 5 shoots per each position were used in subsequent analyses. 316
Friedman’s rank-sum test was used to test for the presence of trends in NH4+ uptake rates from the 317
upstream to downstream positions along the patches in all replicate runs. The tests were run separately 318
for each species, both for the centerline and for the edge measurement points. To account for the fact 319
that within-patch measurements were not independent from each other, statistical differences in NH4+ 320
(with replicate run as a nested factor within the configuration treatment). As Friedman’s rank-sum tests 322
showed no significant trend in ammonium uptake neither along the centerline nor along the edge 323
positions within patches, measurement position was considered a random effect in the model. The data 324
were log-transformed to meet the ANOVA test assumptions of normality and homogeneity of variance. 325
Pearson’s correlation coefficient was used to test for significant correlation between NH4+ uptake rates 326
(µmol g-1 (DM) h-1) and hydrodynamic parameters (depth-averaged velocity <Ū> (m s-1); Reynolds 327
shear stress τxz (Pa); Turbulent KE (m2 s-2); Total KE (m2 s-2); and volumetric flow rate, Qc (m3 s-1), 328
and between channel total NH4+ uptake rates and average hydrodynamic parameters within both 329
species patches (mean velocity, Turbulent KE and Total KE). P values of less than or equal to 0.05 330
were considered to be significant. All statistical analyses were performed in R 3.1.2 (R Core Team 331
2015). 332
Results
333Relationship between canopy hydrodynamic parameters and nutrient uptake
334
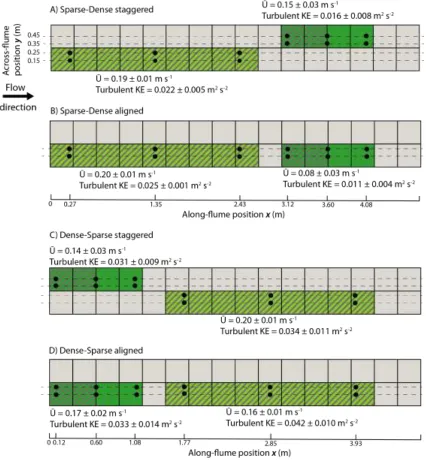
We found that the two macrophyte species affected each other’s ammonium uptake rates by altering 335
mean flow velocity (<Ū>) and turbulence (Turbulent KE). Ammonium uptake rates depended on either 336
mean flow velocity (Callitriche) or turbulence (Groenlandia), but Total Kinetic Energy (Total KE) was 337
the single best descriptor of uptake rates for both species (Figure 3; Table 2). Specifically, NH4+ uptake 338
rates for the sparse Groenlandia were significantly correlated with Turbulent KE (r = 0.68, p < 0.001), 339
but not with mean flow velocity (r = -0.20, p = 0.35) (Figure 3; Table 2). The opposite was true for the 340
dense Callitriche: uptake rates were significantly correlated with mean flow velocity (r = 0.42, p = 341
0.04), but not with Turbulent KE (r = 0.34, p = 0.1) (Figure 3; Table 2). However, Total KE, which is 342
for Groenlandia; r = 0.45, p = 0.03 for Callitriche; r = 0.54, p < 0.001 for both species together) 344
(Figure 3A; Table 2). No significant relationship was found between ammonium uptake rates and either 345
Reynolds shear stress or Qc (Table 2). 346
Effects of patch spatial configurations on nutrient uptake
347
When located upstream, the dense Callitriche patch increased turbulence and thereby enhanced the 348
uptake of resources by the sparse Groenlandia patch located downstream. The ammonium uptake rates 349
were influenced by both macrophyte species and spatial patch configuration (order and alignment). 350
Importantly, the Dense-Sparse (D-S) configurations led to higher uptake rates for both species. The 351
NH4+ uptake rates for the sparse Groenlandia were 2.63 ± 1.33 µmol g-1 (DM) h-1, almost double than 352
for the dense Callitriche (1.44 ± 0.78 µmol g-1 (DM) h-1). Testing for the presence of patterns in NH4+ 353
uptake rates from upstream to downstream within the patches showed no significant trend in uptake 354
rates along the patch centerline (Friedman 22= 3, p = 0.22 for Callitriche; Friedman 22 = 1, p = 0.60 355
for Groenlandia), nor along the patch edge (Friedman 22= 0.25, p = 088 for Callitriche; Friedman 22
356
= 3, p = 0.22 for Groenlandia). This indicates there was no significant pattern in stable isotope 357
concentration from upstream to downstream within patches. 358
The upstream-downstream order and spatial patch alignment of the species significantly 359
affected uptake rates for both the sparse Groenlandia (nested ANOVA, F3,4 = 6.87, p = 0.04) and the 360
dense Callitriche (nested ANOVA, F3,4 = 12.57, p = 0.017; Figure 4). We generally found that when 361
the denser species (Callitriche) was located upstream of the sparser one (Groenlandia), ammonium 362
uptake rates for both species increased significantly, compared to patch configurations in the Sparse-363
Dense order (Figure 4). This significant increase in uptake rates was related to the hydrodynamic 364
effects of different configurations, and particularly the traits of Callitriche (i.e. density and canopy 365
upstream, it generated higher Turbulent KE that influenced the downstream patch of Groenlandia
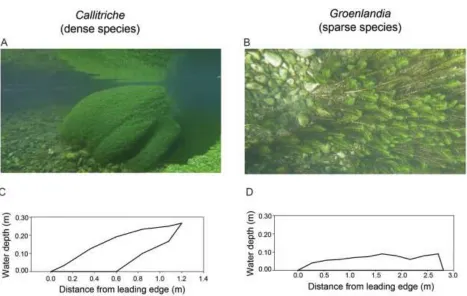
367
(Figure 2), enhancing its uptake rates (Figure 3). Also, when the dense Callitriche was upstream, its 368
leading edge was exposed to higher mean velocity compared to when it was trailing behind the sparse 369
patch (Figure 2), thereby increasing its uptake rates (Figure 3). Specifically, for the dense Callitriche, 370
uptake rates within the Sparse-Dense order were higher in the staggered than in the aligned 371
configuration (Tukey’s HSD, z = -2.66, p < 0.05). In the Dense-Sparse configurations, no significant 372
difference in uptake rates was found between the staggered or aligned arrangement (Tukey’s HSD, z = 373
-0.50, p > 0.05). However, uptake rates were significantly higher in the Dense-Sparse staggered 374
configuration than in both the S-D configurations (Tukey’s HSD, z = -2.83, p < 0.05). For the sparse 375
Groenlandia, uptake rates within the Sparse-Dense aligned and staggered configuration were not 376
significantly different from each other (Tukey’s HSD, z = -1.92, p < 0.05). In the Dense-Sparse 377
configurations, no significant difference in uptake rates was found between the staggered or aligned 378
arrangement (Tukey’s HSD, z = 0.51, p > 0.05). Uptake rates in the D-S aligned configuration were 379
significantly higher than in the S-D aligned configuration (Tukey’s HSD, z = -2.69, p < 0.05), but were 380
not significantly different from the S-D staggered case (Tukey’s HSD, z = -0.77, p > 0.05). 381
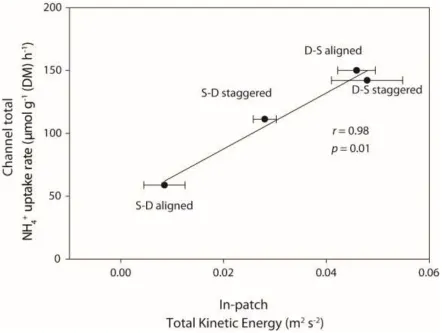
We found that the vegetation distributions that generated higher Total Kinetic Energy levels 382
within the patches promoted higher total uptake at the channel scale (Figure 5). Testing for the 383
hydrodynamic parameter-uptake relationships at the channel scale revealed a significant positive 384
relationship between the in-patch Total Kinetic Energy (average of both patches in each configuration) 385
and the channel total ammonium uptake (r = 0.98, p = 0.01; Figure 5). Channel total ammonium uptake 386
was also significantly related to in-patch Turbulent KE (r = 0.97, p = 0.03), but not to mean flow 387
velocity (r = 0.93, p = 0.07). 388
The interaction between vegetation and hydrodynamics regulates important ecological processes such 390
as nutrient delivery and uptake by aquatic plants, which are crucial for community primary productivity 391
(Thomas et al. 2000; Cornelisen and Thomas 2006; Morris et al. 2008). We found that, by generating 392
turbulence, dense macrophyte patches facilitate resource uptake by neighboring sparse patches. Flume 393
measurements showed that the dense Callitriche had a strong hydrodynamic effect, creating high-394
turbulence regions in its wake that facilitated nutrient uptake by the sparse Groenlandia, which had a 395
weaker hydrodynamic effect. While the sparse vegetation benefited from the high turbulence generated 396
in the wake of a dense patch, the dense vegetation benefited from being located at a leading edge, 397
where it was exposed to higher mean velocity, compared to when it was located downstream of another 398
patch (Figure 2; Figure 6). We identified Total Kinetic Energy as the best descriptor of the nutrient 399
removal capacity of streams, especially in heterogeneous multi-species communities. Overall, spatial 400
configurations that lead to higher Total Kinetic Energy within the patches were the ones that led to 401
higher total ammonium uptake. Hence, our results highlight the importance of turbulence as an agent of 402
interaction between different species. Moreover, this study suggests that accounting for interactions 403
between heterogeneous, multi-specific patchy vegetation is crucial to understandaquatic ecosystem 404
functions such as nitrogen retention. 405
Implications of resource uptake in mono- and multi-species communities
406
Previous studies of macrophytes generally found that nutrient uptake rates increased with mean flow 407
velocity (Cornelisen and Thomas 2006; Bal et al. 2013). Morris et al. (2008) found that Turbulent KE 408
was associated with spatial variation in uptake, and volumetric flow rate explained differences in 409
uptake between contrasting species. Yet, in our study, neither of these traditional hydrodynamic 410
parameters could accurately describe uptake rates for both species. However, direct comparison with 411
experiments tested the effect of changing bulk flow velocity on uptake rates, we tested a single bulk 413
flow velocity that represented the average flow conditions in the study sites where Callitriche and 414
Groenlandia coexist. We thus focused on within-patch flow variability, and how the interaction 415
between the two species was determined by their spatial arrangement and flow modification. Using a 416
single bulk flow condition resulted in a relatively narrow range of velocities experienced by the sparse 417
Groenlandia (0.13 – 0.27 m s-1), whereas the flow alteration ability of the dense Callitriche led to a 418
higher flow variability (0.002 – 0.24 m s-1). This factor may partly explain the lack of significant 419
correlation between flow velocity and uptake rates for Groenlandia. Further research is needed to test 420
how changes in mean flow conditions affect the interaction between the two species. 421
We identified Total Kinetic Energy as the parameter that explained most of the variability in 422
uptake rates for both species. To our knowledge, this parameter has not been related before to nutrient 423
uptake rates by aquatic vegetation. Previous studies have suggested that Turbulent KE may influence 424
nutrient uptake (Anderson and Charters 1982; Koch 1994), and the total energy parameter captures this 425
influence. Specifically, when Turbulent KE is weak, flux is controlled by the time-mean diffusive sub-426
layer thickness, which is a function of the time-mean velocity (e.g. Hansen et al. (2011); Rominger and 427
Nepf (2014); Lei and Nepf (2016)). However, when the Turbulent KE is high, periodic disturbances of 428
the diffusive sub-layer by the turbulence can create instantaneously higher concentration gradients at 429
the surface and, thus, higher flux (e.g. Stevens and Hurd (1997); Huang et al. (2011); Rominger and 430
Nepf (2014)). By reflecting the magnitude of both the time-mean velocity and Turbulent KE, the total 431
kinetic energy captures both regimes of flux. The Total Kinetic Energy is particularly suitable in 432
heterogeneous systems where upstream Turbulent KE generation (e.g. by larger, denser patches) can 433
influence flux downstream, i.e. the Turbulent KE is not locally generated and thus uncorrelated with 434
the local time-mean velocity. In the dense Callitriche patches, the canopy is often too dense for 435
conditions, the flux is correlated by the local time-mean velocity, which sets the scale of the diffusive 437
sub-layer. For the sparse Groenlandia, time-mean flow velocity is relatively constant in the canopy and 438
we found no correlation between patch flow variations and uptake rates. However, the within-439
patch Turbulent KE is elevated both by local stem generation and the penetration of turbulence 440
generated upstream. Under these high Turbulent KE conditions, the uptake rates have a high correlation 441
with the Turbulent KE intensity. In landscapes made up of patches of different species, regions with 442
flux controlled by <Ū> and regions controlled by Turbulent KE are heterogeneously distributed, so that 443
neither <Ū> nor Turbulent KE can capture the channel-scale nutrient uptake. Because it can describe 444
both regions of low Turbulent KE (uptake controlled by mean velocity) and high Turbulent KE (uptake 445
controlled by Turbulent KE intensity), we propose Total Kinetic Energy as a useful parameter to 446
describe nutrient uptake capacity in heterogeneous landscapes, which could be used to estimate 447
ecosystem services of nutrient retention by vegetation. 448
In contrast to the findings of Morris et al. (2008) and Bal et al. (2013), we did not find a 449
significant relationship between ammonium uptake rates and volumetric flow rate, likely because the 450
two species have different flexibility and density traits that affect patch compression (Table 1). The 451
canopies of the two species, and the relative importance of flow velocity and turbulence within them, 452
are consistent with the sparse and dense canopy regimes described in Nepf (2012). As expected for a 453
dense canopy condition (ah > 0.1), canopy-scale turbulence in Callitriche is generated at the top of the 454
canopy and can be transported downstream, while stem-scale turbulence is much smaller. Instead, 455
Groenlandia is representative of a sparse canopy condition (ah < 0.1), where stem-scale turbulence is 456
generated within the canopy, but the velocity profile remains logarithmic. 457
Our results reveal the important role of patch spatial configuration and the resulting 458
heterogeneity in influencing species interactions and the nutrient uptake capacity of the landscape. The 459
Groenlandia, increasing it from an ammonium uptake rate of 2.03 ± 0.85 µmol g-1 (DM) h-1 in the 461
Sparse-Dense configurations (where Groenlandia was not exposed to turbulence generation by 462
Callitriche), to 3.23 ± 0.37 µmol g-1 (DM) h-1 in the Dense-Sparse configurations (where it was 463
exposed to turbulence generation by Callitriche). These findings are in line with a field study showing 464
that spatial heterogeneity, created by the interaction of canopy morphology, sediment topography and 465
hydrodynamics, controlled nutrient transport and uptake rates in a patchy seagrass landscape (Morris et 466
al. 2013). While we found clear effects of the upstream-downstream patch arrangement on ammonium 467
uptake rates, we only observed a significant effect of patch arrangement (staggered vs. aligned) in the 468
Sparse-Dense configurations. Vegetation patches in the flume experiment did not span the whole width 469
of the channel, leading to water flow deflection and acceleration around the lateral edges of patches. 470
This flow acceleration effect around the patches is in general agreement with experimental evidence in 471
field and laboratory studies (Vandenbruwaene et al. 2011; Schoelynck et al. 2012; Bouma et al. 2013), 472
suggesting that the conclusions of this work could be generally applied to field conditions. In addition 473
to the role of spatial configuration, it is likely that the distance between the patches governs the 474
intensity of the interaction between them. The stronger interactions between patches likely occur when 475
the distance between them is less than the wake length of the upstream patch (Folkard 2005). It might 476
be expected that the wake length is in turn related to patch density, because density determines at what 477
distances the patch effects will dissipate (Zong and Nepf 2012). Further studies should be undertaken to 478
investigate the detailed hydrodynamic consequences of different spatial patch configurations, testing 479
for the effects of a wider range of distances and its interactive effect with patch density. 480
Turbulence-mediated species interactions: implications for species distributions and nutrient load
481
reduction
The study of turbulence-mediated interactions between macrophyte species suggests a possible 483
mechanism behind the co-occurrence of Groenlandia patches around Callitriche in the field. Recently, 484
it has been shown that Groenlandia shoots grow better around Callitriche patches than on bare, 485
unvegetated sediment (Cornacchia et al. 2018). The wake of the Callitriche patches is both a high-486
turbulence and low-velocity region (Sand-Jensen 1998). Thus, a combination of enhanced resource 487
uptake by turbulence, and reduced biomass losses by flow velocity, might be the conditions behind the 488
improved growth rates of Groenlandia plants around Callitriche patches. As the sparse Groenlandia
489
tends to surround the dense Callitriche patches in regularly spaced aggregations every 8 m (Cornacchia 490
et al. 2018), the interaction between the two species might enhance the overall nutrient removal 491
capacity of the river. The facilitative effect of Callitriche on Groenlandia could switch to competition, 492
as the high biomass Callitriche might have a competitive advantage by reducing resource availability 493
for the sparser species (Groenlandia). On the other hand, competition could be lessened through root 494
uptake from the nutrient pool in the sediment. The balance between facilitation and competition can be 495
clarified by considering additional variables such as root uptake and nutrient availability in the water 496
column and in sediment. Moreover, care must be taken when upscaling the relationship between 497
hydrodynamics and resource uptake at the channel scale. In our incubations, we focused only on uptake 498
rates of a single nutrient (ammonium), which is energetically less costly, but some species might invest 499
in nitrate uptake. This is an interesting aspect that should be explored in future studies of channel-scale 500
nitrogen uptake by vegetation. As a future perspective, we might be able to use the knowledge on these 501
types of species interactions as tools to enhance restoration success of degraded (eutrophic) sites. 502
503
References
Adhitya, A. and others 2014. Comparison of the influence of patch-scale and meadow-scale 505
characteristics on flow within seagrass meadows: a flume study. Marine Ecology Progress 506
Series 516: 49-59. 507
Anderson, S. M., and A. Charters. 1982. A fluid dynamics study of seawater flow through Gelidium 508
nudifrons. Limnology and Oceanography 27: 399-412. 509
Bal, K. D. and others 2013. Influence of hydraulics on the uptake of ammonium by two freshwater 510
plants. Freshwater Biology 58: 2452-2463. 511
Bouma, T. and others 2005. Trade‐offs related to ecosystem engineering: A case study on stiffness of 512
emerging macrophytes. Ecology 86: 2187-2199. 513
Bouma, T., M. Friedrichs, B. Van Wesenbeeck, S. Temmerman, G. Graf, and P. Herman. 2009. 514
Density‐dependent linkage of scale‐dependent feedbacks: A flume study on the intertidal 515
macrophyte Spartina anglica. Oikos 118: 260-268. 516
Bouma, T. and others 2013. Organism traits determine the strength of scale-dependent bio-geomorphic 517
feedbacks: A flume study on three intertidal plant species. Geomorphology 180: 57-65. 518
Bouma, T. and others 2007. Spatial flow and sedimentation patterns within patches of epibenthic 519
structures: Combining field, flume and modelling experiments. Continental Shelf Research 27: 520
1020-1045. 521
Chen, Z., C. Jiang, and H. Nepf. 2013. Flow adjustment at the leading edge of a submerged aquatic 522
canopy. Water Resources Research 49: 5537-5551. 523
Chen, Z., A. Ortiz, L. Zong, and H. Nepf. 2012. The wake structure behind a porous obstruction and its 524
implications for deposition near a finite patch of emergent vegetation. Water Resources 525
Research 48. 526
Coplen, T. B. 2011. Guidelines and recommended terms for expression of stable‐isotope‐ratio and gas‐
527
Corenblit, D. and others 2011. Feedbacks between geomorphology and biota controlling Earth surface 529
processes and landforms: a review of foundation concepts and current understandings. Earth-530
Science Reviews 106: 307-331. 531
Cornacchia, L., J. van de Koppel, D. van der Wal, G. Wharton, S. Puijalon, and T. J. Bouma. 2018. 532
Landscapes of facilitation: how self‐organized patchiness of aquatic macrophytes promotes 533
diversity in streams. Ecology. 534
Cornelisen, C. D., and F. I. Thomas. 2004. Ammonium and nitrate uptake by leaves of the seagrass 535
Thalassia testudinum: impact of hydrodynamic regime and epiphyte cover on uptake rates. 536
Journal of Marine Systems 49: 177-194. 537
---. 2006. Water flow enhances ammonium and nitrate uptake in a seagrass community. Marine 538
Ecology Progress Series 312: 1-13. 539
Cotton, J., G. Wharton, J. Bass, C. Heppell, and R. Wotton. 2006. The effects of seasonal changes to 540
in-stream vegetation cover on patterns of flow and accumulation of sediment. Geomorphology 541
77: 320-334. 542
Dawson, F., and W. Robinson. 1984. Submerged macrophytes and the hydraulic roughness of a 543
lowland chalkstream. Verhandlung Internationale Vereinigung Limnologie 22. 544
Dietrich, W. E., and J. T. Perron. 2006. The search for a topographic signature of life. Nature 439: 411-545
418. 546
Folkard, A. M. 2005. Hydrodynamics of model Posidonia oceanica patches in shallow water. 547
Limnology and oceanography 50: 1592-1600. 548
Follett, E. M., and H. M. Nepf. 2012. Sediment patterns near a model patch of reedy emergent 549
Fonseca, M. S., J. C. Zieman, G. W. Thayer, and J. S. Fisher. 1983. The role of current velocity in 551
structuring eelgrass (Zostera marina L.) meadows. Estuarine, Coastal and Shelf Science 17: 552
367-380. 553
Gambi, M. C., A. R. Nowell, and P. A. Jumars. 1990. Flume observations on flow dynamics in Zostera 554
marina (eelgrass) beds. Marine ecology progress series: 159-169. 555
Hansen, A. T., M. Hondzo, and C. L. Hurd. 2011. Photosynthetic oxygen flux by Macrocystis pyrifera: 556
a mass transfer model with experimental validation. Marine Ecology Progress Series 434: 45-557
55. 558
Haynes, R., and K. M. Goh. 1978. Ammonium and nitrate nutrition of plants. Biological Reviews 53: 559
465-510. 560
Huang, I., J. Rominger, and H. Nepf. 2011. The motion of kelp blades and the surface renewal model. 561
Limnology and Oceanography 56: 1453-1462. 562
Järvelä, J. 2005. Effect of submerged flexible vegetation on flow structure and resistance. Journal of 563
Hydrology 307: 233-241. 564
Jones, C. G., J. H. Lawton, and M. Shachak. 1994. Organisms as ecosystem engineers, p. 130-147. 565
Ecosystem management. Springer. 566
Koch, E. 1994. Hydrodynamics, diffusion-boundary layers and photosynthesis of the seagrasses 567
Thalassia testudinum and Cymodocea nodosa. Marine Biology 118: 767-776. 568
Kouwen, N., and T. E. Unny. 1973. Flexible roughness in open channels. Journal of the Hydraulics 569
Division 99. 570
Kundu, P. K., I. M. Cohen, and H. H. Hu. 2004. Fluid mechanics, 6th ed. ISBN: 978-0-12-405935-1. 571
Elsevier Press, Boston. 572
Lei, J., and H. Nepf. 2016. Impact of current speed on mass flux to a model flexible seagrass blade. 573
Leonard, L. A., and M. E. Luther. 1995. Flow hydrodynamics in tidal marsh canopies. Limnology and 575
oceanography 40: 1474-1484. 576
Levi, P. S. and others 2015. Macrophyte complexity controls nutrient uptake in lowland streams. 577
Ecosystems 18: 914-931. 578
Madsen, J. D., P. A. Chambers, W. F. James, E. W. Koch, and D. F. Westlake. 2001. The interaction 579
between water movement, sediment dynamics and submersed macrophytes. Hydrobiologia 444: 580
71-84. 581
Madsen, T. V., and N. Cedergreen. 2002. Sources of nutrients to rooted submerged macrophytes 582
growing in a nutrient‐rich stream. Freshwater Biology 47: 283-291. 583
Meire, D. W., J. M. Kondziolka, and H. M. Nepf. 2014. Interaction between neighboring vegetation 584
patches: Impact on flow and deposition. Water Resources Research 50: 3809-3825. 585
Morris, E. P., G. Peralta, F. G. Brun, L. Van Duren, T. J. Bouma, and J. L. Perez-Llorens. 2008. 586
Interaction between hydrodynamics and seagrass canopy structure: Spatially explicit effects on 587
ammonium uptake rates. Limnology and Oceanography 53: 1531-1539. 588
Morris, E. P. and others 2013. The role of hydrodynamics in structuring in situ ammonium uptake 589
within a submerged macrophyte community. Limnology and Oceanography: Fluids and 590
Environments 3: 210-224. 591
Nepf, H. 1999. Drag, turbulence, and diffusion in flow through emergent vegetation. Water resources 592
research 35: 479-489. 593
Nepf, H., and E. Vivoni. 2000. Flow structure in depth‐limited, vegetated flow. Journal of Geophysical 594
Research: Oceans 105: 28547-28557. 595
Nepf, H. M. 2012. Flow and transport in regions with aquatic vegetation. Annual Review of Fluid 596
Peralta, G., L. Van Duren, E. Morris, and T. Bouma. 2008. Consequences of shoot density and stiffness 598
for ecosystem engineering by benthic macrophytes in flow dominated areas: a hydrodynamic 599
flume study. Marine Ecology Progress Series 368: 103-115. 600
R Core Team. 2015. R: A Language and Environment for Statistical Computing (Version 3.1. 2): R 601
Foundation for Statistical Computing. Vienna, Austria. URL http://www.R-project.org. 602
Rominger, J. T., and H. M. Nepf. 2014. Effects of blade flexural rigidity on drag force and mass 603
transfer rates in model blades. Limnology and Oceanography 59: 2028-2041. 604
Sand-Jensen, K. 1998. Influence of submerged macrophytes on sediment composition and near‐bed 605
flow in lowland streams. Freshwater Biology 39: 663-679. 606
Sand-Jensen, K., and T. Vindbœk Madsen. 1992. Patch dynamics of the stream macrophyte, Callitriche 607
cophocarpa. Freshwater Biology 27: 277-282. 608
Sand‐Jensen, K. 2005. Aquatic plants are open flexible structures–a reply to Sukhodolov. Freshwater 609
Biology 50: 196-198. 610
Schoelynck, J., T. De Groote, K. Bal, W. Vandenbruwaene, P. Meire, and S. Temmerman. 2012. Self-611
organised patchiness and scale-dependent bio-geomorphic feedbacks in aquatic river vegetation. 612
Ecography 35: 760-768. 613
Schulz, M., H.-P. Kozerski, T. Pluntke, and K. Rinke. 2003. The influence of macrophytes on 614
sedimentation and nutrient retention in the lower River Spree (Germany). Water Research 37: 615
569-578. 616
Sheldon, R. B., and C. W. Boylen. 1977. Maximum depth inhabited by aquatic vascular plants. 617
American midland naturalist: 248-254. 618
Stevens, C. L., and C. L. Hurd. 1997. Boundary-layers around bladed aquatic macrophytes. 619
Thomas, F. I., C. D. Cornelisen, and J. M. Zande. 2000. Effects of water velocity and canopy 621
morphology on ammonium uptake by seagrass communities. Ecology 81: 2704-2713. 622
Vandenbruwaene, W. and others 2011. Flow interaction with dynamic vegetation patches: Implications 623
for biogeomorphic evolution of a tidal landscape. Journal of Geophysical Research: Earth 624
Surface 116. 625
Weitzman, J. S., R. B. Zeller, F. I. Thomas, and J. R. Koseff. 2015. The attenuation of current‐and 626
wave‐driven flow within submerged multispecific vegetative canopies. Limnology and 627
Oceanography 60: 1855-1874. 628
Wharton, G. and others 2006. Macrophytes and suspension-feeding invertebrates modify flows and fine 629
sediments in the Frome and Piddle catchments, Dorset (UK). Journal of Hydrology 330: 171-630
184. 631
Zong, L., and H. Nepf. 2012. Vortex development behind a finite porous obstruction in a channel. 632
Journal of Fluid Mechanics 691: 368-391. 633
Acknowledgments
634The authors gratefully acknowledge Bert Sinke, Lennart van IJzerloo, Lowie Haazen and Jeroen van 635
Dalen for their technical assistance in the flume. We thank Peter van Breugel and members of the 636
analytical lab of NIOZ-Yerseke for the stable isotope analyses. We thank Siebren Wezenberg for 637
helping during the experiments. This work was supported by the Research Executive Agency, through 638
the 7th Framework Programme of the European Union, Support for Training and Career Development 639
of Researchers (Marie Curie ‐ FP7‐PEOPLE‐2012‐ITN), which funded the Initial Training Network 640
(ITN) HYTECH ‘Hydrodynamic Transport in Ecologically Critical Heterogeneous Interfaces’, 641
N.316546. Data associated with this study is available from 4TU.Centre for Research Data at: 642
Figure legends 644
Figure 1:(A) Natural patches of Callitriche and (B) Groenlandia in the field. (C, D) Lateral view of the 645
two patches, with the black outline indicating canopy height at increasing distance from the patch 646
leading edge. 647
Figure 2:Schematic diagram of the four spatial configurations of aquatic macrophytes in the test 648
section of the flume. Light green indicates patches of Groenlandia (sparse canopy), and dark green 649
indicates patches of Callitriche (dense canopy). Diagonal lines indicate the boxes in which plants were 650
rooted. Black circles are locations of plant specimens removed after the incubations experiments for 651
assessment of NH4+ uptake rates, and of Acoustic Doppler Velocimeter (ADV) profile measurements. 652
Numbers indicate mean (± SE) water velocity Ū(m s-1) and Turbulent Kinetic Energy (Turbulent KE) 653
(m2 s-2) within each species patch. 654
Figure 3:Scatter plots of NH4+ uptake rates (μmol g−1 (DM) h−1) against Total Kinetic Energy (Total 655
KE) (m2 s-2), depth-averaged velocity <Ū>(m s-1) and Turbulent Kinetic Energy (Turbulent KE) (m2 s -656
2) for the sparse Groenlandia (black circles) and the dense Callitriche (white diamonds). Black lines 657
are linear regression lines for the Groenlandia (solid line) and Callitriche (dotted line) data separately 658
and represent significant relationships (p 0.05). 659
Figure 4:Boxplots of the distribution of NH4+ uptake rates (μmol g−1 (DM) h−1) within patches of the 660
dense Callitriche (a) and the sparse Groenlandia (b) in each spatial configuration (S indicating sparse 661
vegetation, D indicating dense vegetation, see Figure 2). Letters denote significant differences (Tukey’s 662
HSD, p < 0.05). 663
Figure 5:Scatter plots of channel total NH4+ uptake rates (μmol g−1 (DM) h−1) in each spatial 664
Groenlandia in each spatial configuration (S indicating sparse vegetation, D indicating dense 666
vegetation, see Figure 2). Error bars represent standard error of the mean. 667
Figure 6:Schematized drawing of the effects of multispecific spatial patchiness on hydrodynamics and 668
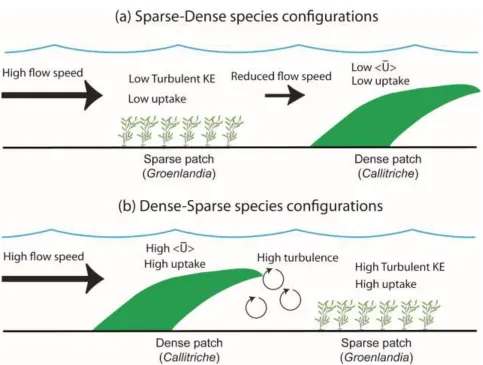
nutrient uptake rates. In Sparse-Dense configurations (a), the sparse vegetation is exposed to high mean 669
flow but low turbulence, and does not benefit from being located at the leading edge. Similarly, the 670
dense vegetation is exposed to low mean flow speed due to sheltering by the patch upstream, and hence 671
has lower uptake rates. Instead, in Dense-Sparse configurations (b), uptake rates of both species are 672
higher: the dense vegetation benefits from being at the leading edge and exposed to high mean flow 673
speed (which increases uptake rates); at the same time, the sparse vegetation benefits from the high 674
turbulence created in the wake of the dense patch. 675
Tables 679
Table 1 Summary of patch characteristics [mean ± SD (n)] of the two species at the incoming flow 680
velocity of 0.24 m s-1 used in the flume experiments: biomass (g DW m-2; measured), canopy height (h, 681
m; measured), frontal area per water volume (a, m-1; calculated from Eq. 3), frontal area per bed area 682
(ah, dimensionless; calculated from Eq. 4). 683
Biomass (g DW m-2)
Canopy height (h, m)
Frontal area per water volume
(a, m-1)
Frontal area per bed area
(ah, dimensionless)
Groenlandia 97 ± 28 (3) 0.070 ± 0.010 (9) 0.090 ± 0.007 (2) 0.031 ± 0.003 (2)
Callitriche 318 ± 67 (3) 0.170 ± 0.080 (5) 0.571 ± 0.101 (2) 0.200 ± 0.035 (2)
Table 2 Pearson’s correlation coefficients between NH4+ uptake rates (μmol g−1 (DM) h−1) and canopy 685
height (cm) or hydrodynamic parameters (depth-averaged velocity <Ū> [m s-1]; Reynolds shear stress 686
τxz [Pa]; Turbulent Kinetic Energy (Turbulent KE) [m2 s-2]; Total Kinetic Energy (Total KE) [m2 s-2]
687
and canopy water flow Qc [m3 s-1]) for Groenlandia, Callitriche and both species considered together.
688
Correlation coefficients in bold are significant at p ≤ 0.05. 689
Groenlandia (n = 24) Callitriche (n = 24) All (n = 48)
Height 0.17 -0.18 -0.30
<Ū> -0.20 0.42 0.40
τxz 0.01 -0.18 0.03
Turbulent KE 0.68 0.34 0.53
Total KE 0.79 0.45 0.54
Qc -0.07 0.19 -0.09
Figures 692
693
Figure 1 (A) Natural patches of Callitriche and (B) Groenlandia in the field. (C, D) Lateral view of the 694
two patches, with the black outline indicating canopy height at increasing distance from the patch 695
697
Figure 2 Schematic diagram of the four spatial configurations of aquatic macrophytes in the test 698
section of the flume. Light green indicates patches of Groenlandia (sparse canopy), and dark green 699
indicates patches of Callitriche (dense canopy). Diagonal lines indicate the boxes in which plants were 700
rooted. Black circles are locations of plant specimens removed after the incubations experiments for 701
assessment of NH4+ uptake rates, and of Acoustic Doppler Velocimeter (ADV) profile measurements. 702
Numbers indicate mean (± SE) water velocity Ū(m s-1) and Turbulent Kinetic Energy (Turbulent KE) 703
705
Figure 3 Scatter plots of NH4+ uptake rates (μmol g−1 (DM) h−1) against Total Kinetic Energy (Total 706
KE) (m2 s-2), depth-averaged velocity <Ū>(m s-1) and Turbulent Kinetic Energy (Turbulent KE) (m2 s -707
2) for the sparse Groenlandia (black circles) and the dense Callitriche (white diamonds). Black lines 708
are linear regression lines for the Groenlandia (solid line) and Callitriche (dotted line) data separately 709
711
Figure 4 Boxplots of the distribution of NH4+ uptake rates (μmol g−1 (DM) h−1) within patches of the 712
dense Callitriche (a) and the sparse Groenlandia (b) in each spatial configuration (S indicating sparse 713
vegetation, D indicating dense vegetation, see Figure 2). Letters denote significant differences (Tukey’s 714
HSD, p < 0.05). 715
717
Figure 5 Scatter plots of channel total NH4+ uptake rates (μmol g−1 (DM) h−1) in each spatial 718
configuration against Total Kinetic Energy (m2 s-2) averaged within patches of Callitriche and 719
Groenlandia in each spatial configuration (S indicating sparse vegetation, D indicating dense 720
vegetation, see Figure 2). Error bars represent standard error of the mean. 721
723
Figure 6 Schematized drawing of the effects of multispecific spatial patchiness on hydrodynamics and 724
nutrient uptake rates. In Sparse-Dense configurations (a), the sparse vegetation is exposed to high mean 725
flow but low turbulence, and does not benefit from being located at the leading edge. Similarly, the 726
dense vegetation is exposed to low mean flow speed due to sheltering by the patch upstream, and hence 727
has lower uptake rates. Instead, in Dense-Sparse configurations (b), uptake rates of both species are 728
higher: the dense vegetation benefits from being at the leading edge and exposed to high mean flow 729
speed (which increases uptake rates); at the same time, the sparse vegetation benefits from the high 730
turbulence created in the wake of the dense patch. 731
Supporting Information
733 [image:40.612.71.467.118.407.2]734
Figure S1: Frequency distribution of patch length (m) for Callitriche and Groenlandia (n = 20) in field 735