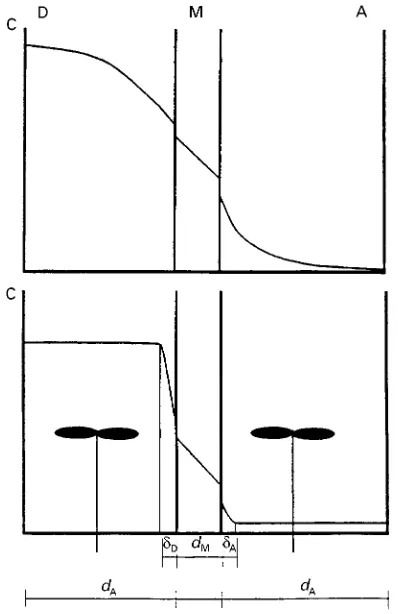
Figure 1 Dialysis between quiescent and stirred solutions. C, concentration; D, donor solution; A, acceptor solution; M, mem-brane;dA,dD anddM; thicknesses of the corresponding phase layers,AandD; thicknesses of the diffusional boundary layers.
Polymer Membranes
See II / MEMBRANE SEPARATIONS / Gas Separations with Polymer Membranes
Reverse Osmosis
U. Spohn, Institute of Biotechnology, University of Halle, Germany
This article is reproduced fromEncyclopedia of Analytical Sciences, Copyright Academic Press 1995
Dialysis and reverse osmosis
Dialysis is a separation process with increasing areas of application in clinical, biochemical and environ-mental analysis. A donor and an acceptor solution are separated by a semipermeable membrane (Figure 1).
When the solutions have different solute activities a diffusional membrane transport from the more to the less concentrated solution takes place to establish the thermodynamic equilibrium. In most applications mass transfer to and away from the separation mem-brane is accelerated convectively by stirring or by the use ofSow-through separation cells.
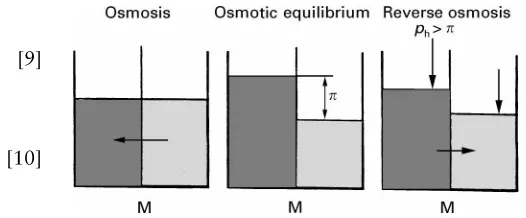
When the solutions have different solvent activities an osmotic pressure is built up, which causes a solvent
Sow to the solution of the lower solvent activity. This process is termed osmosis. Reverse osmosis is deRned as a process during which an outer pressure is applied to force the solvent through a membrane, which is permeable to the solvent and rejects the solute. Reverse osmosis is applied to purify water for laboratory use and is very promising as a preconcentration technique in trace and environ-mental analysis.
Fundamentals
Thermodynamic Aspects
During dialysis the activities of the solute i in the donor and the acceptor solutions differ. The differ-ence between the chemical potentialsi,Dandi,Ais the free enthalpy per mole, which propels the dialysis. The dialysisRnishes when the thermodynamic equi-librium shown in eqn [1] is reached:
i,D"i,A [1]
The equilibrium constantKHi depends on the activity coefRcientsfi,Dandfi,Aand the absolute temperature Taccording to eqn [2]:
KHi" ai,A ai,D"
fi,A;ci,A fi,D;ci,D"
exp
0 i,D!0i,ART
[2]where0
Figure 2 The principles of osmosis and reverse osmosis. M, membrane;ph, outer pressure;, osmotic pressure difference.
, Aqueous salt solutions; , water.
according to eqn [3],is of analytical interest:
Ki" ci,A ci,D
[3]
The activity coefRcientsfidepend on the solvent, the ionic strengthI"zjcjof the solution and the con-centrations of all nondissociated solutes. The general index, j, labels the ions in the system with the electric chargezj. Because in most cases:
0
i,D!0i,A"0 [4]
it follows that:
KHi"1 [5]
and:
Ki" fi,D fi,A
[6]
Kidiffers from unity when the dialysis equilibrium is coupled to other equilibria and/or the activity coefR -cientsfi,Dandfi,Aare different. Without coupled push-ing and trapppush-ing reactions the enrichmentEand the puriRcation factor P can be calculated according to eqns [7] and [8]:
E"ci,A ci,D,0
"(ci,D,0!ci,D)VD/VA ci,D,0
[7]
P"ci,D,0!ci.D
ci,D,0 "
(ci,A!ci,A,0)VA/VD ci,D,0
[8]
whereci,D,0andci,A,0are the initial solute concentra-tions in the donor and in the acceptor solution, re-spectively, and VA and VD are the volumes of the corresponding solutions. The maximum enrichment factor is around 0.5 for VA4VD. The puriRcation factor increases up to unity with the increasing ratio ofVAtoVD.
The chemical activities of the solvent are equal at dialysis equilibrium. According to eqn [9]:
L,D"L,A [9]
and because:
0
L,D"0L,A [10]
it follows for the solventLthat:
KHL"exp
1
RTVL,DD!VL,AA
[11]whereVL,DandVL,Aare the partial molar volumes of the solvent which are equal toVLfor dilute solutions, and refers to the osmotic pressure. It therefore follows that:
KHL"exp
VL
RT(D!A)
[12]with the osmotic pressure difference " D!A. A volume change is effected to equilibrate the donor and the acceptor solutions. can be cal-culated for every solution according to eqn [13]:
"!(RT/VL) lnax,L [13]
where ax,L is the activity (xLfL) of the solvent with respect to the mole fractionxLof the solvent. There-fore the osmotic pressure differencehas to be taken into consideration to calculate precisely almost all dialysis equilibria. The osmotic pressure difference causes a solvent Sow through the separation mem-branes up to the state at which the hydrostatic back-pressure compensates for the osmotic back-pressure. e.g. in the batch-type arrangement shown inFigure 2. If the pressureph is greater than the osmotic pressure the osmosis will be reversed. This reverse osmosis reaches an equilibrium, which can be described by eqn [14]:
KHL"exp
VL
RT(!ph)
[14]Obviously the equilibrium constant decreases with increasing pressure ph. When the solute is rejected by the membrane it can be enriched in the donor solution.
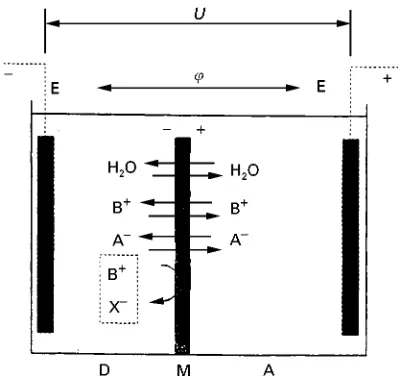
Figure 3 Domain dialysis across a microporous membrane., Donnan potential; E, electrodes;U, outer voltage.
two solutions of a dissociating salt BA and one solu-tion contains a rejected ion X\, an electric potential difference"D!Ais built up between the solu-tions. This Donnan potential inSuences the effective separation ratio K. The equilibrium constant is shown in eqn [15] with the Faraday constantF:
KHi"exp[(D!A)ziF/RT] [15]
whereFis the membrane area that is in contact with the solutions.
An outer electrical voltage U generates an elec-tromigration of the anions to the positively charged anode and of the cations to the negatively charged cathode (Figure 3). The process is termed elec-trodialysis. If the potential difference between the electrodes U is smaller than the voltage UD of the water decomposition a new electrochemical equilib-rium is built up with the constant shown in eqn [16]:
KHi"exp[(D!A#U)ziF/RT] [16]
In many practical applications the dialysis equilib-rium is coupled with chemical equilibria, e.g. acid}base, redox, complexation and precipitation equilibria. It should be noted that distribution equi-libria between two different solvents and phases can also be exploited to shift the overall distribution ratio
Ki between the donor and acceptor solutions. The enrichment factor Ecan be increased by several or-ders of magnitude. The thermodynamics of the separ-ation processes enable the attainable maxima of the enrichment and the puriRcation factors to be esti-mated.
Mass Transport
Dialysis For quiescent donor and acceptor solutions the equilibration time ranges from minutes to several hours and is dependent on the geometrical size of the donor and acceptor chambers and the membrane permeability. In this case the equilibration is domin-ated by the slow diffusional analyte transport. The equilibration can be accelerated by convective mass transport according to Figure 1. Intensive stirring of both the acceptor and the donor solutions establishes diffusional boundary layers of thickness on the membrane. The diffusional boundary layer can also be established in Sow-through dialysis cells or on rotating dialysis membranes.
The overallSux of the substance i with its molar amount nifrom the donor to the acceptor solution can be described according to eqn [17]:
Ji" dni
dt"kF
i,Dci,D! i,Aci,AKAM KDM
[17]
where i,Dand i,Aare the fractions of the substance i in the donor and in the acceptor solutions respective-ly, that can permeate through the separation mem-brane. KDM and KAM are the distribution constants between the donor solution D and the membrane M and between the acceptor solution A and the membrane, respectively. The overall mass transfer coefRcientk can be derived from eqn [18]:
1
k"
1
kD
kD D
kD D#kD(1! D)
# 1kMKDM
# KAM
kAKDM
kA A
kA A#kA(1! A)
[18]
where 1! D is the rejected fraction of substance i, 1! Ais the corresponding fraction that is trapped in the acceptor solution, andkD,kMandkAare the mass transfer coefRcients of the permeating fractions of substance i for the donor, the membrane and the acceptor phases, respectively.kAandkDare the mass transfer coefRcients for the so-called inactive form of substance i, which cannot permeate the membrane. In many cases the mass transfer across the phase bound-ary is to be considered additionally, e.g. for homo-geneous membranes, supported liquid membranes (SLM) and gas-Rlled microporous membranes. Then the expression shown in eqn [19] should be added to the right term of eqn [18]:
a" 1
kpDM# 1
kpAM KAM KDM
kpDMandkpAMare the phase transfer coefRcients from the donor solution into the membrane phase and from there into the acceptor phase, respectively.
From the general equation some cases of analytical interest can be deduced.
Example 1: Dialysis Through Hydrophilic and Microporous Membranes. Because D" A"1,
KDM"KAM"1 and no phase transfer takes place,
eqn [18] can be simpliRed to eqn [20]:
1
k"
1
kD
#k1
M
#k1
A
[20]
For large concentration gradients (cD!cA)/dM and very intensive stirring in the set-up shown in Figure 1 or inSow-through dialysis cells with highSow-rates the membrane diffusional transport becomes rate-determining particularly for relatively thick mem-branes with small pores. Eqn [21] then follows:
k"kM [21]
Example2: Dialysis of Volatile Substances Through Hydrophobic and Microporous membranes. To sep-arate a nonvolatile base B\, its corresponding volatile acid BH is produced according to the equilibrium:
B\#H#8BH
The donor pH value is chosen according to eqn [22] so that there is a 99.9% degree of conversion into the permeable form of the analyte:
i,D"
10\pH 10\pH#K
a'
0.999 [22]
Kais the acid-dissociation constant of BH.
The acceptor pH value should be adjusted accord-ing to eqn [23] to trap the analyte in its nonvolatile form:
1! i,A"
Ka Ka#10\pH
'0.999 [23]
Since only the volatile part of the analyte amount can traverse the membrane, it follows that:
Ji"kFci,D [24]
with:
1
k"
1
kD# 1
kMKDM# KAM kAKDM#
a [25]
The distribution ratiosKDMandKAMare correlated to the concentrations i,D;ci,1,D and i,A;ci,1,A of the volatile forms in the donor and in the acceptor solu-tions, respectively:
KDM"
ci,g,D
i,Dci,1,D+ pi,D
i,DRTci,1,D
[26]
KAM"
ci,g,A
i,Aci,1,A+ pi,A
i,ARTci,1,A
[27]
The right-hand terms of eqns [26] and [27] are ap-proximations for low partial pressurespi,Dand pi,A. ci,g,Dandci,g,Aare the concentrations of the analyte in the gas phase at the interface between the donor or the acceptor solution, respectively, and the mem-brane gas phase. For very small partial pressures
pi,D and pi,A,KAMKDM(pi,Dpi,A) and without hydrodynamic transport limitations, eqn [18] can be simpliRed to eqn [28]:
1
k"
1
kD# 1
kMKDM#
a [28]
For fast-Sowing donor solutions with 1/kDP0 the mass transport is determined by the gas diffusion through the membrane, the partial pressure of the analyte in the donor solution and the phase-transfer resistances. The partial pressure of the volatile analyte can be increased by decreasing the partial pressure of the water using high ionic strengths in the donor solution. For highly volatile analytes, thin and highly porous membranes, and fast-Sowing solutions, the overall mass transport is controlled by the phase transfer resistance (k"1/a).
Reverse osmosis The driving force of reverse osmo-sis is the difference between the outer pressurephand the osmotic pressure difference. The mass transfer can be described according to eqn [29]:
JL"PF(ph!fR) [29]
where JL is the mass Sux of the solvent through the separation membrane and P is the water permeability of the membrane. The osmotic pressure difference is multiplied by the reSection coefRcient
fR, which is a measure of the solute rejection by the membrane. During the enrichment process in the donor solution the osmotic pressure difference increases. The driving force decreases. When the rejection is sufRciently high, the reSection coefRcient
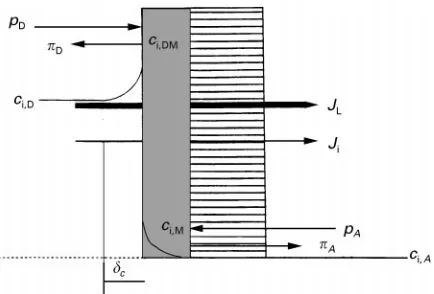
Figure 4 Reverse osmosis with concentration polarization on the asymmetric separation membrane.Ji, mass flux of the solute; pD, outer pressure from the donor solution;pA, outer pressure from the acceptor solution;DandA, osmotic pressures of the donor and the acceptor solution respectively;c, thickness of the polariza-tion layer; ci,D, solute concentration in the donor solution;ci,DM, solute concentration on the membrane;ci,M, solute concentration in the separation membrane. See text for further explanation.
Table 1 Dialysis procedures
Objectives in a microanalytical scale Donor solution Acceptor solution
Purification Quiescent or slowly flowing, small
sample volume
Flowing or stirred, large volume
Enrichment Flowing or stirred, large sample volume Slowly flowing or gently stirred, small volume Reagent addition Stirred or flowing, large reagent volume Quiescent or slowly flowing, small volume
Separation Quiescent or slowly flowing, small
sample volume
Quiescent or slowly flowing, small volume
deRned by eqn [30]:
R"1!ci,A
ci,D,0
[30]
where ci,A is the solute concentration in theRltrate, and ci,D,0 is the initial concentration in the donor solution. The rejected solutes accumulates on the membrane surface (Figure 4). This is the so-called concentration polarization phenomenon, which can be described approximately according to eqn [31]:
JL"kLln[(ci,DM!ci,A)/(ci,D!ci,A) [31]
where ci,DM is the solute concentration on the mem-brane surface andkLis the mass transfer coefRcient. The concentration up to the saturation level will cause the precipitation of the solute. The precipitated solute forms a secondary layer on the membrane, which reduces the solvent mass transferJL. Therefore the concentration polarization must be reduced by a forced convectiveSow.
The analytical usefulness is based on the high en-richment factorE, which can be achieved following by eqn [32]:
E"ci,D
ci,D,0
" VD,0
VD,0!VA
[32]
whereVD,0is the initial volume of the donor solution.
Geometric Aspects
The geometric shape and extent both of the donor and the acceptor chambers is decisive for the effec-tiveness and time of the entire separation process. The geometry has to be adapted to the particular analyti-cal task (Table 1). To minimize the separation time the thickness of the donor solution layer should be as thin as possible. The ratio of the membrane exchange area to the donor solution volume should be maxi-mized. To maximize the enrichment factor for dialy-sis with enhanced selectivity the volume ratio be-tween the donor solution and the acceptor solution has to be maximized.
In this respect, thin hollow-Rbre membranes are especially useful both for enrichment and puriRcation procedures. Thin-layer chambers with Sat mem-branes are also useful and enable a greater variety of different membrane materials to be used. The minia-turization of the membrane exchange area up to the micro or the ultramicro scale enables reproducible sampling from quiescent or slowlySowing solutions to be performed. This is of great importance for
in vivosampling with microdialytic probes.
Figure 5 shows frequently used hollow-Rbre and
Sat-membrane set-ups. Table 1 summarizes the most useful procedures for dialysis.
The Separation Membrane
The dialytic transport across thin membranes can be described in eqn [33]:
Ji" dni
dt"kMF(ci,MD!ci,MA) [33]
Figure 5 Frequently used dialysis set-up: (A) meander cell with a flat membrane, (B) dialysis probe with a flat membrane M, (C) hollow fibre membrane cell, (D) hollow fibre dialysis probe.ID,IA, inlets to the donor and the acceptor chamber;OA,OD, outlets from the acceptor and the donor chamber.
Table 2 Membrane transport and selectivity
Membrane material Transport mechanisms Factors which determine the selectivity
Hydrophillic and porous Diffusion through micropores (kM"Dm/dM)
Sieve effect Hydrophobic and porous membranes,
filled with an organic solvent
Diffusion through micropores Solubility and sieve effect As before, but with selective ligands
in the solvent
Diffusion through micropores Solubility, complexing and sieve effect, co-ion transport
Hydrophobic and gas-filled porous membranes
Gas diffusion and flow Volatility
Ion exchange membranes Retarded diffusion through micropores Ion exchange and Donnan exclusion Homogeneous and hydrophobic
membranes
Solvation and diffusion of gases and hydrophobic solutes with small molecular masses
Solubility in the membrane material
, Membrane porosity;, membrane tortuosity;dM, membrane thickness;Dm, diffusion coefficient. acceptor solutions, respectively. Linear concentration
gradients can be assumed in thin membranes. The separation membrane should be considered particularly with regard to selectively but also with regard to the overall mass transfer kinetics. The mem-brane material determines the transport mechanism, which inSuences the selectivity of the separation pro-cess in particular. Table 2 gives an overview about the most important membrane materials and the dominant transport mechanisms. Classic dialysis through microporous membranes causes a loss of sensitivity with respect to the following detection or determination procedure. So-called selective dialysis
across gas-Rlled membranes or SLMs enables an analyte enrichment to be performed. The selectivity of the SLM technique can be enhanced by the addi-tion of selectively reacting ligands to the liquid mem-brane phase. When charged ions are complexed and transported through these membrane systems elec-troneutrality must be maintained. In many cases ion pairs with selected counter ions are transported through the membrane. When the ligand is dissolved in the liquid membrane phase and the counter ion cannot transverse the membrane the analyte ion transport is coupled with a back-diffusion of an ion with the same electric charge. A similar situation can be found in ion-exchange membranes, which are used to enrich ions by Donnan dialysis.
Gas dialysis through hydrophobic and micropor-ous membranes is a fast transport process compared with the other transport mechanisms. The diffusion constants in the gas phase are several orders of magni-tude greater than in liquid and solid phases. The selectivity of the membrane transport is determined by the ratio of the partial pressurepiof the analyte to the total pressurepin the membrane pores. In small pores the condensation and adsorption kinetics of the gases also have to be taken into account.
Gas dialysis across homogeneous membranes is gen-erally more selective. The different solubilities of the gases in the membrane material are additional selec-tion factors. The mass transport rate is considerably smaller than those in microporous membranes.
Applications
Dialysis
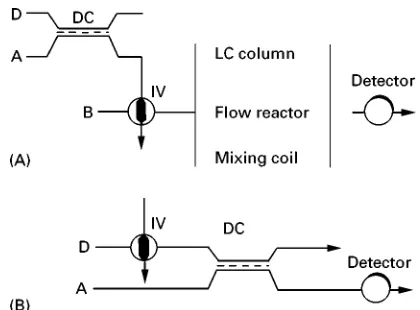
[image:6.568.49.514.545.699.2]Figure 6 Continuous (A) and pulsed dialysis (B) in flow analyti-cal set-ups. IV, injection valve; DC, dialysis cell; B, carrier solu-tion. See text for further explanations.
The dialysis module can be placed prior to or in the sample insertion unit, between the sample insertion unit and the reaction/separation zone and also into the detector zone. Figure 5A shows a typical S ow-through dialysis cell, which is inserted in many online conRgurations with liquid chromatography (LC) and
Sow injection analysis (FIA), e.g. as shown in
Figure 6. In Figure 6A the dialysis cell is working continuously. The acceptor stream is connected to the injection valve, which adds the prepuriRed sample into a nonsegmented carrierSow stream. This conR g-uration is frequently used in LC systems. The sample substances are continuously separated from higher molecular weight substances, precipitations and microorganisms. Therefore dialysis is useful to pre-vent blocking and prolong the lifetime of the separ-ation column. The continuous dialytic sample pret-reatment opens up an effective way to use FIA sys-tems for the online process monitoring of animal cell cultures and other industrial bioprocesses. In many cases food, clinical and environmental samples can be analysed without cumbersome ofSine sample pret-reatment. To circumvent the increased detection limit, which is caused by the inherent dilution, the dialysis cell can be used as aSow-through reactor, in which the analyte is trapped as a more sensitively detectable derivate. The acceptor stream can be stop-ped for different times to control the reaction time. The separated analytes, e.g. phenol derivatives or aSatoxins, can also be reconcentrated on a solid-phase extraction column, which is inserted into the sampling loop of the injection valve. Also highly speciRc preconcentration columns, e.g. with immobi-lized antibodies, can be used.
In Figure 6B the dialysis membrane is contacted only during short concentration impulses with the sample solution. The probability of membrane
foul-ing and cloggfoul-ing is decreased considerably. The sample solution is precisely diluted. This pulsed FIA dialysis is frequently used to adapt ion-selective elec-trodes, biosensors and miniaturized enzyme reactors to biological sample matrices.
A very promising and expandingReld of applica-tion was opened up by the so-called microdialysis technique. Miniaturized dialysis probes with tip dia-meters smaller than 1 mm are implanted into differ-ent tissues of living animals for sampling low molecu-lar weight substances from the tissue Suid. The low molecular weight analytes are separated across small membrane (cellulose acetate, cut-off 1000-60 000 Da) windows into aSowing acceptor stream, as shown in Figure 5B. The enrichment factor is con-trolled by the Sow rate (0.5}25L min\1). The microdialysis probes are coupled online to micro-column LC systems, to capillary FIA set-ups and recently also to capillary electrophoresis devices. In many cases the separated substances, e.g. lactate and glucose, are converted by enzymes which are dis-solved together with the cofactors and cosubstrates in the acceptor solution.
Donnan Dialysis
Donnan dialysis across ion exchange membranes is widely used as an efRcient suppression technique in ion chromatography. When a cation exchange membrane separates the eluent, which is an aqueous Na2CO3 solution, from a reservoir of strong acid, protons are transported into the eluent. Since the membrane is impermeable to anions, the cations from the eluent must diffuse simultaneously into the suppressor reservoir. The chromatographically separ-ated anions are combined with completely disso-ciated acids, which have a high equivalent conductiv-ity. The CO2\
3 ions are converted to the weakly dissociated carbonic acid. In cation chromatography the eluent, e.g. aqueous hydrochloric acid, has to be suppressed. Therefore an anion exchange mem-brane is used to separate the eluent from a sodium hydroxide suppressor solution. The anions of the eluent are replaced with hydroxide ions to increase the conductivity in the separation peaks and to sup-press the eluent conductivity by neutralization to water. Donnan dialysis across ion exchange mem-branes can also be used to neutralize strong alkaline and acid samples in an online sample pretreatment for ion chromatography.
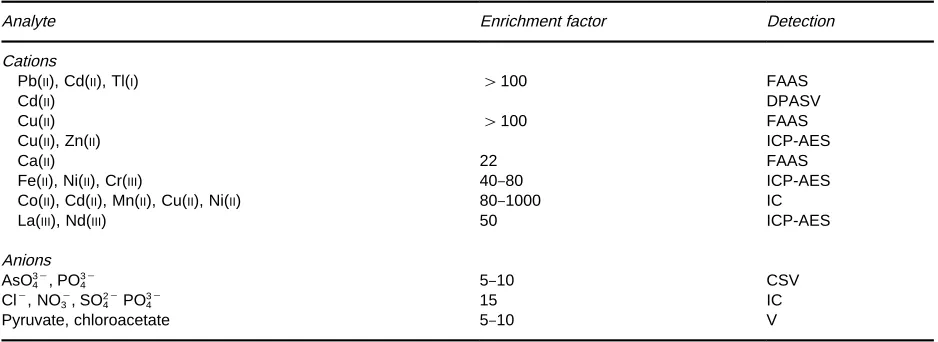
Table 3 Enrichment and sample pretreatment by Donnan dialysis (Cox (1992) and cited references)
Analyte Enrichment factor Detection
Cations
Pb(II), Cd(II), Tl(I) '100 FAAS
Cd(II) DPASV
Cu(II) '100 FAAS
Cu(II), Zn(II) ICP-AES
Ca(II) 22 FAAS
Fe(II), Ni(II), Cr(III) 40}80 ICP-AES
Co(II), Cd(II), Mn(II), Cu(II), Ni(II) 80}1000 IC
La(III), Nd(III) 50 ICP-AES
Anions AsO3\
4 , PO34\ 5}10 CSV
Cl\, NO\3, SO24\PO34\ 15 IC
Pyruvate, chloroacetate 5}10 V
IC, ion chromatography; FAAS, flame atomic absorption spectrometry; ICP-AES, inducutively coupled plasma-atomic emission spectrometry; ASV, anodic stripping voltammetry; DPASV, differential pulse ASV; CSV, cathodic stripping voltammetry; V, voltam-metry.
low ionic strength solution. Since the membrane is almost impermeable to anions, cations from the di-lute solution must diffuse back to the more concen-trated solution to maintain the electroneutrality. An-ions can be analogously separated by means of an anion exchange membrane.
Ions from dilute solutions, e.g. ground and drinking water samples, can be enriched into high ionic strength solutions with volumes which are smaller than the sample volume. The acceptor solu-tions can be adapted to whatever determination pro-cedure is to be used. Both Sat and tubular ion ex-change membranes are used, as shown in Figure 5A,B and D.
Tubular ion exchange membranes with a small inner diameter are particularly useful because of their high surface area to internal volume ratios. Such concentrators can readily be combined withSow ana-lytical set-ups, e.g. Sow injection analysis-atomic absorption spectrometry (FIA}AAS) and ion chromatography (IC) systems.
Because of the high osmotic pressure difference between the donor and the acceptor solution and the porosity of the ion exchange membranes a slow water
Sow takes place, which can be neglected in many analytical applications (Table 3).
It should be noted that the interaction between the diffusing ions and theRxed counterions in the mem-brane retards the diffusion, which can be accelerated by an alternating electric Reld with a frequency around 1 MHz. Multiply electrically charged ions, e.g. Mg2# and Al3#, decrease the interaction be-tween the sample cations and theRxed counterions, whereby the diffusional transport of the sample ca-tions is accelerated.
Selective Dialysis Across Solid and
Liquid Membranes
Selective dialysis is deRned here as a separation of substances from an aqueous donor phase into an aqueous acceptor phase, the phases being separated by solid and liquid membranes. The analyte transport through such membranes is based on a solva-tion/diffusion mechanism in a lipophilic phase. The liquid membranes have to be supported by a micro-porous and hydrophobic layer to enable practical applications to be performed. Again the basic set-up of theSow separation cells shown in Figure 5 can be used to apply these membranes for separation pro-cedures that can be coupled online to LC, gas chromatography (GC) and FIA set-ups.
Thin silicon rubber membranes can be used to separ-ate e.g. phenols and chlorphenols in a ‘push}pull’ procedure. The sample solution is acidiRed to shift the chemical equilibrium to the nondissociated phenol/ chlorphenol species, which are dissolved in the silicon membrane. The phenol molecules are trapped as phen-olate ions in an alkaline acceptor solution. The max-imum enrichment factor is determined by the pH values in the donor and the acceptor solution.
Nonpolar organic substances can also be separated from a sample donor solution into an acceptor solu-tion, but the enrichment factor can only be increased to values greater than 0.5 by addition of an organic solvent to the acceptor solution.
Table 4 Applications of supported liquid membranes
Analytes Conversion with Membrane transport Trapping by Detection
Mode A
Alcohols n-Heptane, supported by
microporous PTFE
GC, LC, SnO2-sensor
Mode B
Aminesa OH\ n-Decane, supported
by microporous PTFE
H# GC, LC, ph
Phenols H# n-Dodecane,
supported by microporous PTFE
OH\ LC, GC, ph
Carboxylates H# n-Nonane,
supported by microporous PVDF
OH\ LC, ph
Thiolates H# n-Dodecane,
supported by PVDF
OH\ a, GC
Mode C
Cu(II)b PAR n-Pentane, which
contains di-2-ethyl-hexylphosphoric acid and is supported by microporous PVDF
H# ph
Pb(II)c Anions Phenylhexane,
which contains bis(1-hydroxyheptyl-cyclohexano)-18-crown-6,
supported by microporous PTFE
EDTA AAS
aJoKnsson JA, LoKvkvist P, Audunsson G and Nilve G (1993) Mass transfer kinetics for analytical enrichment and sample preparation using supported liquid membranes in a flow system with stagnant acceptor liquid.Analytica Chimica Acta 277: 9}24.
bBarnes DE and Van Staden JF (1992) Flow injection analysis in the evaluation of supported liquid membranes.Analytica Chimica Acta 261: 441}451.
cIzatt RM, Bruening RL, Bruening MLet al. (1989) Modelling diffusion}limited, neutral}macrocycle}mediated cation transport in supported liquid membranes.Analytical Chemistry 61: 1140}1148.
a, amperometric: AAS, atomic absorption spectrometry; EDTA, ethylenediaminetetraacetic acid; GC, gas chromatography; LC, liquid chromatography; PAR, 4-(2-pyridylazo)resorcinol; ph, photometric; PTFE, polytetrafluoroethylene; PVDF, polyvinylidene fluoride.
environmental, food and clinical analysis. Table 4
summarizes some examples of application. Three modes of selective separation are used:
1. The extraction of a hydrophobic substances into the supported organic liquid phase and the following back-extraction into the aqueous acceptor stream. 2. ‘Push}pull’ separation. The analyte is converted
into a membrane-soluble substance, which dif-fuses through the membrane and is trapped as a substance that is insoluble in the membrane. 3. Co-ion mediated transport on the basis of a carrier
substance which is dissolved in the liquid mem-brane phase. The carrier molecules take up the analyte molecules or ions, whereby a hydrophobic complex or an ion-pair is formed.
Gas Dialysis
Gas dialysis can also be used for FIA procedures and otherSow analytical methods to enhance their
selec-tivity. The conRgurations shown in Figure 5 can be used to separate and enrich volatile or nonvolatile analytes, which can be converted into a volatile sub-stance.Table 5gives an overview of the applications of the gas dialysis technique to determine inorganic substances.
increas-Table 5 Applications of gas dialysis
Analyte Conversion to Trapping as or by Detection
Without conversion
ClO2, Cl2, Br2, I2 A colour or chemiluminescence
reaction or reduction
a, ph, c, pot
NO, NO2 Oxidation to NO\3 pot (ISE)
N2H4 Oxidation a, ph, c
Conversion by acid}base reaction
CN\ HCN CN\, Ag(CN)\2 c, pot (ISE)
SCN\ HSCN SCN\, colour forming reaction pot, ph
CO2, HCO\3, CO23\ CO2 HCO3\ c, pot (ISE), ph
NH3, NH\4 NH3 NH#4 , colour forming reaction or
oxidation
c, pot (ISE), pH ph, ch, a
NO\2 NO NO\2, NO\3 or colour forming reaction ph, pot (ISE)
H2S, HS\, S2\ H2S S2\ pot (ISE), a, c
ph HSO\3, SO23\ SO2 SO2, SO24\or colour forming reaction c, ph
F\ HF F\ pot (ISE)
Conversion by redox reactions
Cl\, OCl\, ClO\2, ClO3\, Br\, BrO\3, l\ Cl2, Br2, I2 I\, Br\and I\or Cl2, Br2, I2 pot (ISE), a a, amperometric: c, conductometric: ch. chemiluminometric: ISE, ion selective electrode: ph, photometric; pot, potentiometric.
ingly hydrophilized. Water penetrates into the mem-brane pores and changes the mass transfer coefRcients considerably with time. In some of these situations homogeneous membranes, e.g. different silicone rub-ber membranes, can be used to circumvent such inter-ferences. Silicone rubber membranes are permeable to hydrogen sulRde, hydrogen cyanide, carbon dioxide and many volatile organic compounds.
Osmosis and Reverse Osmosis
Diluted sample solutions can be concentrated by both osmosis and reverse osmosis. The concentration pro-cess is based on a pressure gradient over a membrane, which rejects the analyte molecules. High molecular weight substances are already rejected by ultraR ltra-tion membranes. But the typical applicaltra-tion of re-verse osmosis is the separation of low molecular weight substances from aqueous solutions to purify the water or to concentrate the substances which are to be determined.
To concentrate transition and heavy metal ions from dilute aqueous solutions by osmosis the sample solution is separated from a high ionic strength solu-tion by a membrane which is permeable only to the water. An osmotic pressure is built up, which then propels the water into the acceptor (Rltrate) solution and concentrates the donor solution. In a thin-layer
Sow-cell, which is similar to the cell shown in Figure 5A and has a mechanically supported separ-ation membrane (reverse osmosis membrane of
cellu-lose triacetate) preconcentration factors of up to 8}10 for copper(II), cadmium(II), manganese(II), nickel(II)
and zinc(II) can be achieved in a countercurrentSow
regime.
To implement reverse osmosis, an outer pressure (Figure 2) is applied to propel the water through the membrane. An interesting practical aspect is the pos-sibility of reducing the necessary outer pressure by an osmotic pressure difference which has the same direc-tion. This is implemented by high ionic strength ac-ceptor solutions.
The concentration factor E (eqn [32]) increases considerably with increasing reSection factors (eqn [29])). Highly diluted sample solutions can be concentrated to values that can be determined with the available determination methods. The sample solu-tion can be concentrated up to the precipitasolu-tion of the solute. Then an additionalRlter layer is used, which can be exchanged and directly analysed, e.g. by X-ray
Suorescence spectrometry. Transition metals could be analysed in drinking water up to the microgram per litre level. Organic contaminants, e.g. chlorobenzene and phenols in alkalized sample solutions, could also be concentrated by reverse osmosis. After this precon-centration traces of the contaminants could be ana-lysed by LC and GC after their redissolution.
Further Reading
[image:10.568.51.515.69.307.2]Figure 1 Cross-flow ultrafiltration. Particles in the feed that are larger than the rated pore size of the membrane are retained in the retentate stream while smaller particles pass through into the permeate. (Adapted from Cheryan (1998) with permission from Technomic.)
(eds)Preconcentration Techniques for Trace Elements, pp. 301}331. Boca Raton: CRC.
Cox JA and Twardowski Z (1980) ElectricReld enhance-ment of Donnan dialysis. Analytical Letters 13(A14): 1283}1291.
Dasgupta P (1988) Approaches to ion chromatography. In: Tarter JG (ed.) Ion Chromatography, pp. 191}338. New York: Marcel Dekker.
JoKnson AJ, LoKvkvist P, Audunsson G and Nilve G (1993) Mass transfer kinetics for analytical enrichment and sample preparation using supported liquid membranes in aSow system with stagnant acceptor liquid.Analytica Chimica Acta277: 9}24.
Robinson T and Justice JB (1991) Microdialysis in the Neurosciences. New York: Elsevier Science.
Spohn U, Eberhardt R, Joksch B,et al. (1991) Enzymatic multichannel-FIA methods for on-line fermentation monitoring and control. In:GBF Monograph, vol. 14, pp. 51}62. Weinheim: Verlag Chemie.
Stec RJ, Koirtyohann SR and Taylor HE (1986) Preconcentration of trace elements from aqueous solutions by osmosis.Analytical Chemistry58: 3240} 3242.
Valcarcel M and Luque de Castro MD (1991) Non-chromatographic Continuous Separation Techniques. Cambridge: Royal Society of Chemistry.
Ultra
\
ltration
M.Cheryan, University of Illinois, Urbana, IL, USA
Copyright^ 2000 Academic Press
Introduction
UltraRltration (UF) is aRltration process that employs a membrane to fractionate liquid mixtures containing molecules that range in size from about 1000 daltons in molecular weight to 500 000 daltons. The mem-brane, made of either polymeric or inorganic mat-erials, is a semipermeable barrier containing pores of a certain size distribution that are used to retain or ‘reject’ components of the feed mixture that are larger than the rated pore size while allowing molecules that are smaller than the pores to pass through the mem-brane. This separation process is very simple (Figure 1) involving only the pumping ofSuids. The membrane is assembled in a particular conRguration and placed in a module, and the feed stream is pumped through the module over the membrane sur-face in a cross-Sow mode. The pressure forces solvent
(e.g. water) and solute molecules smaller than the pores on the membrane surface through the mem-brane into the ‘permeate’ stream while larger solutes are rejected and retained in the ‘retentate’ stream. The retentate is recycled through the module until the required degree of puriRcation, separation or concen-tration is achieved.
UltraRltration is similar in concept to other pres-sure-driven membrane processes such as microR ltra-tion, nanoRltration and reverse osmosis. However, as shown inFigure 2, the size range of the solutes that are retained by each membrane is different. Reverse osmosis (RO) membranes are designed to retain all components except for the solvent (e.g. water). It is essentially a concentration process. Owing to the osmotic pressure of the solutes retained by RO mem-branes, pressures needed to operate RO systems are typically 30}60 bar (450}900 lb in\2). NanoR ltra-tion (NF) membranes have slightly larger pores and are designed to allow monovalent salts such as sodium chloride to pass through, but retains divalent salts, disaccharides and dissociated organic acids. Pressures are usually lower, about 15}25 bar.
Micro-Rltration (MF) membranes retain components that are in suspension or in colloidal form, and is essential-ly a clariRcation process. Pressures are usually 1}4 bar.