* * •
* *
^¿L
eurostat
STATISTICS IN FOCUS
Population and social conditions
1997
ISSN 1024-4352
Beyond the predictable:
demographic changes in the EU up to 2050
The European Union has had a number of demographic surprises over the last 30 years. Fertility levels have dropped dramatically, life expectancy has continued to increase strongly and most Member States of the EU have become immigration countries. Consequently, the number of young people has declined significantly (by around 20%), whereas both those of working age and the elderly continued to grow in number.
What might happen in the next 50 years? Will the EU soon be confronted with a shrinking working age population? Will the under-20s be outnumbered by the over-60s? What can we say about the future demographic differences between EU countries ?
These and other questions are answered in this bulletin. Based upon five different but internationally consistent long-term population scenarios, a dozen principal future demographic trends are presented. A summary table concerning the key-assumptions of the scenarios can be found in the middle of this publication; a brief technical explanation is given at the end.
The EU's share in world population will continue to diminish
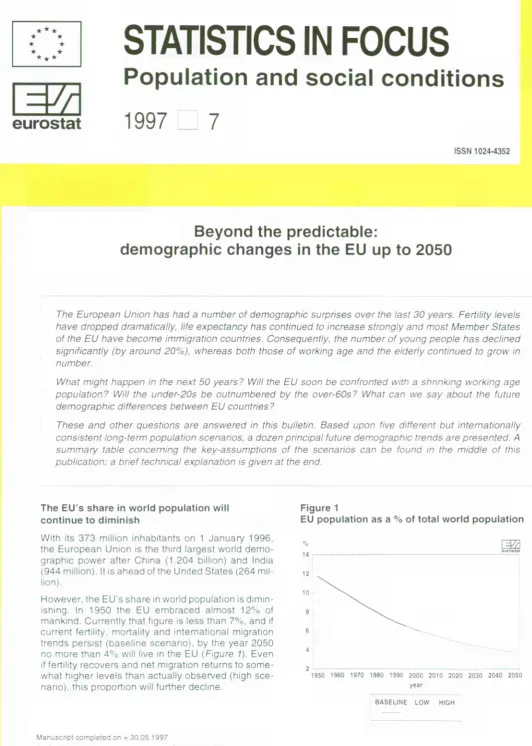
With its 373 million inhabitants on 1 January 1996, the European Union is the third largest world demo-graphic power after China (1.204 billion) and India (944 million). It is ahead of the United States (264 mil-lion).
[image:1.595.35.568.34.781.2]However, the EU's share in world population is dimin-ishing. In 1950 the EU embraced almost 12% of mankind. Currently that figure is less than 7%, and if current fertility, mortality and international migration trends persist (baseline scenario), by the year 2050 no more than 4% will live in the EU (Figure 1). Even if fertility recovers and net migration returns to some-what higher levels than actually observed (high sce-nario), this proportion will further decline.
Figure 1
EU population as a % of total world population
1950 1960 1970 1980 1990 2000 2010 2020 2030 2040 2050 year
BASELINE LOW HIGH
Manuscript completed on = 30.05.1997
For further information please contact: H.Cruysen / H.Eding
Eurostat, L-2920 Luxembourg, tel. 4301 -33527 Fax: 4301 -34029
Price (excl. VAT) in Luxembourg:Subscription 'Statistics in focus' of all themes: ECU 310
Subscription 'Statistics in focus' of Theme 2 'Population and social conditions': ECU 85 Single copy: ECU 6
Towards a shrinking population?
Figure 2 demonstrates that sooner or later total EU population will stagnate and decline. According to the low scenario, 'depopulation' will already occur within ten years, and by the year 2050 the total number of inhabi tants will be very close to that observed in 1950. The baseline scenario expects a population to peak around 2025, and a total population in 2050 close to the current one. Only the high scenario foresees a continu ous increase over the next five decades, resulting ir, an EU population of 444 million in 2050. This is 20% more than the current population.
Within the Union, future population growth will be farfrom uniform. According to the baseline scenario, Italy will be already confronted with a population decline within 12 years, whilst both Luxembourg and Sweden will escape this experience (Figure 3).
Figure 2
Total population - EUR 15
250
1950 1960 1970 1980 1990 2000 2010 2020 2030 2040 2050 year
Figure 3
First calendar year of population decline baseline scenario
^
ε o
m CH
C\J CO O o C\J C\J
CO CO O O C\J C\J
Table 1
Population at 1 January
\m
EUR 15
Belgium Denmark Germany Greece Spam France Ireland Italy Luxembourg Netherlands Austria Portugal Finland Sweden United Kingdom
Iceland Liechtenstein Norway
EEA
1995 O B S E R V E D
2000
L O W B A S E L I N E H I G H
2020
L O W B A S E L I N E H I G H
2050
L O W BASELINE HIGH
(1000)
371 575 10 131
5216 81 539 10 443 39 177 58 020 3 580 57 269 407 15 424
8 040 9 912 5 099 8816 58 504
267 31 4 348
376 221
373 791 10 171 5 271 82 323 10 539 39 239 58 815 3 594 56 911
428 15 684
8 076 9911 5 135 8 852 58 842
276 31 4 421
378 519
376 961 10 252
5 321 83 123 10 643 39 544 59 179
3 625 57 455 435 15 868
8 144
9 993
5 178
8 932 59 269
278 32
4 462
381 733
380 545 10 332
5 365 84 013 10 720 39 946 59 710
3 661 57 997 440 15 982
8 234 10 085
5 231
9 034 59 795
2 79 32
4 495
385 351
363 785 9 898 5 075 79 074 10 450 3 7 B 0 9 59 307 3 652 52 753 445 15819
7 882 9 808 5 008 8 792 58 013
294 32
4 494
368 605
388 232 10 658 5 526 84 670 11 269 40 307 62 831 3 909 56 543 501 17 204
8 443 10513 5 350 9 470 61 038
3 " 35
4 851
393 429
416 382 11 270 5 950 91 559 11 900 43 504 66 896
4 248 60 334 555 18319
9 231 11 265 5 777 10 248 65 326
326 38 5 156
421 902
303 475 8 378 4 296 63 420 9 060 30 451 52 349 3 095 40 457 408 13 747
6 6 1 0 8 582 4 178 7 964 50 480
26C 2 5 4 095
307 855
367 729 10 428 5 542 77 089 11 242 36 736 62 063 3818 49 287 563 17 564 8 241 10 681 5 078 10 082 59 315
3" 33 5 161
373 234
444 821 12 142 6 675 94 885 12 978 45 120 73 940 4 766 59 586 714 20 719 10 349 12 601 6210 12210 71 926
332 42 6 065
Deaths will outnumber births
The principal reason why the EU population will start to decline is the 'births deficit' of postwar generations. People born after 1945 have or are expected to have too few children to replace themselves. Therefore, sooner or later the number of deaths will start to exceed the number of live births (Figure 4).
If fertility levels continue to decrease (low scenario), this demographic break-even point will already have been reached in 1997. If fertility recovers considerably, to levels of about 1.95 children per woman (high scenario), natural population loss will not appear in the next 3-4 decades.
Several EU countries have already experienced natural decrease. Germany has been confronted with such a situation continuously since 1972. Currently Italy, too, is losing population through natural decrease.
In the short and medium term all the southern Member States will probably follow, as will Austria and Denmark. In the long run all other EU countries will face natural population decline.
Figure 4
Live births minus deaths - EUR 15
millions
1950 1960 1970 1980 1990 2000 2010 2020 2030 2040 2050 year
BASELINE LOW HIGH
Migration will continue to play a major role
Since the mid-1980s international migration has rapidly gained importance as a component of population growth. During the period 1990-1994, net migration (immigrants less emigrants) to the EU amounted to well over 5 million people. The contribution of migration to population growth rose to around 70%.
In all scenarios it is expected that Europe will remain an attractive region for immigrants. Basically depending on economic developments and migration policies, net mi gration will in the medium and long run vary between 400 and 800 thousand persons a year {Figure 5).
Due to diminishing economic disparities and the intro duction of some kind of burden sharing for asylum seek ers, the southern Member States will probably get a larger proportion of the total inflow. However, Germany will continue to be the most popular immigration country
(Table 3).
Figure 5
Net migration1 - EUR 15
Γ37Ά
1950 1960 1970 1980 1990 2000 2010 2020 2030 2040 2050 year
BASELINE LOW HIGH
Decline in total fertility will stop
During the last 30 years the EU reproductive patterns changed considerably. A fast and still-growing propor-tion of women had few children and postponed mother-hood. As a result the total fertility rate, which is affected by both the number and timing of births, has declined sharply to historically low levels of around 1.45 children per woman (Figure 6).
This trend will soon come to an end. If the vast majority of women born during the 1960s and 1970s are able to realise their family ambitions and therefore catch up rapidly with postponed births (high scenario), the total fertility rate could rapidly rise to levels very close to the observed average family size of women born in the early 1950s: 1.95 children per woman.
If these generations never catch up, and consequently around 30% of the women remain childless (low sce-nario), the total fertility rate will hardly change at all. In all scenarios it is assumed that current international fertility differences will persist. Therefore, in the long run the highest total fertility rates are expected in Finland, France, Ireland, Sweden and United Kingdom, and the lowest in Germany, Italy and Spain (Table 3).
Figure 6
Total fertility rate - EUR 15
children per woman 3.0
1950 1960 1970 1980 1990 2000 2010 2020 2030 2040 2050 year
Life expectancy will continue to increase; gender gap might diminish somewhat
Since 1945 life expectancy at birth in the EU has in-creased almost continuously. The total gain amounts to well over 10 years. Based on the recently observed mortality rates, women and men are expected to live on average 80 and 73.5 years respectively {Figure 7).
During the next 50 years a further fairly substantial increase in longevity might occur. If medicines, preven-tive and curapreven-tive health services, healthy life-styles, etc. continue to improve (high scenario), life expectancy at birth for women might reach around 87 years in 2050. For men maximum levels of around 83 years seem plausible, so that the gender gap might diminish some-what.
However, if the further development of positive influ-ences on mortality slows down shortly and is increasingly counteracted by negative influences such as cigarette-smoking and stress, progress in life expectancy could start to stagnate and the gender gap would then not narrow (low scenario).
Current differences between countries in life expectan-cies are assumed to remain stable (low scenario) or to narrow somewhat (baseline and high scenarios). So, Sweden and France (females only) continue to be the EU countries with the highest life expectancies, whereas the lowest levels are expected in Denmark, Ireland, Portugal and Finland (males only) (Table 3).
Figure 7
Life expectancy at birth - EUR 15
years 90
85
80
75
70
65
[333
FEMALES
MALES
1950 1960 1970 1980 1990 2000 2010 2020 2030 2040 2050 year
Fewer young people?
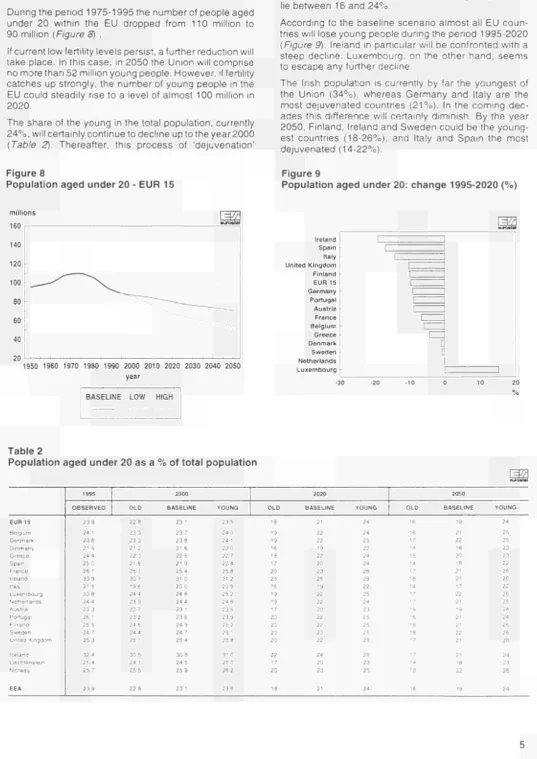
During the period 19751995 the number of people aged under 20 within the EU dropped from 110 million to 90 million (Figure 8) .
If current low fertility levels persist, a further reduction will take place. In this case, in 2050 the Union will comprise no more than 52 million young people. However, if fertility catches up strongly, the number of young people in the EU could steadily rise to a level of almost 100 million in 2020.
The share of the young in the total population, currently 24%, will certainly continue to decline up to the year 2000
(Table 2). Thereafter, this process of 'dejuvenation'
might stop. By 2050 the proportion of young people could lie between 16 and 24%.
[image:5.595.32.570.65.825.2]According to the baseline scenario almost all EU coun tries will lose young people during the period 19952020
(Figure 9). Ireland in particular will be confronted with a steep decline. Luxembourg, on the other hand, seems to escape any further decline.
The Irish population is currently by far the youngest of the Union (34%), whereas Germany and Italy are the most dejuvenated countries (21%). In the coming dec ades this difference will certainly diminish. By the year 2050, Finland, Ireland and Sweden could be the young est countries (1826%), and Italy and Spain the most dejuvenated (1422%).
Figure 8
Population aged under 20 EUR 15
Figure 9
Population aged under 20: change 19952020 (%)
1950 1960 1970 1980 1990 2000 2010 2020 2030 2040 2050 year
BASELINE LOW HIGH
30 I r e l a n d
S p a i n
I t a l y U n i t e d K i n g d o m
F i n l a n d
E U R 1 5
G e r m a n y
P o r t u g a l
A u s t r i a
F r a n c e
B e l g i u m
G r e e c e
D e n m a r k
S w e d e n
N e t h e r l a n d s
L u x e m b o u r g
I
Ì
ι
I I
ι
Í
L2 CZ
CZ
r~ c
[
l=M
M T M t a t
!
20 10 10 20
%
Table 2
Population aged under 20 as a % of total population
^
EUR 15
Belgium D e n m a r k G e r m a n y G r e e c e Spain France Ireland Italy L u x e m b o u r g Netherlands Austria Portugal Finland S w e d e n United Kingdom
Iceland Liechtenstein Norway
EEA
1995
O B S E R V E D
23.9
24 1
2 3 6 21.5
2 4 4
25.0 26.1 33.9 21.5 2 3 8
24 4
23.3 26.1 25.5
24 7
25.3
32 4 2 5 4
25.7
2 3 9
2000
O L D
22 9
23 3
23 3 2 ' 2
22 C 21 6
25 * 3 : ' 9 6 24 4
2 3 9 22 7
23 2 24 6 2 4 4
25 '
30 5 ¿4 '
25 5
22 5
B A S E L I N E
23 1
23 7
23 8 2 ' 6
22 5 21 9
25 4 3 ' : 2 : : 24 β 24 4
23 '
22 c 24 . 24 7
25 4
30 Β 24 :
25 9
23 ·
Y O U N G
23.5
24 :■ 24 1
22 0
22 7
2'¿ 4 25 S 31 2
23 5
25 2 24 6
23 5
23 9
25 2
25 1
25 ?
3' :
25 : 26 2
23 6
2020
O L D
• 8
•9 ' 9 •6 •8 17
2 C
23
•6 ' 9 19 ' 7
2 : 2 : 20 29
22
17
23
' 8
B A S E L I N E
2 ·
22 22
19
22 22 23 25
•9
22 22
20
22 22 23 22
24 20 2 3
2 '
Y O U N G
24
24
25 22
24 24
26 29
22 25
24
23 25 25 25 25
25 22 25
24
a u t w M
2050
O L D
16
' 6 17 •4 ' 5 14 17 •9 14 17
•5 •6 IB •3 17
17 •4
•e
16
B A S E L I N E
19
21
22
■ o
20 18 21 21 • 7
22
2 ' 19 2 ' 21
22
21
21 ■3
22
19
Y O U N G
24
25 25 23 23 22 25
26
22
26
25
24 2 4 26 26 26
24
23
26
Table 3: Key-assumptions used for long-term population scenarios
Total fertility rate LOW/OLD 1995 2000 2020 2050 BASELINE 1995 2000 2020 2050 HIGH/YOUNG 1995 2000 2020 2050
Life expectancy at birth LOW/YOUNG 1995 2000 2020 2050 BASELINE 1995 2000 2020 2050 HIGH/OLD 1995 2000 2020 2050
Life expectancy at birth, LOW/YOUNG 1995 2000 2020 2050 BASELINE 1995 2000 2020 2050 HIGH/OLD 1995 2000 2020 2050
Table 3: Key-assumptions used for long-term population scenarios NL 1.52 1.47 1.50 1.50 1.58 1.67 1.80 1.80 1.59 1 74 1.99 2.00 74.4 74.7 75.7 76.5 74.6 75.5 78.2 80.0 74.9 76.3 80.8 83.0 A I 1.36 1.34 1.37 1.40 1.39 1.52 1.60 1.60 1.44 1 71 1.90 1.90 73.2 73.7 75.2 75.5 73.6 74.5 76.6 80.0 74.0 75.3 80.3 83.0 p I 1.40 1.38 1.40 1.40 1.45 1.53 1.69 1.70 1.48 1.67 1.90 1.90 70.7 71.1 72.3 73.0 71.0 71.9 75.3 78.0 71.4 72.9 78.5 82.0 FIN 1.80 1.68 1.60 1.60 1 84 1.84 1.80 1.80 1.89 2.03 2.10 2.10
7 2 0 72.5 74.0 74.5 72.3 73.3 76.6 79.0 72.7 74.3 79.5 82.0
s I
1.70 1.63 1.60 1.60 1.74 1 81 1.90 1.90 1.78 1 98 2.10 2.10 75.6 76.2 77.7 78.0 75.9 77.0 78.9 82.0 76.4 77.6 80.4 85.0 UK 1.68 1.59 1.60 1.60 1.73 1.72 1.79 1.80 1.77 1.94 2.10 2 10 73.7 74.4 76.0 76.5 74.1 75.2 78.3 80.0 74.5 76.0 80.4 83.0 is I 2.07 1.87 1.80 1.80 2.12 2 0 8 2.08 2.10 2.15 2.24 2.30 2.30 76.0 76.5 77.9 78.5 76.4 77.3 8 0 2 8 2 076.7 77.9 82.4 85.0 FL 1.36 1.34 1.37 1.40 1.39 1.52 1.60 1.60 1.44 1 71 1.90 1.90 74.9 75.2 76.3 77.0 75.2 76.0 78.7 81.0 75.5 76.7 81.6 84.0 Ν I 1.82 1.65 1 60 1.60 1.85 1.85 1.89 1.90 1 90 1.96 2.09 2.10 74.4 75.0 76.4 77.0 74.7 75.8 79.0 81.0 75.0 76.5 81.3 84.0 EEA 1.42 1.40 1.43 1.45 1.46 1.55 1.66 1.67 1.50 1.75 1.94 1.95
T o t a l f e r t i l i t y rate
L O W / O L D
1995 2000 2020 2050
B A S E L I N E
1995 2000 2020 2050
H I G H / Y O U N G
1995 2000 2020 2050
Life e x p e c t a n c y at b i r t h , m a l e s
73.5 73.9 75.3 75.8 73.9 74.7 77.8 79.7 74.3 75.6 80.2 82.7
L O W / Y O U N G
1995 2000 2020 2050
B A S E L I N E
1995 2000 2020 2050
H I G H / O L D
1995 2000 2020 2050 80.3 80.5 81.3 82.0 80.5 81.1 83.3 85.0 80.7 81.7 84.9 87.0 79.6 80.1 81.2 81 5 79.9 80.7 82.4 85.0 80.2 81.4 84.9 8 7 0
78.0 78.4 79.6 80.0 78.2 79.0 81.9 84.0 78.5 79.8 83.5 86.0 79.6 80 1 81.2 81.5 79.8 80.7 83.3 85.0 80 1 81.4 85.1 87.0 80.8 81.2 82.5 83.0 81.3 81.8 83.4 86.0 81.5 82.3 86.3 88.0 79.2 79.7 81.0 81.5
7 9 5 80.3 83.2 8 5 0
79.8 81.0 84.6 87.0 81.6 82.5 83.8 84.0 81.9 83.1 86.0 87.0 82.1 8 3 5 87.1 88.0 81.5 81 9 83.1 83.5 81.7 82.5 84.8 86.0 81.9 82.9 87.0 88.0 80.3 80.7 81.7 82.0 80.6 81.3 83.6 85.0 80.8 81.8 85.9 87.0
Life expectancy at birth, females LOW/YOUNG
80.1 1995
80.5 2000
81.7 2020 82.2 2050
BASELINE
80.4 1995
81.1 2000 83.6 2020
85.1 2050
HIGH/OLD
80.7 1995
81.7 2000
85.1 2020
86.9 2050
13.0 10.0 20.0 20.0 13.5 33.4 35.0 35.0 14.0 56.8 50.0 50.0 12 1 9.9 15.0 15.0 13.3 14.8 22.5 22.5 17.2 26.4 30.0 30.0 4 5 5 8 20.0 20.0 5 0 12 1 25.0 25.0 5.5 28.6 30.0 30.0 3 0 -0 5 0 0 0 0 3 5 5 6 5.0 5 0 4 0 11.7 1 0 0 10.0 11.5 6 3 10.0 10.0 12.0 15.2 20.0 20.0 13.5 32.0 30.0 3 0 0
73.0 16.2 2 0 0 20.0 93.0 38.3 45.0 45.0 103.0 73.0 70.0 70.0 -1.3 0.0 0.0 0.0 -1.4 0.1 0.2 0.2 -1.5 0.2 0.3 0.3 0.0 0 0 0 0 0 0 0 1 0 1 ο 1 ο 1 0 1 0.1 0 1 0 1 6 5 4 0 4 0 4 0 7 0 8 4 8 0 8 0 7 5 12.9 12.0 12.0 652.4 414.8 400.0 400.0 767.3 687.9 600.0 600.0 875.9 1023.2 800.0 800.0
The working age population will sooner or later de cline
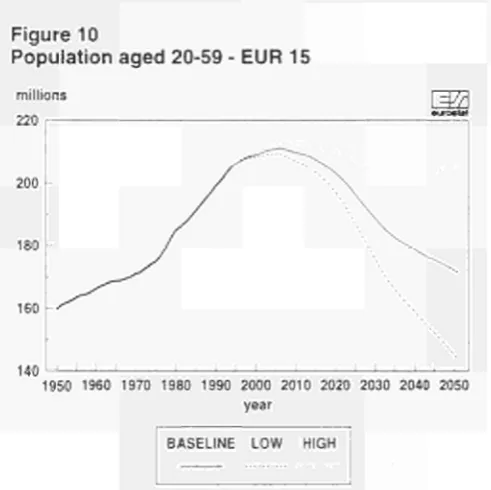
For decades the Union possessed a strongly increasing working age population (Figure 10). Since the mid 1970's average growth has amounted almost 1.5 million people a year.
In the near future this growth will slow down. Heavily depending on the net inflow of migrants, the average annual increase will drop to levels between 0.2 and 0.6 million people.
Immediately after 2005, when the first, large postwar 'babyboom' generations are leaving the workingage population, a fairly long period of decline will start. A stabilisation may take place around 2035, but only if fertility recovers structurally and net migration continues at rather high levels.
[image:8.595.32.278.183.428.2]Within the Union probably all countries except Luxem bourg will sooner or later be affected by this new demo graphic trend (Figure 11). Italy in particular might very soon be confronted with a sharply declining potential labour force.
Figure 10
Population aged 2059 EUR 15
Figure 11
Population aged 2059: change 19952020 (%)
[m
1950 1960 1970 1980 1990 2000 2010 2020 2030 2040 2050 year
BASELINE LOW HIGH
Italy Finland
G e r m a n y
B e l g i u m
D e n m a r k
E U R 1 5
A u s t r i a
N e t h e r l a n d s
U n i t e d K i n g d o m
F r a n c e
S p a i n S w e d e n
G r e e c e
P o r t u g a l I r e l a n d
L u x e m b o u r g
I Í
Í
cz
ld
-j
Σ3 Z3
I I
I
•uroet*
I !
10 10 15 20
[image:8.595.33.556.528.801.2]%
Table 4
Population aged 2059 years
XSA
EUR 15
Belgium Denmark G e r m a n y Greece Spain France Ireland Italy L u x e m b o u r g Netherlands Austna Portugal Finland S w e d e n United Kingdom
Iceland Liechtenstein
Norway
EEA
1995
O B S E R V E D
2000
L O W B A S E L I N E HIGH
2O20
L O W BASELINE HIGH
2050
L O W B A S E L I N E HIGH
(1000)
2 0 6 170
5 533 2 949 4 7 113 5 645 21 300 31 246 1 818 32 233 232 8 937 4 578 5 356 2 836 4 6 9 7 31 698
140 18 2 357
208 686
208 123
5 577 3 003 46 249 5 795 22 318 31 942 1 928 32 193 240 9 066 4 616 5 561 2 863 4 750 32 023
•45 ' 9
2 436
2 1 0 726
2 0 8 813
5 588 3 011 46 439 5 813 22 384
32 033 1 938 32 296 243 9 112 4 626 5 576 2 873 4 766 32 115
148 ' 9 2 445
211 425
209 564
5 609 3 020 46 650 5 835 22 451 32 121 1 953 32 394 245 9 158 4 651 5 6 0 0 2 884 4 797 32 197
' 4 8 ' 9
2 453
212 185
197 4 4 3
5 263 2 764 43 577 5 636 21 115 31 153 2 002 28 641 243 8 542 4 4 1 8 5 482 2 578 4 579 31 4 5 0
' 5 3 17 2 4 1 9
200 033
203 550
5 4 3 0 2 8 9 5 45 2 1 0 5 8 1 8 21 7 1 6 31 8 4 7 2 081 29 444 2 6 6 Β 988 4 5 7 7 5 646 2 661 4 789 32 181
156 18 2 520
206 2 4 4
210 3 8 8
5 592 3 0 1 5 47 0 4 5 5 9 7 3 22 4 5 0 32 7 0 8 2 174 30 2 6 3 2 8 8 9 3 6 2 4 8 1 3 5 8 5 6 2 750 5 0 5 9 33 0 4 0
157 20 2 6 1 4
213 179
145 747
4 085 2 206 30 958 4 297 13 857 24 785 1 4 6 9 18 679 207 6 8 1 2 3 235 4 283 2 081 3 949 24 842
118 ·· 2 040
1 4 7 9 1 6
172 825
4 950 2 760 36 736 5 2 4 4 16 597 28 776 1 784 22 4 8 5 279 8 5 1 6 3 988 5 127 2 434 4 9 1 9 28 230
136 •5 2 507
175 4 8 3
206 357
5 670 3 267 44 538 5 960 20 319 34 002 2 203 26 957 352 9 829 4 893 5 922 2 9 0 0 5 871 33 674
152 20 2 893
Ageing will accelerate
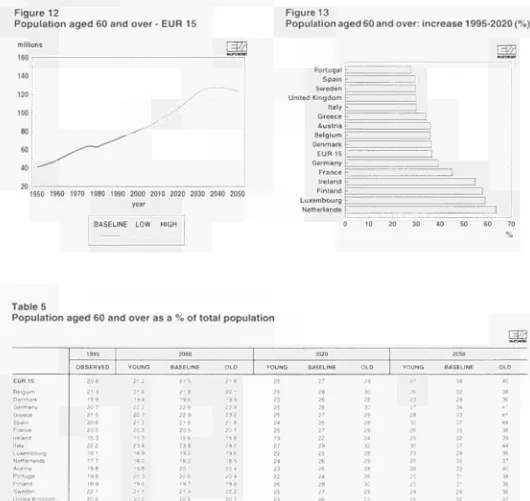
Apart from a short period of stagnation at the end of the 1970s, the EU population aged 60 and over has in creased continuously since 1950 (Figure 12). Currently the annual growth of the elderly population fluctuates around a level of 0.8 million persons, or 1%.
Up to 2005 this growth rate will hardly change. However, as soon as the 'babyboomers' start to enter this age group, the annual increase will shift to levels of around 1.1 million people. This will remain the case until the less numerous 'babybust' generations born in the early 1970s pass the age of 60.
The everincreasing share of the elderly in the total EU population will also accelerate during the period 2005 2030. From 2 1 % now and 22% in 2005, it is expected to rise to a level of around 27% in the year 2020 (Table 5).
[image:9.595.33.562.207.459.2]By 2050 the proportion might lie between 2740%. In all EU countries the number of old people will increase considerably (Figure 13). Particularly in the currently least aged Member States of the Union, Finland, Ireland, Luxembourg and Netherlands, the elderly population will grow rapidly. However, by 2050 Italy and Spain are expected to be the most aged EU countries (3044%).
Figure 12
Population aged 60 and over EUR 15
Figure 13
Population aged 60 and over: increase 19952020 (%)
millions
1950 1960 1970 1980 1990 2000 2010 2020 2030 2040 2050 year
10 20 30 40 50
'm
Portugal Spain Sweden United Kingdom Italy Greece Austria Belgium Denmark EUR 15 Germany France Ireland Finland Luxembourg Netherlands
I I
I
~ I
I i
I
j
I I I
I I
I I
. " ' ' i
60 70
%
Table 5
Population aged 60 and over as a % of total population
EUR 15
Belgium Denmark G e r m a n y Greece Spain France Ireland Italy L u x e m b o u r g Netherlands Austria Portugal Finland S w e d e n United Kingdom
Iceland Liechtenstein Norway
EEA
1995
O B S E R V E D
20.6
21.3
19.9 2 0 7 21 5 20.6
2 0 0
15.3 22.2
19.1
17.7 19.8
1 9 8 1 8 9 22.1 20.5
15.0 1 4 9 20.1
2 0 6
2000
Y O U N G
21 2
21 6
19 4
22 2
22 7 2 ' 2
20 2
15 3 23.4 18 9 18 ': ' 9 8
20 3
19 5
21 5
20 2
15 9
1 5 2 19 1
2 ' 2
BASELINE
21 5
2 ! 8 ' 9 6
22 6
22 9 2 ' 5
22 5
15 6 23 8
19 2 • 8 2
20 1 2" 6
19 7
21 9
20 5
i 6 0
15 5 ' 9 3
2 5
O L D
21 8
22 1
1 9 9 22 9 23 2
21 R
20 7
1 5 8
24 0 19 6
1 8 5 20 4 2C 9 ■9 fi
22 2
20 7
• 6 0 ' 5 8
1 9 6
21 9
2020
Y O U N G
25
25
23
25 25
24
25 19
27
22
24 23
22
26
25
23
25
24 23
24
BASELINE
27
28 26 28 27 26 27
22 29 25
26 2< 24 28 27 26
26 27
25
27
O L D
29
30 28 30
29
2 H
29
24 32
2 1 29
28 26 30
29
27
27 30 27
29
2050
Y O U N G
27
26 23 27 2B 30 26
25
30 23
25
26
25 25
24
25
30 28 24
27
B A S E L I N E
34
32
29
34 33 37 33 32 37
29
30 33 31 31
29
32
35 36
29
34
O L D
40
'«8 36 41 41 .14 38 39 44 36 37 4·
3fi
36 36 37
41 44 36
[image:9.595.33.563.208.709.2]Both the working age and the elderly population will become older
[image:10.595.233.542.83.714.2]During the next 20 years the age structure of the EU population aged 20-59 will change dramatically (Fi gure 14). At present about 45% of the working age population is more than 40 years old. By 2015 this proportion will reach levels of around 55%. Naturally, this trend is mainly due to the ageing of the large postwar baby-boom generations.
Figure 14
Population aged 40-59 as a % of population aged 20-59-EUR 15
[image:10.595.307.554.91.322.2]1950 1960 1970 1980 1990 2000 2010 2020 2030 2040 2050 year
Figure 15
Population aged 80 and over as a % of population aged 60 and over - EUR 15
1950 1960 1970 1980 1990 2000 2010 2020 2030 2040 2050 year
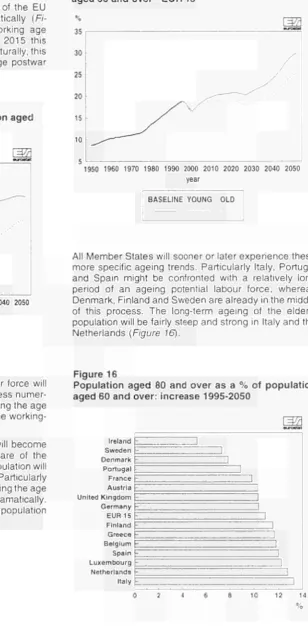
All Member States will sooner or later experience these more specific ageing trends. Particularly Italy, Portugal and Spain might be confronted with a relatively long period of an ageing potential labour force, whereas Denmark, Finland and Sweden are already in the middle of this process. The long-term ageing of the elderly population will be fairly steep and strong in Italy and the Netherlands (Figure 16).
After 2015 the ageing of the potential labour force will stagnate and probably even reverse as the less numer ous generations born in the 1970s are reaching the age of 40, while the baby-boomers are leaving the working-age population.
Also the EU population aged 60 and over will become older. After the turn of the century the share of the population aged 80 and over in the elderly population will increase almost continuously (Figure 15). Particularly after 2025, when the baby-boomers are passing the age of 80, the number of the 'very old' will rise dramatically. By the year 2050 their share of the elderly population might be more than one-third.
Figure 16
Population aged 80 and over as a % of population aged 60 and over: increase 1995-2050
~m
Ireland Sweden Denmark J
Portugal France I Austria United Kingdom Germany EUR 15 Finland ζΖ
Greece ζΖ Belgium ζΖ Spain JE Luxembourg Ε
Netherlands F I Italy E
10 12 14
[image:10.595.307.553.452.702.2]Age dependency will rise drastically
Figure 17 shows the observed and projected total age dependency ratio, i.e. the sum of the number of people aged 019 and 60+ expressed as a percentage of the population aged 2059. For the Union as a whole this indicator has decreased since mid 1970s from 100% to 80%, due to the sharply declining number of young people.
In the next ten years the ratio will be fairly constant but thereafter a steady and perhaps even strong increase might occur. Especially if current low fertility levels per sist and life expectancy structurally rises (old scenario),
the age dependency will in the long run climb to alltime high levels of well above 120%.
Figure 78 demonstrates that during the next 25 years the
increase in total age dependency will be far from uniform within the Union. The ratio will hardly grow in Portugal and Spain, whilst Finland and the Netherlands will prob ably have to cope with an increase well above the European average.
However, by the year 2050 Italy (107136%) and Spain (110138%) are expected to be the EU countries with the highest age dependency (Table 6).
Figure 17
Age dependency ratio EUR 15
Figure 18
Age dependency ratio: increase 19952020 (%)
1950 1960 1970 1980 1990 2000 2010 2020 2030 2040 2050 year
-15 -10 10 15
\m
Ireland Portugal Spain United Kingdom Greece Austria Sweden EUR 15 France Belgium Luxembourg Denmark Germany Italy Netherlands Finland
I
Q
3
1 1
!
1 1
1 1 1 1 , 1 1
1
20 25
%
Table 6
Age dependency ratio
m
EUR 15
Belgium Denmark G e r m a n y Greece
Spain
France Ireland Italy L u x e m b o u r g Netherlands Austria Portugal Finland S w e d e n United Kingdom
Iceland Liechtenstein Norway
EEA
1995
O B S E R V E D
80.2
83.1 7 6 9 73.1 85.0 8 3 9 85 7 9 6 9 77 7 75 1 72 6 7 5 6 85.1 79.8 8 7 7 8 4 6
90.2 67.5 84.5
80.3
2000
O L D
e : 3
83 0 76 '
5 e
82 5
76 5 84 6
87 0 ' " 6
78 5 "3 5 "5 7 "9 : "9 9 8" · 54 5
56 9
66 5
62 '
80 3
BASELINE
80 5
B3 5 ' 6 79 : 83 ι 76 7 84 7 87 0 77 9 78 7 " 4 · 76 ' 79 2 80 3 67 4 84 J
87 a
66 8 62 5
BC 6
Y O U N G
80 9
83 6
77 0
79 3
83 ·
77 2
85 4
86 8 "8 3
79 0
74 ' 76 3 79 3 80 8 8,' 5 85 0
88 3 67 3 32 7
60 9
2020
O L D
9 '
94 90 68 91 64 94 B7 90 63 =: 84
c4
■ : :
96
c9
95
= 9 9'
90
BASELINE
9 1
96 91 87 9 4
86
97
88 92 a s
91 3 4
36 101
98
9 .
•oo
90 02
91
Y O U N G
93
96
9 2 69
94
89
• 2 1
91 94 = 6 91 67
87 104
39 93
103 9 ' 93
93
2050
O L D
125
121 ... ' 2 3 •27 ' 3 8
■ 2 4
' 2 6 '56 113
" 6
123
" 9 " 7
114
119
' 3 6 ' 3 9 115
125
BASELINE
1 1 3 • • 1 ' O í
" 0 " 4
' 2 1 " 6 " 4
" 9
102 ' '16 "7
" 6
12 0
1 0 5
11c
' 2 6 " 6 106
• • 3
Y O U N G
' 0 3
102 93
•OO
'06 110 •06 ' 0 5
■"
93 99 i a
99 ' 0 2 99
■'.2
119 ' 3 4
99
[image:11.595.32.563.105.788.2]Eurostat s new long-term population scenarios - technical explanation
National population projections by sex and age are produced by the National Statistical Institutes (regularly and irregularly), United Nations (every 2 years) and Eurostat (every 3-5 years).
The first two agencies basically aim to make population forecasts or the 'best guess' for the next 10-15 years, usually supplemented with uncertainty variants. Eurostat produces various population scenarios for the next 5-6 decades, which attempt to explore realistic boundaries of demographic change in the long run.
The new long-term population scenarios of Eurostat, compiled in 1996 with the assistance of Statistics Netherlands, concern the 18 countries of the European Economic Area (EEA). The scenarios cover the period 1995-2050 and project the population at 1 January by sex and single years of age up to the age group of 90+. Five scenarios were prepared: baseline, low, high, young and old.
The low and high scenario can be considered as plausible extremes with respect to population growth. The low scenario describes a demographic future in which current fertility levels of around 1.45 children per woman will persist, life expectancies will hardly increase and total net immigration for the EEA will drop from 600,000 to 400,000 persons a year. The high scenario assumes a recovery of fertility to levels of around 1.95 children per woman, life expectancies continuing to increase strongly in all countries and total net inflow of migrants increasing to a level of 800,000 persons a year.
The young and old scenarios can be interpreted as plausible extremes with respect to population ageing. In the young scenario, high fertility and high net immigration assumptions are combined with low life expectancies, whereas in the old scenario high life expectancies are combined with low fertility and low net immigration. The baseline scenario describes the 'average development' and can therefore be used as a reference. This scenario is generally fairly close to the latest population forecasts made by the national statistical institutes. The assumptions underlying the five scenarios are summarized in the following scheme:
Fertility
Life expectancy Net migration
Scenarios BASEUNE
medium medium medium
LOW
low low low
HIGH
high high high
YOUNG
high low high
OLD
low high low
EUROSTAT
Directorate E: Social Statistics, regional and geographic information
For further information, contact: Harri Cruijsen (352 4301 33527)
Harold Eding (352 423113720)