1
A Comparative Study of Students Attitudes towards Mathematics in Two
Different School Systems
Mark Prendergast
School of Education, University of Dublin, Trinity College, Ireland
Zhang Hongning,
Gengdan Institute, Beijing University of Technology, China
Author Details:
Dr. Mark Prendergast Ms. Zhang Hongning
School of Education Math and Science Department
Arts Block Gengdan Institute
University of Dublin, Trinity College Beijing University of Technology
Dublin Beijing
Ireland China
Phone: 0035318964855 Phone: 13811994284
Email: [email protected] Email: [email protected]
Abstract Much research has been carried out in the history of mathematics education to find the factors that influence student achievement in the subject. Among these factors, student attitude towards mathematics has been consistently studied. There has often been a correlation found between students’ attitudes and their achievement. In recent years Chinese
2
there are some noteworthy findings which upon further investigation may have implications for policy makers and mathematics educators in both countries.
Keywords: student attitude, mathematics education, Ireland and China.
The Study
Several authors (e.g. Di Martino & Zan, 2015; Hannula, 2002) point out that attitude is an ambiguous construct, one which is often used without proper definition and needs to be developed theoretically. Di Martino and Zan (2015) determine that this is because research on attitude lies at the intellectual crossroads of many different domains (e.g. mathematics, psychology, cognitive science, epistemology, semiotics, anthropology). However despite such paradigmatic difficulties, there have been several attempts at defining and redefining attitude in the context of mathematics education (Aiken, 1970; Allport, 1935; Di Martino & Zan, 2001; Haladyna et al., 1983; McLeod, 1992; Neale, 1969). The construct of attitude was introduced in the first decades of the nineteenth century in the context of social psychology to foresee individuals’ choices in contexts such as voting or buying goods (Di Martino & Zan, 2015). An original definition of attitude by Allport (1935) focuses on the effects of an individual’s mental state on their behaviours within a particular situation. Since then, there
have been many other definitions which focus on the nature of attitude as evidenced by behaviour. Aiken (1970, p.551) includes in a footnote stating that “although there is no standard definition of the term attitude, in general it refers to a learned predisposition or
tendency on the part of an individual to respond positively or negatively to some object,
situation, concept, or another person” (p. 551). Aiken’s definition is one-dimensional, and assumes a yes or no answer to a student’s attitude. Haladyna et al. (1983) also define attitude
similarly; they classify attitude as either a positive or negative emotional disposition towards mathematics.
3
to engage in or avoid mathematical activities, a belief that one is good or bad at
mathematics, and a belief that mathematics is useful or useless”.
This idea of the multidimensionality of attitude has expanded particularly in the last twenty five years. There was a widely accepted view (e.g. McLeod, 1992; DeBellis & Goldin, 1997) of attitude, emotions and beliefs as all belonging to the affective domain. However Di Martino and Zan (2001) determine a three-component definition of attitude which distinguishes emotional response, beliefs, and behaviour as components of attitude. This three component definition is well established within social psychology where Eagly and Chaiken (1998) make reference to a tripartite model, according to which attitude has a cognitive, an affective, and a behavioural component.
Despite the ambiguity in the definitions of attitude there have been a huge amount of studies documenting the development of students’ attitudes in the last twenty five years. Studies have
shown that, for example, girls tend to have more negative attitudes towards mathematics than boys (Frost et al., 1994; Leder, 1995), and that attitudes tend to become more negative as students move from primary to secondary school (McLeod, 1994). The general attitude of a class towards mathematics is related to the quality of the teaching and to the social-psychological climate of the class (Haladyna et al., 1983). Many studies have also shown a correlation between students’ attitudes towards mathematics and their achievement in the
subject (Papanastasiou, 2000; Ma & Kishor, 1997). This correlation between attitude and achievement is highlighted in a study by Ma (2001) which concludes that attitude toward the subject is one of the most important factors affecting participation in advanced mathematics. Such a finding emphasises the importance in further identifying and clarifying the influencing factors on attitudes in mathematics education.
Several factors have been found to play a vital role in the formation and development of a student’s attitude. These include the learning environment, teacher quality and meaningful
teaching methods (Larsen, 2013; Prendergast & O’Donoghue, 2014). However factors from the home environment and society can also be influential (Mohamed & Waheed, 2011). For example many studies (Armstrong & Price, 1982; Tobias, 1993) have shown that students’ attitudes towards mathematics are linked with their parents’ perception of the subject. This
4
understand mathematics at school either”). These expectations fit with the commonly held
Western perception of mathematics as difficult, cold and abstract (Ernest, 2004). In contrast many studies have found that Chinese parents have very high expectations of their children’s
performance in mathematics in comparison to their counterparts in countries such as the USA and Canada (Cai, 2003; Cao, Forgasz & Bishop, 2006). These studies highlight the different ways that parents from different cultural backgrounds can influence students’ attitude. Such influences are not just linked to students’ parents, but also to broader society.
The public image of mathematics and its importance in society can play a crucial role in influencing students’ attitude. This image can vary from society to society. Many individuals
in Western countries are not embarrassed to proclaim their ignorance or poor performance in mathematics (Sam & Ernest, 2000). In China on the other hand, the Confucian values have placed a high emphasis on learning and students are expected to gain perfection in core disciplines such as mathematics (Norton & Zhang, 2013). In contrast to the often held Western view, success in subjects is not innate but instead depends on one’s own effort
(Wong, Wong & Wong, 2012).
These cultural differences are an example of how the home environment and society can influence students’ attitudes towards mathematics in different countries. This is evident in the results of the Programme for International Student Assessment (PISA) (2012) as students’
attitudes to mathematics varied considerably across populations (Organisation for Economic Cooperation and Development (OECD), 2013). With specific reference to Chinese and Irish students, the former generally expressed a more positive attitude towards the subject (OECD, 2013). This study will look to confirm such findings. It will compare the attitudes of a cohort of 15 to 16 year old students in two selected schools in Ireland and China with those of PISA (2012). The selected Chinese school will be located in Beijing. This is important as the Chinese participants for the previous PISA studies have all been from a handpicked number of schools in the Shanghai region. There have been many claims that this city is not representative of schools in other parts of China. Therefore this study will allow for comparisons to be made not just between the selected cohort of Irish and Chinese students but also between the Beijing and Shanghai students.
5
Despite China’s emergence as one of the world’s most influential economies, relatively little is known in other countries about China’s educational system and how its students learn
(OECD, 2010). However the continuous high achievement of Chinese students in subjects such as mathematics on international tests has attracted worldwide interest and has led to an eagerness to learn about China’s education system (Ryan, 2011; Wong, Wong & Wong 2012). This section will compare the Chinese and Irish education systems in more detail.
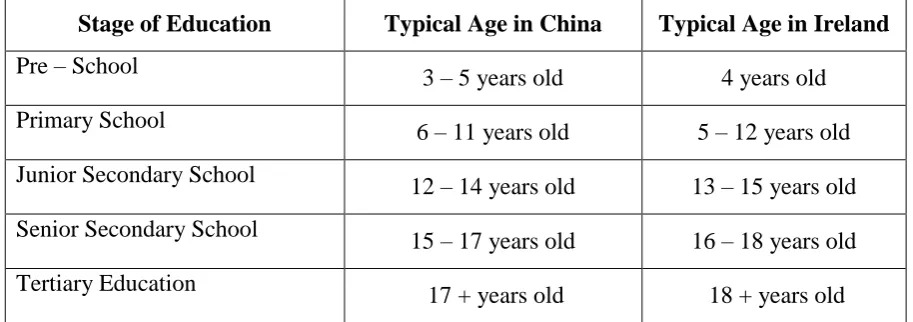
From a structural perspective Chinese and Irish education systems appear to be quite similar. Such structures are outlined in Table 1.
Stage of Education Typical Age in China Typical Age in Ireland
Pre – School
3 – 5 years old 4 years old Primary School
6 – 11 years old 5 – 12 years old Junior Secondary School
12 – 14 years old 13 – 15 years old Senior Secondary School
15 – 17 years old 16 – 18 years old Tertiary Education
[image:5.595.64.521.281.442.2]17 + years old 18 + years old
Table 1 The organisation of China and Irelands educational systems
Education in China is divided into six years of primary school, three years of junior secondary school and three years of senior secondary school. However senior secondary school is not compulsory. Admission is by competitive exam with about half of schools offering general education and the other half offering vocational education which involves learning trades and crafts. Official statistics from the OECD (2010) show a net enrolment of 99.4 per cent at the primary school level in 2009. The gross enrolment ratio for junior secondary school was 99 per cent. In the same year gross enrolment at senior secondary level, both general and vocational, was 79.2 per cent. The general senior secondary schools enrol 52.5 per cent of students at this level, putting about half of senior secondary school students in the academic stream (OECD, 2010).
6
of secondary education is compulsory and it is typically of six years in duration. Approximately 80 per cent of those who enter primary education complete the full secondary school cycle (Conway & Sloane, 2005).
However despite these similarities at structural level there are many differences between both education systems and some of these are obvious even at a surface level. For example in Ireland, secondary schools are generally in operation for 6.75 hours per day. Opening hours for secondary schools in China on the other hand are generally 8.25 hours per day. On top of this, many Chinese students participate in after-school activities to prepare for tests, such as the entrance examination to senior secondary and tertiary education (Ferreras & Olson, 2010). The OCED (2010) report found that about four out of five Shanghai children attended after-school tutorial groups in the evenings and at weekends for exam preparation. This is in stark contrast to Ireland where a study carried out on Irish 15 year’s olds found that only 12
per cent had taken private tuition over the course of a year (Smyth et al., 2006).
While there is undoubted pressure on Irish students to perform well in State examinations at the end of their secondary school education (NCCA, 2005), such pressure would appear to exist for Chinese students all through their educational experience. China is a country suffering from population pressure and this has resulted in intense competition for employment opportunities. This competition has naturally extended further into a race for university places which are decided upon based on an entrance examination. This examination is now seen as the major criterion for the evaluation of secondary schools in China (Tu & Shen, 2010). Such focus has forced education in primary and secondary schools to pay excessive attention to examination preparation and hence the extra tutorials in the evenings and at weekends. This overload on study and school work for students in China has led many observers to express concern regarding the poor moral and psychological wellbeing of its youth (Tu & Shen, 2010). Indeed a study carried out by Zhang (2002) found that 21.6 per cent of primary students and 32 per cent of secondary school students suffer from psychological problems while many ‘successful’ university students lack self-esteem, social skills, adaptability or resilience.
7
systems are proving very resilient (Dello - Iacovo, 2009). Traditionally both Chinese and Irish secondary school classrooms consisted of whole class teaching, with a focus on memorisation and rote learning (National Council for Curriculum and Assessment (NCCA), 2005; Dello-Iacovo, 2009). In recent times many teachers have made efforts to adjust their teaching methodologies towards a more constructivist approach with a focus on teaching for understanding and activities such as group work and discussion. However this is undoubtedly more difficult in China where the average class size is sixty students (Tu & Shen, 2010) in comparison to Ireland where the average is thirty students per class (Lyons et al., 2003).
Method
This is a quantitative study which explores students’ attitudes towards mathematics in two selected secondary schools in Ireland and China. The study aims to compare the attitudes of 15 to 16 years old students towards school and mathematics in two different school systems. Some comparisons will also be made between the findings of this study and those of PISA (2012). This will allow the authors to confirm and compare these findings not just between Irish and Chinese students but also between Shanghai and Beijing students. The following research questions will be addressed:
1. How do students' attitudes towards mathematics in two selected schools in Ireland and China compare?
2. How do the attitudes of the Irish and Chinese students in this study compare with their counterparts in PISA (2012)?
The Sample and School Context
The authors of this study teach mathematics in tertiary institutions in their respective countries. Through a work exchange programme in Ireland they observed each other’s teaching methods and held many discussions regarding mathematics education in both of their countries. Each of the authors were intrigued regarding the differences between Irish and Chinese students’ performances on international comparison tests. In recent years
8
The students who took part in the study came from two selected normal schools, one in Ireland (Dublin region) and one in China (Beijing region). The term normal is used as the students attending both schools would be considered to be have average socio-economic status in their respective countries. Neither schools were fee paying or would be regarded as top attaining academic schools. They were selected for convenience as the authors had links with mathematics teachers in each school. Both schools were co-educational and were located in an urban setting. The year groups selected to take part in the study within each school were Irish 4th Year and Chinese Grade 10 students. These year groups were selected as the average age of students in these year groups is typically between 15 to 16 years old and this corresponds with the PISA sample.
The sample size comprised of 216 students (113 Irish students and 103 Chinese students). In Ireland these students made up four 4th Year class groupings in the school (average class size of 28 students) while in China these students made up two Grade 10 class groupings (average class size of 52 students). In the Irish school the total daily school time was approximately 6 hours compared to approximately 7.75 hours in the Chinese school. With specific reference to mathematics the Irish students typically had 5 lessons of 40 minutes each per week (3.33 hours in total) while the Chinese students typically had 6 lessons of 45 minutes each per week (4.5 hours in total). For the study each student’s background information was recorded (age, gender and nationality). The students were aged between 15 (62.2 per cent) and 16 (37.3 per cent) years old and there was an even gender balance (107 male and 108 female).
Instrument Used for Collecting Data
9
thinking. The authors decided upon the use of this scale because it is a relatively short Likert scale and considers contemporary factors such as group work and the use of technology in the teaching and learning of mathematics. Full details regarding the design, construction, testing and piloting of the SAS can be found in Brookstein et al. (2011).
Limitations of the Study
There are two limitations of this study which must be noted. Firstly, the statements from the original SAS were worded in the English language. This is recognised as an official language of Ireland and so the survey was distributed in its original format to the Irish students. In order for the survey to be taken by the Chinese students, each statement was translated to Chinese by one of the authors who is a native Chinese speaker but speaks English as a second language. In order to ensure an accurate translation, the scale was then translated back to English by a colleague who has English as their first language and Chinese as their second. Despite these measures the statements in the original SAS were developed for use with American students and the survey was not validated for use in Ireland and China. Although English is recognised as an official language of Ireland and the survey was translated back and forth to Chinese proficiently, there is a risk that the different cultures of each country may have resulted in different interpretations of some questions between the American, Irish and Chinese students.
The second limitation concerns the use of students from only one school in each country. Although both of the schools selected would be considered normal (average socio-economic status), the students in each of these schools may not be representative of the wider student population in each country and hence the results should not be generalised. Both of these limitations must be taken into account when drawing conclusions from the study’s findings.
Collection and Analysis of the Data
10
(i.e. 1 = strongly agree, 2 = agree, 3 = undecided, 4 = disagree, 5 = strongly disagree). Thus a high score would indicate a more favourable attitude towards mathematics. The maximum score that could be achieved by a respondent was 115. Missing data was also coded to account for answered questions or cases in which two or more answers were circled.
The 23 statements on the original SAS were also divided into a four factor structure which denote four attitude components. They are:
Attitude 1 - Deep Affect: Positivity towards learning mathematics and school
This component was made up of seven statements from the scale (Statements 1, 2, 6, 9, 10, 18 and 19). Example: Statement 1 - I think mathematics is important in life. Each of these statements collectively gave an indication of students’ beliefs and attitudes towards mathematics and school. The highest possible score for this component was 35.
Attitude 2 – Working collaboratively and related effect
This component was made up of nine statements from the scale (Statements 4, 8, 11, 12, 13, 14, 15, 17 and 20). Example: Statement 17 - I like to go to the board or share my answers with classmates in maths class. Each of these statements collectively gave an indication of
students’ attitudes towards working with others.
Attitude 3 – Working privately
This component was made up of three statements from the scale (Statements 3, 5 and 16). Example: Statement 3 – I learn more about mathematics working on my own. These statements collectively gave an indication of students’ preference towards working privately. The highest possible score for this component as 15.
Attitude 4 – Use of Technology
This component was made up of four statements from the scale (Statements 7, 21, 22 and 23). Example: Statement 23 – I am not comfortable using technology in maths class (R). These statements collectively focused on students attitudes towards the use of technology in class. The highest possible score for this component was 20.
11
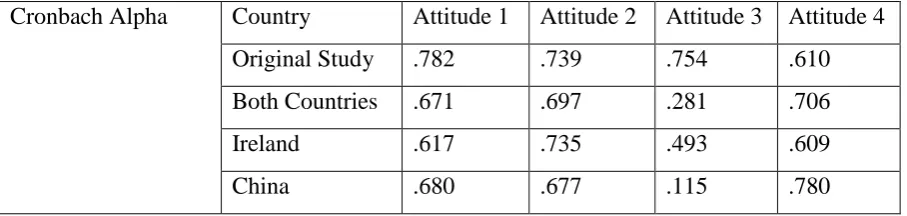
with the calculation of the Cronbach alpha coefficients for each attitude component in both countries (see Table 2). This allowed the alpha coefficients to be compared with those in the original Brookstein et al. (2011) study. The Cronbach alpha coefficients for both countries suggest that some components of the scale, particularly Attitude 3 did not have good
reliability and internal consistency ( 0.7).
Cronbach Alpha Country Attitude 1 Attitude 2 Attitude 3 Attitude 4 Original Study .782 .739 .754 .610 Both Countries .671 .697 .281 .706
Ireland .617 .735 .493 .609
[image:11.595.67.521.197.305.2]China .680 .677 .115 .780
Table 2 Cronbach alpha scores for each attitude component
The authors also calculated the Cronbach alpha coefficients of each sample to determine whether the internal consistency for the SAS scale was particularly poor for either the Chinese or Irish students (see Table 2). They show that the internal consistency of the scale differed for each sample in all of the attitude components but particularly in Attitude 3 where there was a very low score for Chinese students. This infers that the statements in each attitude component and particularly Attitude 3 were not all measuring the same underlying construct. Furthermore the different Cronbach alpha coefficients for each attitude component in each sample deduce that the reliability of the scale varied at times depending on whether it is an Irish or a Chinese sample. This could be a result of the survey being developed for use with American students and may have resulted in different interpretations of some questions between the Irish and Chinese students. As mentioned previously this is a limitation of the study and must be taken into account when analysing the data and drawing conclusions.
Results
Descriptive analysis of the data found that there was a statistically significant difference (t (214) = -3.251, p = .001, two-tailed) between the total overall mean attitude score of the Chinese (M: 76.37, SD: 10.58) and Irish (M: 76.37, SD: 10.32) students.
12
selected cohorts of Irish and Chinese students in 16 of the 23 statements from the SAS. As evidenced by the results in Table 3 the Chinese students who participated in the study listened carefully to their maths teacher, liked mathematics, were interested in it, were confident in their abilities to solve problems, liked sharing their ideas with classmates but also liked working on their own, significantly more than their Irish counterparts.
Statement Country Mean SD Sig. (Two Tailed)
*2. In school, my maths teachers listen carefully to what I have to say.
Ireland 3.46 1.19 t (214) = -5.20, p = .000 China 4.24 .994
*3. I learn more about mathematics working on my own.
Ireland 2.69 1.17 t (214) = -8.03, p = .000 China 4.04 1.01
*10. I like maths. Ireland 3.12 1.27 t (214) = -3.35, p = .001, China 3.68 1.19
*11. I feel confident in my abilities to solve mathematics problems.
Ireland 3.23 1.12 t (214) = -3.44, p = .001 China 3.76 1.13
17. I like to go to the board or share my answers with classmates in math class.
Ireland 2.31 1.06 t (214) = -2.01, p = .046 China 2.62 1.22
*18. I enjoy hearing the thoughts and ideas of my classmates in maths class.
Ireland 3.19 1.00 t (214) = -4.23, p = .000 China 3.76 0.98
[image:12.595.67.522.204.610.2]*19. Mathematics interests me Ireland 3.12 1.21 t (214) = -3.38, p = .001 China 3.68 1.25
Table 3 Statements in which Chinese students agreed significantly more than Irish students
However as shown in Table 4 Irish students enjoyed using a computer when learning mathematics and also felt they received good grades on mathematics tests, significantly more than their Chinese participants.
13 *13. I receive good grades on
maths tests and quizzes.
Ireland 3.43 1.08 t (214) = 3.358, p = .001 China 2.94 1.06
21. I enjoy using a computer when learning mathematics.
[image:13.595.64.520.71.155.2]Ireland 3.02 1.15 t (214) = 2.308, p = .022 China 2.64 1.25
Table 4 Statements in which Irish students agreed significantly more than Chinese students
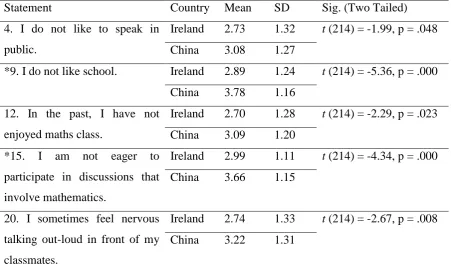
Table 5 shows five statements which Chinese students disagreed with, significantly more than Irish students. These results suggest that Chinese students liked school, speaking in public and mathematics class more than Irish students. They also were more eager to participate in discussions involving mathematics and were not as nervous talking in front of their classmates as their Irish counterparts.
Statement Country Mean SD Sig. (Two Tailed)
4. I do not like to speak in public.
Ireland 2.73 1.32 t (214) = -1.99, p = .048 China 3.08 1.27
*9. I do not like school. Ireland 2.89 1.24 t (214) = -5.36, p = .000 China 3.78 1.16
12. In the past, I have not enjoyed maths class.
Ireland 2.70 1.28 t (214) = -2.29, p = .023 China 3.09 1.20
*15. I am not eager to participate in discussions that involve mathematics.
Ireland 2.99 1.11 t (214) = -4.34, p = .000 China 3.66 1.15
20. I sometimes feel nervous talking out-loud in front of my classmates.
Ireland 2.74 1.33 t (214) = -2.67, p = .008 China 3.22 1.31
Table 5 Statements in which Chinese students disagreed significantly more than Irish students
[image:13.595.68.520.329.599.2]14
Statement Country Mean SD Sig. (Two Tailed)
*8. I do not participate in many group activities outside school.
Ireland 3.88 1.21 t (214) = 4.54, p = .000 China 3.12 1.25
*23. I am not comfortable using technology in maths class.
Ireland 3.58 1.07 t (214) = 3.30, p = .001 China 3.07 1.23
Table 6 Statements in which Irish students disagreed significantly more than Chinese students
In order to eliminate the possibility of any of the statistically significant results in Tables 3 - 6 occurring as a result of chance, a Bonferroni correction was applied to the data. This involved dividing the p value (0.05) by the number of statements in the SAS (23) to get the Bonferroni critical value. Under this criterion there were still statistically significant differences (p < 0.002) in 11 of the 23 statements from the SAS. These 11 statements have been distinguished from the others by the asterisk symbol (*) placed before their numbers in Tables 3 – 6.
Further analyses of the data was also carried out and looked at the four attitude components of the SAS. These findings are outlined in Table 7.
Attitude Type Max Value Ireland
Mean & SD
China Mean & SD Attitude 1 - Deep Affect 35 22.96 (4.3) 26.00 (4.5)
[image:14.595.68.520.73.175.2]Attitude 2- Working Collaboratively 45 27.42 (6.1) 28.72 (5.7) Attitude 3 – Working Privately 15 8.82 (2.5) 9.87 (2.1) Attitude4 – Use of Technology 20 12.58 (3.0) 11.77 (3.8)
Table 7 Comparisons of Chinese – Irish student attitude scores in Attitudes 1 - 4
[image:14.595.66.526.452.580.2]15
Chinese students preference towards working privately in comparison to Irish students. Notably Irish students expressed a more positive attitude towards the use of technology in class with a mean score of 12.58 / 20.
Discussion
There were two main research questions which guided this study, each of which will now be discussed in more detail.
1. How do students attitudes towards mathematics in two selected schools in Ireland and China compare?
The findings highlight considerable differences in the attitudes of the two selected cohorts of Chinese and Irish students towards mathematics. Using a Bonferroni correction critical value there were statistically significant differences (p < 0.002) in 11 of the 23 statements. The majority of these statements showed that the selected sample of Chinese 15 to 16 year old students had a more positive attitude towards learning mathematics in comparison to their Irish counterparts. This study found that in comparison to Irish students, Chinese students generally:
o liked school and mathematics more, o enjoyed their mathematics classes more,
o felt more confident in their abilities to solve mathematics problems, and o were more interested in mathematics.
These findings are worrying from an Irish perspective given the correlation between student attitude and achievement in mathematics (Papanastasiou, 2000; Ma & Kishor, 1997; Ma, 2001).
16
Secondly, the findings of this study also showed that when compared to Irish students, Chinese students generally:
o were more comfortable talking in public and in front of their classmates, o were more eager to engage in discussions that involve mathematics, and o enjoyed hearing the thoughts and ideas of their classmates in maths class more.
Again this is in spite of the fact that they still expressed a preference to working privately in mathematics and agreed that they learned more about the subject when working on their own. This may be a result of the traditional teaching methods consisting of whole class teaching and independent learning which are still very prevalent in Chinese classrooms (Norton & Zhang, 2013). Although there have been efforts to adapt more innovative approaches in recent years, this is difficult given the large class sizes (in this study the average class size for the Chinese cohort was 52 students compared to 28 for the Irish cohort). It is very challenging for teachers to set up and carry out collaborative activities such as group work with such large numbers. As a result Chinese students may be more accustomed to and comfortable working independently.
A notable finding of this study was that Irish students stated that they were more comfortable and enjoyed using technology more in the mathematics classroom than their Chinese counterparts. This is significant as China is considered one of the world’s leading countries in technological innovation and development (Khayyat & Lee, 2015). Thus this finding is important for the Irish Government who have invested heavily in supporting the use of Information and Communications Technology (ICT) in Irish classrooms. Such investment was a result of the TIMSS (1995) report which revealed that 96 per cent of Irish students never used computers in mathematics class (Beaton et al., 1996). The same report found that 99 per cent of Irish mathematics teachers admitted that their students never or hardly ever used computers in mathematics class (Beaton et al., 1996). In light of these figures the Irish Government spent approximately 40 million on a programme called Schools IT 2000, ensuring that schools had access to computers and the internet and also the ensuring the technical training of in-service teachers. Despite such heavy investment, comparisons drawn in PISA (2003) by the OECD revealed that Ireland had the highest proportion of students (49 per cent) who make ‘rare or no use’ of computers in school (OECD, 2004). An Irish study
17
professional development in the use of ICT. This is important given that the use of ICT for effective teaching can be one of the most direct ways of changing attitudes towards mathematics (Conway & Sloane, 2005).
2. How do the attitudes of the Irish and Chinese students in this study compare with their counterparts in PISA (2012)?
The findings of this study are in line with those of PISA (2012) in which Chinese students from the Shanghai region expressed more positive attitudes towards mathematics than their Irish counterparts. The levels of enjoyment, confidence and interest in mathematics amongst Chinese students in both studies was similar. A well as displaying consistency, this shows that despite the differences between Shanghai and Beijing in terms of economy and politics, students from the two regions have displayed similar positive attitudes towards learning mathematics and school. This is an important finding and comes at a time when PISA (2015) will include students from Beijing, Jiangsu and Guangdong, as well as Shanghai in their next study in order to get a wider, more representative sample of Chinese students.
18
outside of school. This compared with just 4 per cent of Irish students (OECD, 2014). Such a substantial academic workload suggests that Chinese students do not have time to participate in groups activities outside of school.
Conclusion
Given the use of only one school in each country and the issues regarding the validation of the instrument for use in Ireland and China, it is important to apply caution to inferences drawn from this study. Nevertheless there were some noteworthy findings which certainly merit further investigation. Sizable differences in the attitudes of the two selected cohorts of Chinese and Irish students towards mathematics have been highlighted. A more in-depth look at the results revealed a number of positive and negative arguments for policy makers and mathematics educators in both countries to consider. From a Chinese perspective, students’ positive attitudes towards school and mathematics were very promising. However the concerns of previous reports regarding idealistic expectations and school and study overload were again evident in the findings. There are measures being put in place to try and address these issues with some provinces forbidding the holding of formal classes over the weekend (OECD, 2010). It is important that these issues are addressed and a balance of school and extracurricular activities are promoted for the holistic and social development of China’s youth.
19
reformed curriculum on students’ experiences of, and attitudes towards mathematics (Jeffes et al., 2013). This is a welcome outcome but based on the findings of this study and PISA (2012), more work is needed in the development and sustainment of positive attitudes if Irish students are to come in line with their Chinese (Shanghai and Beijing) counterparts. This is important given that the learning of mathematics is not only a cognitive challenge, but also an affective one (Larsen, 2013).
References
Armstrong, J. & Price, R.A. (1982). Correlates and predictors of women’s mathematics participation. Journal for Research in Mathematics Education, 13, 99 – 109.
Aiken, L. (1970). Attitudes toward mathematics. Review of Educational Research, 40, 551– 596.
Aiken, L.R. (1974). Two scale of attitude toward mathematics. Journal for Research in Mathematics Education, 5, 67-71.
Allport, W. (1935). Attitudes. In C. A. Murchison (Ed.), A handbook of social psychology. Worcester: Clark University Press.
Beaton, A.E., Mullis, V.S., Martin, M.O., Gonzalez, E.J., Kelly, D.L. & Smith, T.A. (1996). Mathematics Achievement in the Middle School Years: IEA’s Third International
Mathematics and Science Study. Boston, MA: TIMSS International Study Centre.
Brookstein, A., Hegedus, S., Dalton, S. Moniz, R. & Tapper, J. (2011). Measuring Student Attitude in Mathematics Classrooms. Report No. 4, Dartmouth, Kaput Centre for
Research and Innovation in STEM Education.
Cai, J. (2003). Investigating parental roles in students’ learning of mathematics from a cross-cultural perspective. Mathematics Education Research Journal, 15.
Cao, Z., Bishop, A. & Forgasz, H. (2006). Perceived Parental Influence on Mathematics Learning: A Comparison among Students in China and Australia. Educational Studies in Mathematics, 64, 85-106.
Cockcroft, W.H. (1982). Mathematics Counts: Report of the Committee of Inquiry into the Teaching of Mathematics in Schools. London: HMSO.
Conway, P. & Sloane, C. (2005). International trends in post-primary mathematics education. Dublin, Ireland: National Council for Curriculum and Assessment.
20
Group for the Psychology of Mathematics Education, Vol. 2, University of Helsinki, Lahti, Finland, pp. 209-216.
Dello – Iacovo, B. (2009). Curriculum reform and ‘Quality Education’ in China: An Overview. International Journal of Educational Development, 29, 241–249.
Di Martino, P. & Zan, R. (2001). Attitude toward mathematics: some theoretical issues. In M. van den Heuvel-Panhuizen (Eds.), Proceedings of the 25th Conference of the International Group for the Psychology of Mathematics Education, Vol. 3, Freudenthal Institute, University of Utrecht, Utrecht, the Neatherlands, pp. 209-216.
Dwyer, E. (1993). Attitude Scale Construction: A Review of the Literature, available online: http://www.eric.ed.gov/ERICWebPortal/recordDetail?accno=ED359201
Eagly, A. H. & Chaiken, S. (1998). Attitude structure and function. In D. T. Gilbert, S. T. Fiske, & G. Lindzey (Eds.), The handbook of social psychology (4th ed., Vol. 1, pp. 269– 322). New York: McGraw-Hill.
Ernest, P. (2004). Images of mathematics, values and gender. In S. Johnston-Wilder and B. Allen (Eds.), Mathematics Education: exploring the culture of learning. Routledge.
Fennema, E. & Sherman, J. A. (1976). Fennema-Sherman Mathematics Attitudes Scales: Instruments designed to measure attitudes toward the learning of mathematics by males and females. Catalogue of Selected Documents in Psychology, 6(1), 31.
Ferreras, A. & Olson, S. (2010). The Teacher Development Continuum in the United States and China: Summary of a Workshop. Washington, DC: The National Academies Press.
Frost, L.A., Hyde, J.S. & Fennema, E. (1994). Gender, mathematics performance, and mathematics related attitudes and affect: a meta-analytic synthesis. International Journal of Educational Research, 21, 373-385.
Haladyna, T., Shaughnessy, J. & Shaughnessy, M. (1983). A causal analysis of attitude toward mathematics. Journal for Research in Mathematics Education, 14, 19–29.
Hannula, M.S. (2002). Attitude towards Mathematics: Emotions, Expectations and Values. Educational Studies in Mathematics, 49(1), 25-46.
Jeffes, J., Jones, E., Wilson, M., Lamont, E., Straw, S., Wheater, R. & Dawson, A. (2013). Research into the impact of Project Maths on student achievement, learning and
motivation: final report. Slough, UK: NFER.
21
Larkin, K. & Jorgensen, R. (2015). ‘I Hate Maths: Why Do We Need to Do Maths?’ Using iPad Video Diaries to Investigate Attitudes and Emotions towards Mathematics in Year 3 and Year 6 Students. International Journal of Science and Mathematics Education, DOI 10.1007/s10763-015-9621-x.
Larsen, J. (2013). Attitude in Mathematics: a thematic literature review. British Columbia, BC: Simon Fraser University.
Lyons, M., Lynch, K., Close, S., Sheerin, E. & Boland, P. (2003). Inside Classrooms- The Teaching and Learning of Mathematics in the Social Context. Dublin, Ireland: Institute of
Public Administration.
Ma, Xin. (2001). Participation in Advanced Mathematics: Do Expectation and Influence of Students, Peers, Teachers, and Parents Matter? Contemporary Educational Psychology, 26(1), 132–146.
Ma, X. & Kishor, N. (1997). Assessing the relationship between attitude toward mathematics and achievement in mathematics: A meta-analysis. Journal for Research in Mathematics Education, 28(1), 27-47.
McLeod, D. (1992). Research on affect in mathematics education: A reconceptualization. In D. A. Grouws (Eds.), Handbook of research on mathematics teaching and learning (pp. 575–596). New York: Macmillan.
McLeod, D. (1994). Research on affect and mathematics learning in the JRME: 1970 to the present, Journal for Research in Mathematics Education, 24, 637-647.
Mohamed, L. & Waheed, H. (2011). Secondary Student’s Attitude towards Mathematics in a Selected School of Maldives. International Journal of Humanities and Social Science, 1(15): 277-281.
Neale, D. C. (1969). The role of attitudes in learning mathematics. The Arithmetic Teacher, 16, 631-640.
National Council for Curriculum and Assessment. (2005). Review of Mathematics in Post – Primary Education. Dublin, Ireland: The Stationary Office, Department of Education and
Science.
Norton, S. & Zhang, Q. (2013). Chinese Students’ Engagement with Mathematics Learning, International Journal for Mathematics Teaching and Learning, available online: http://www.cimt.plymouth.ac.uk/journal/norton2.pdf.
Organisation for Economic Cooperation and Development. (2004). Learning for Tomorrow’s
22
Organisation for Economic Cooperation and Development. (2010). Strong Performers and Successful Reformers in Education: Lessons from PISA for the United States. Paris,
France: Author.
Organisation for Economic Cooperation and Development. (2013). PISA 2012 Results: Ready to Learn: Students’ Engagement, Drive and Self-Beliefs (Volume III). Paris, France:
Author.
Organisation for Economic Cooperation and Development. (2014). PISA 2012 Results: What Students Know and Can Do – Student Performance in Mathematics, Reading and Science
(Volume I, Revised edition, February 2014). Paris, France: Author.
Papanastasiou, C. (2000). Effects of attitudes and beliefs on mathematics achievement. Studies in Educational Evaluation, 26, 27-42.
Prendergast, M. & O’Donoghue, J. (2014). ‘Students enjoyed and talked about the classes in the corridors’: pedagogical framework promoting interest in algebra. International
Journal of Mathematical Education in Science and Technology, 45(6), 795 – 812.
Rubinstein, M. F. (1986). Tools for thinking and problem solving. New Jersey, NJ: Prentice Hall.
Ryan, J. (2011). Education reform in China: Changing concepts, contexts and practices. London, UK: Routledge.
Sam, L.C. & Ernest, P. (2000). A Survey of Public Images of Mathematics, Research in Mathematics Education, 2(1), 193-206.
Smyth, E., Dunne, A., McCoy, S. & Darmody, M. (2006). Pathways through the Junior Cycle: The Experiences of Second Year Students. Dublin, Ireland: ERSI.
Tobais, S. (1993). Overcoming math anxiety: Revised and expanded. New York: W.W. Norton.
Tu, R. & Shen, W. (2010). Fundamental Focuses of Chinese Mathematics Education: Characteristics of Mathematics Teaching in China. Journal of Mathematics Education, 3(2), 160-169.
Zhang, H. (2002). Psychological health of the youth: cause for concern. China Today, June 10, pp. 16–22.
23 APPENDICES
Appendix 1: Student Attitude Survey in Mathematics
Gender: __________ Age: __________
Please circle the appropriate responses based on the key below:
1 2 3 4 5
Strongly Disagree
Disagree Undecided Agree Strongly Agree
1. I think mathematics is important in life. 1 2 3 4 5 2. In school, my maths teachers listen carefully to what I have to
say.
1 2 3 4 5
3. I learn more about mathematics working on my own. 1 2 3 4 5
4. I do not like to speak in public. 1 2 3 4 5
5. I prefer working alone rather than in groups when doing mathematics.
1 2 3 4 5
6. In school, I learn more from talking to my friends than from listening to my teacher.
1 2 3 4 5
7. Technology can make mathematics easier to understand. 1 2 3 4 5 8. I do not participate in many group activities outside school. 1 2 3 4 5
9. I do not like school. 1 2 3 4 5
10. I like maths. 1 2 3 4 5
11. I feel confident in my abilities to solve mathematics problems.
24
12. In the past, I have not enjoyed maths class. 1 2 3 4 5 13. I receive good grades on maths tests and quizzes. 1 2 3 4 5 14. When I see a math problem, I am nervous. 1 2 3 4 5 15. I am not eager to participate in discussions that involve
mathematics.
1 2 3 4 5
16. I enjoy working in groups better than alone in math class. 1 2 3 4 5 17. I like to go to the board or share my answers with classmates
in math class.
1 2 3 4 5
18. I enjoy hearing the thoughts and ideas of my classmates in maths class.
1 2 3 4 5
19. Mathematics interests me. 1 2 3 4 5
20. I sometimes feel nervous talking out-loud in front of my classmates.
1 2 3 4 5
21. I enjoy using a computer when learning mathematics. 1 2 3 4 5 22. When using technology for learning mathematics, I feel like
I am in my own private world.
1 2 3 4 5