ePrints Soton
Copyright © and Moral Rights for this thesis are retained by the author and/or other copyright owners. A copy can be downloaded for personal non-commercial
research or study, without prior permission or charge. This thesis cannot be
reproduced or quoted extensively from without first obtaining permission in writing from the copyright holder/s. The content must not be changed in any way or sold commercially in any format or medium without the formal permission of the
copyright holders.
When referring to this work, full bibliographic details including the author, title, awarding institution and date of the thesis must be given e.g.
AUTHOR (year of submission) "Full thesis title", University of Southampton, name of the University School or Department, PhD Thesis, pagination
Text Segmentation in Web Images Using
Colour Perception and Topological Features
Dimosthenis A. Karatzas
Abstract
The research presented in this thesis addresses the problem of Text Segmentation in Web images. Text is routinely created in image form (headers, banners etc.) on Web pages, as an attempt to overcome the stylistic limitations of HTML. This text however, has a potentially high semantic value in terms of indexing and searching for the corresponding Web pages. As current search engine technology does not allow for text extraction and recognition in images, the text in image form is ignored. Moreover, it is desirable to obtain a uniform representation of all visible text of a Web page (for applications such as voice browsing or automated content analysis). This thesis presents two methods for text segmentation in Web images using colour perception and topological features.
The nature of Web images and the implicit problems to text segmentation are described, and a study is performed to assess the magnitude of the problem and establish the need for automated text segmentation methods.
Two segmentation methods are subsequently presented: the Split-and-Merge segmentation method and the Fuzzy segmentation method. Although approached in a distinctly different way in each method, the safe assumption that a human being should be able to read the text in any given Web Image is the foundation of both methods’ reasoning. This anthropocentric character of the methods along with the use of topological features of connected components, comprise the underlying working principles of the methods.
Aknowledgements
It would be considerably more difficult to walk along the twisting and occasionally disheartening road of research, without the help of numerous people who with their myriad contributions, suggestions, friendly ears and timely distractions, supported me during the last few years.
Firstly, thanks must go to my supervisor, Apostolos Antonacopoulos, for his support and feedback throughout my period of research. Without his guidance and his valuable contributions, this thesis would not be possible. Also in the department, I would like to thank my fellow doctoral students for their cherished comradeship. In particular, I wish to thank Dave Kennedy, who shared an office with me for the last three years, for maintaining a cheerful atmosphere by frequently distracting me with pure English jokes (which admittedly I didn’t always understand).
Special thanks must also go to my ex-flatmate Dimitris Sapountzakis, with whom I spent one of my best years in Liverpool. Vicky Triantafyllou, for her love and support. Alexandros Soulahakis, for his delicious “loukoumades” and for keeping me up to date with the latest music. Maria and Vasilis Mavrogenis for the coffee breaks and the occasional barbeques. Paula and Dimitris for dragging me out for a drink once in a while. Chrysa, and Elena for keeping me home the rest of the times. Nikos Bechlos for keeping me up to date with mobile technologies, and numerous others who made my stay in Liverpool an enjoyable time.
Declaration
I declare that this doctoral thesis was composed by myself and that the work contained therein is my own, except were explicitly stated otherwise in the text. The following articles were published during my period of research.
1. A. Antonacopoulos and D. Karatzas, “Fuzzy Text Extraction from Web Images Based on Human Colour Perception”, to appear in the book: “Web Document Analysis – Challenges and Opportunities”, A. Antonacopoulos and J. Hu (eds.), World Scientific Publishing Co., 2003
2. D. Karatzas and A. Antonacopoulos, “Visual Representation of Text in Web Documents and Its Interpretation”, proceedings of 2nd Workshop on Visual Representations and Interpretations (VRI’2002), Liverpool, September 2002
3. A. Antonacopoulos and D. Karatzas, “Fuzzy Segmentation of Characters in Web Images Based on Human Colour Perception”, proceedings of the 5th IARP Workshop on Document Analysis Systems (DAS’2002), Princeton, NJ, August 2002
4. A. Antonacopoulos and D. Karatzas, “Text Extraction from Web Images Based on Human Perception and Fuzzy Inference”, proceedings of the 1st International Workshop on Web Document Analysis (WDA’2001), Seattle, Washington, September 2001
5. A. Antonacopoulos, D. Karatzas and J. Ortiz Lopez, “Accessing Textual Information Embedded in Internet Images”, proceedings of Electronic Imaging 2001: Internet Imaging II, San Jose, California, USA, January 2001
Table of Contents
1 INTRODUCTION 1
1.1 IMAGES IN WEB DOCUMENT ANALYSIS...2
1.2 THE USE OF IMAGES IN THE WEB – A SURVEY...3
1.3 THE NEED – APPLICATIONS OF THE METHOD...7
1.4 WORKING WITH WEB IMAGES – OBSERVATIONS AND CHARACTERISTICS...8
1.5 AIMS AND OBJECTIVES OF THIS PROJECT...12
1.6 OUTLINE OF THE THESIS...13
2 IMAGE SEGMENTATION TECHNIQUES 15
2.1 GREYSCALE SEGMENTATION TECHNIQUES...17
2.1.1. THRESHOLDING AND CLUSTERING METHODS...18
2.1.2. EDGE DETECTION BASED METHODS...22
2.1.3. REGION EXTRACTION METHODS...35
2.2 COLOUR SEGMENTATION TECHNIQUES...41
2.2.1. COLOUR...42
2.2.2. HISTOGRAM ANALYSIS TECHNIQUES...47
2.2.3. CLUSTERING TECHNIQUES...51
2.2.4. EDGE DETECTION TECHNIQUES...60
2.2.5. REGION BASED TECHNIQUES...67
3 TEXT IMAGE SEGMENTATION AND CLASSIFICATION 77
3.1 BI-LEVEL PAGE SEGMENTATION METHODS...78
3.2 COLOUR PAGE SEGMENTATION METHODS...83
3.3 TEXT EXTRACTION FROM VIDEO...87
3.4 TEXT EXTRACTION FROM REAL SCENE IMAGES...91
3.5 TEXT EXTRACTION FROM WEB IMAGES...96
3.6 DISCUSSION...100
4 SPLIT AND MERGE SEGMENTATION METHOD 103
4.1 BASIC CONCEPTS – INNOVATIONS...103
4.2 DESCRIPTION OF THE METHOD...105
4.3 PRE-PROCESSING...106
4.4 SPLITTING PHASE...113
4.4.1. SPLITTING PROCESS...113
4.4.2. HISTOGRAM ANALYSIS...116
4.5 MERGING PHASE...123
4.5.1. CONNECTED COMPONENT IDENTIFICATION...124
4.5.2. VEXED AREAS IDENTIFICATION...125
4.5.3. MERGING PROCESS...128
4.6 RESULTS AND SHORT DISCUSSION...141
4.7 CONCLUSION...145
5 FUZZY SEGMENTATION METHOD 147
5.1 BASIC CONCEPTS – INNOVATIONS...147
5.2 DESCRIPTION OF METHOD...148
5.3 INITIAL CONNECTED COMPONENTS ANALYSIS...149
5.4 THE FUZZY INFERENCE SYSTEM...154
5.4.1. COLOUR DISTANCE...154
5.4.2. TOPOLOGICAL RELATIONSHIPS BETWEEN COMPONENTS...157
5.4.3. THE CONNECTIONS RATIO...160
5.5 AGGREGATION OF CONNECTED COMPONENTS...169
5.6 RESULTS AND SHORT DISCUSSION...171
5.7 DISCUSSION...174
6 CONNECTED COMPONENT CLASSIFICATION 177
6.1 FEATURE BASED CLASSIFICATION...177
6.1.1. FEATURES OF CHARACTERS...178
6.1.2. MULTI-DIMENSIONAL FEATURE SPACES...183
6.2 TEXT LINE IDENTIFICATION...187
6.2.1. GROUPING OF CHARACTERS...187
6.2.2. IDENTIFICATION OF COLLINEAR COMPONENTS...190
6.2.3. ASSESSMENT OF LINES...194
6.3 CONCLUSION...205
7 OVERALL RESULTS AND DISCUSSION 207
7.1 DESCRIPTION OF THE DATASET...207
7.2 SEGMENTATION RESULTS...213
7.2.1. SPLIT AND MERGE METHOD...214
7.2.2. FUZZY METHOD...224
7.2.3. COMPARISON OF THE TWO SEGMENTATION METHODS...233
7.3 CHARACTER COMPONENT CLASSIFICATION RESULTS...239
7.4 DISCUSSION...242
8 CONCLUSION 247
8.1 SUMMARY...247
8.2 AIMS AND OBJECTIVES REVISITED...248
8.3 APPLICATION TO DIFFERENT DOMAINS...249
APPENDIX A: HUMAN VISION AND COLORIMETRY,
A DISCUSSION ON COLOUR SYSTEMS 253
A.1 HUMAN VISION AND COLORIMETRY...253
A.1.1. HUMAN VISION...253
A.1.2. COLORIMETRY...254
A.1.3. COLOUR DISCRIMINATION...255
A.2 COLOUR SYSTEMS...256
A.2.1. RGB ...257
A.2.2. HLS ...259
A.2.3. CIE XYZ ...262
A.2.4. CIE LAB AND CIE LUV...263
A.3 COLOUR DISCRIMINATION EXPERIMENTS...266
A.3.1. COLOUR PURITY (SATURATION) DISCRIMINATION...268
A.3.2. HUE DISCRIMINATION...272
A.3.3. LIGHTNESS DISCRIMINATION...274
APPENDIX B: FUZZY INFERENCE SYSTEMS 279
B.1 FUZZY SETS AND MEMBERSHIP FUNCTIONS...279
B.2 LOGICAL OPERATIONS...281
B.3 IF-THEN RULES...281
APPENDIX C: THE DATA SET 285
C.1 MULTI-COLOURED TEXT OVER MULTI-COLOURED BACKGROUND...285
C.2 MULTI-COLOURED TEXT OVER SINGLE-COLOURED BACKGROUND...286
C.3 SINGLE-COLOURED TEXT OVER MULTI-COLOURED BACKGROUND...287
C.4 SINGLE-COLOURED TEXT OVER SINGLE-COLOURED BACKGROUND...289
C.5 ADDITIONAL INFORMATION ON THE DATA SET...291
Chapter
1
1.
Introduction
cientific and cultural progress would not be possible without ways to preserve and communicate information. Nowadays, automatic methods for retrieving, indexing and analysing information are increasingly being used in every day life. Accessibility of information is therefore a significant issue. World Wide Web is possibly the upshot of information exchange and an area where problems in information retrieval are easily identifiable.
S
Images constitute a defining part of almost every kind of document, either serving as a carrier of information related to the content of the document (e.g. diagrams, charts, etc), or used for aesthetic purposes (e.g. background, photographs, etc). At first, mostly due to limited bandwidth, the use of images on Web pages was rather restricted and their role was mainly to beautify the overall appearance of a page without carrying important (semantic) information. Nevertheless, as the overall speed of Internet connections is rising an increasing trend has been noticed to embed semantically important entities of Web pages into images. More specifically, designing eye-catching headers and menus and enhancing the appearance of a Web page using images for anything that the visitor should pay attention to (e.g. advertisements), is a strong advantage in the continuous fight to attract more visitors. Furthermore, certain parts of a document, such as equations, are bound to be in image form, as there is no alternative way to code them in Web pages.
access any text inside the images [4], while analysing the alternative text (ALT tags) provided, proves to be rather a disadvantage, since in almost half of the cases it is totally misleading as will be seen in Section 1.2. Therefore, important information on Web pages is not accessible, introducing a number of difficulties regarding automatic processes such as indexing and searching.
The research described in this Thesis addresses the need to extract textual information from Web images. The aim of the project is to examine possible ways to segment and identify characters inside colour images such as the ones found on Web pages. Towards the text segmentation in Web images, two different methods were implemented and tested. The first method works in a split-and-merge fashion, based on histogram analysis of the image in the HLS colour system, and connected component analysis. The second method is based on the definition of a propinquity measure between connected components, defined in the context of a fuzzy inference system. Colour distance and topological properties of components are incorporated into the propinquity measure providing a comprehensive way to analyse relationships between components. The innovation of both approaches, lies in the fact that they are both based on available (existing and experimentally derived) knowledge on the way humans perceive colour differences. This anthropocentric character of the two approaches is evident primarily through the way colour is manipulated, making use of human perception data and employing colour systems that are efficient approximations of the psychophysical manner humans understand colour.
The concept of the “Web document” will be introduced in the next section, and text extraction from Web images will be discussed in the context of document analysis. The impact and consequences of using images in Web pages is assessed in Section 1.2. The significant need for a method that extracts text from Web images is discussed in Section 1.3, along with possible applications for such a method. Section 1.4 examines the distinguishing characteristics of Web images and summarizes interesting observations made. Characteristic paradigms of Web images are also given in Section 1.4. The aims and objectives of this project are detailed in Section 1.5. Finally an outline of the thesis is given in Section 1.6.
1.1. Images in Web Document Analysis
document that appeared: the “Web Document”. Two distinct descriptions exist for every Web page, one is the code used to produce the output, and the other is the actual output itself. Although either description should ideally be adequate to describe a given Web page, not the same information is stored in each representation. For instance, information about the filenames of images contained in the document is only available in the Web page’s code, whereas the images themselves, thus the information they add to the document, are only part of the two-dimensional viewable output. The definition of Web Document is therefore not trivial, and should incorporate both representations.
The key-role images play in Web Pages makes them an important part of every Web Document Analysis method. This stands true for all types of images, as images are used in Web pages for a variety of purposes, such as to define a background pattern for the document, as bullets in a list, deliminators between different sections, photographs, charts etc. The most significant kind of images, in respect to the amount of information they carry, are the ones containing text, such as headers, menus, logos, equations, etc. Images containing text carry important information about both the layout and the content of the document, and special attention should be paid in incorporating this information in every Web Document Analysis method.
1.2. The Use of Images in the Web – A Survey
In order to assess the impact of the presence of text in Web images, the Pattern Recognition and Image Analysis (PRImA) group of the University of Liverpool delivered a survey over the contents of images of around 200 Web pages [9]. The Web pages included in the survey originated from a variety of sites that the average user would be interested in browsing. Sites of newspapers and TV stations, on-line shopping, commercial, academic and other organizations’ sites as well as sites dealing with leisure activities, work-related activities and other routine activities were all included, so that the sample set reflects the average usage of World Wide Web today. The Web pages analysed were all in English language, and therefore the majority of sites were from the United States and the United Kingdom. For the purpose of this survey, there should not be loss of generality by this choice.
investigation of the alternative text provided is essential, in order to assess the necessity of a method to extract text from images, as this would depend on the availability of an alternative representation of the textual content of the images. In terms of the textual content of the images the following were measured for each Web page:
• The total number of words visible on the page. This is the number of words that can be viewed on the Web page, regardless of whether they are part of the text or embedded in an image.
• The number of words in image form. This is the number of the words that are embedded in images only.
• The number of words in image form, that do not appear anywhere else on the page. This is an important measure, since it indicates whether a word can be indexed and consequently searched upon or not.
Regarding the presence of an alternative description in the form of ALT tags associated with the text in images, the following were measured:
• The number of correct descriptions. A description is considered correct if all the text in the image is contained in the ALT tag.
• The number of false descriptions. These are descriptions were the ALT tag text disagrees with the text in the image.
• The number of incomplete descriptions, where the ALT tag text contains some, but not all of the text in the image.
• The number of non-existent descriptions, where no ALT tag text is provided.
Words in main text 83%
Words in image form
17%
Words in image form Words in main text
Figure 1-1 – Percentage of words in Web pages found in image form and in the main text.
Even more alarming are the results about the usage of ALT tags. As can be seen in Figure 1-2 that follows, only 44% of the ALT tag’s text is correct. The remaining 56%
is either incomplete (8%), false (3%), or non-existent (45%). That makes more than half of the text in images totally inaccessible without a method to extract it directly from the image.
Non-existent 45% False
3% Incomplete
8%
Correct 44%
Correct Incomplete False Non-existent
Figure 1-2 – Percentage of correct and incorrect ALT tags in Web pages.
Words that appear in the
main text 76% Words that do
not appear in the main text
24%
Words in image form that appear in the main text Words in image form that do not appear in the main text
Figure 1-3 – Percentage of words embedded in images not appearing in the main text.
The results reported are in broad agreement with an earlier survey of 100 Web pages by Lopresti and Zhou [218]. This fact demonstrates that the situation is not
improving. Furtherm rld Wide Web grows
the n bly. More recently
wsing, the location of the ima
ore, as the volume of information on the Wo total umber of inaccessible material increases considera
Kanungo, Lee and Bradford [90] reported similar results over a small number of images selected from web pages returned by the Google Internet search engine for the keyword “newspapers”. Although a very restricted sample was evaluated, the results are equally alarming, with a 59% of the words in images not appearing anywhere else in the Web page. Further verification of the situation can be found in Munson and Tsymbanenko [125] who attribute the poor recall results they obtain when searching for images by means of their associated text information, to exactly the fact that the ALT tag attribute value is rarely both present and relevant to the image’s content.
An aspect not covered in any of these surveys, is the incorporation of a measure of importance for each image. Although it is a fact that important entities on Web pages are present in the form of images, a measure of importance for each image in terms of the information it carries would give a clearer view of the problem and should be included in any future work. Various ways exist to measure the importance of each image, most of them based on structural analysis of the Web page. The location of each image is vital, and is a feature incorporated in many new applications. For example, when performing Web page analysis for voice bro
importance of an image could be employing techniques used nowadays for evaluating the quality of Web pages, usually based on human visual perception and eyes movement [57].
1.3. The Need – Applications of the Method
There is a plethora of possible applications for a method that extracts text from colour images. An immediate use of the method would be at the domain of indexing and searching. Search engines are unable to access any textual information found in image form directly. Most search engines index instead any alternative information that is readily available for the image, such as the filename or the ALT tag associated with the image. This, results to important terms of the Web page to be ignored, thus the information finally indexed is incomplete or even misleading if one considers the existence of incorrect alternative descriptions. A method to extract text from the Web ima
s indicating tha
t of a Web image, would allow the browser to present the text in a different way, for users with special needs. ges would be useful in many different stages. First, any search engine would be able to access and consequently index the textual information embedded inside Web images. This would result into improved indexing and more efficient and precise searching. Text extraction could also take place at a different stage, at the time of the creation of the document. A text extraction method could be used to automatically provide the correct alternative description for the images that the user has not already supplied one, or to double check the correctness of user inserted alternative descriptions and possibly propose the appropriate changes.
The Web browser could also benefit in many ways from a method to extract text from images. Knowing the textual content of an image, it could provide a number of new functions, such as filtering capabilities or certain accessibility utilities for users with special needs. Filtering would be straightforward if the textual contents of images were known. Images containing certain offensive terms, or term
For contrast
ultaneously. For example, reading traffic inform
voice browsing. For exam
eb images will be discussed derived from observations made over a large number of images that comprise the dataset used for the development and evaluation of the method (described analytically in Chapter 7). The observations made and the characteristics identified, shaped the way this research was conducted.
The basic observation one can make about Web images is that they are computer oriented. Contrary to the types of images that typical OCR applications require, which example, the text could be presented enlarged, in an easier to read font, using high
ing colours.
The most important application of a Web image text extraction method would probably be converting the Web page to voice. Conversion of the Web page to voice is not necessarily a function used only by users with special needs. There are many cases where having the computer read a Web page would save time and allow the user to continue with other activities sim
ation or a newspaper page while driving, or enabling bi-directional voice browsing. In current applications images are simply ignored, or in very few cases, positioning information or any alternative text is read instead [21].
Converting a Web page to text allows for a series of other applications apart from ple, it would enable applications to summarize Web pages and produce smaller versions, suitable to be presented on the small display of a PDA or a mobile phone. Considering the rapid progress and wide acceptance of mobile technologies, this will probably be an important issue in the near future.
Finally, the applications of a method to extract text from colour images are not necessarily limited to the World Wide Web. There are many other fields that such a method would be of great value, for example video indexing, or real life scenes analysis. The method could be used to extract text from video frames, such as names and titles from newscasts or scores from athletic events. Furthermore, it could be used for applications involving real life scenes, such as extracting the registration numbers of car plates, or the textual content of street and shop signs.
1.4. Working with Web Images – Observations and
Characteristics
in most of the cases are scanned documents, Web images are created with the use of computers to be viewed on a computer monitor.
The fact that computers are employed for the creation of the images entails that a plethora of tools are readily available at that stage. These tools include a wide range of filters, antialiasing capabilities, a variety of different effects to render characters and many more. Therefore, although Web images do not suffer from artefacts introduced during the digitisation process (skew, noise etc), artefacts produced by the software used for the creation of the image are evident in most of the cases. Antialiasing is probably the most common kind of artefact that strongly affects our ability to differentiate characters from the background. Antialiasing is the process of blending a foreground object to the background, by creating a smooth transition from the colours of one to the colours of the other. This produces characters with poorly defined edges, in contrast to the characters in typical document images (Figure 1-4). A second, but equally important problem, is the use of special effects when rendering characters in an image. These effects range from simple outlines and shadows, to 3D-effects and the placement of words in arbitrary directions, and pose many difficulties to any text extraction method.
(a) (b)
Figure 1-4 – (a) An image with antialiased characters. The area marked with the red rectangle ased edges of characters are visible.
appears in magnification on the left. (b) Magnified part of the image, where the antiali
Contrary to typical document images, which have a minimum resolution of 300dpi
and a typical size of an A4 page (thus their dimensions are in the range of thousands of pixels), Web Images have an average resolution of 75dpi. This is adequate for viewing on a monitor, which is the primary use for those images. Consequently, the size of the images is in most of the cases small. Since the images are to be viewed on a monitor with an average resolution of 800x600 pixels, the dimensions of Web Images are never larger than some hundred pixels. Another observation that would lead us to similar assumptions about the average size of Web Images is the function of the images in the Web pages. Headers, menu items and section titles occupy usually a small area of the page, which is reflected in the size of the images used for these entities. Furthermore, the size of the characters used is also much smaller than the size of characters on scanned documents (Figure 1-5). An expected character size in scanned documents is 12pt or larger, whereas in Web pages characters can be as small as to an equivalent of 5 to 7pt.
(a) (b)
Figure 1-5 – (a) An image containing small characters. (b) Magnified part of the image.
schemes between characters and background would be used. Although it is expected that the colours of pixels belonging to characters will be more similar between them than to colours of the background, the contrast between the two classes (text and background) is not always adequate to distinguish them.
(a) (b)
Figure 1-6 – (a) An image containing both multi-coloured characters and multi-coloured background. (b) An image with multi-coloured overlapping characters.
A final observa Web images is that they are created with file-size in h be easily communicated through the Web. This directly t some pression should be used, which is actually the case
usin JPEG’s compression capabilities. This type of
ion introd ges ffect in
con sign
This kind of lossy ab r analysis of the
tent discarded in JPEG compression). The next most popular file type used for Web images, is GIF. Although GIF format preserves much
ore information than JPEG, it is limited to 8-bit colour palettes. This vastly reduces
the nt quantization artefacts
in the im
tion about mind, since they ave to suggests tha kind of com
with Web images most of the times. The vast majority of g in some extent
images in the Web are saved as JPEG files,
compress uces certain artefacts in the ima that have no particular e areas of almost stant colour, but can produce
compression is even more notice
ificant distortions to characters. le when colou
image takes place (as lightness information is mostly preserved, but colour information is to a great ex
m
(a) (b)
Figure 1-7 – (a) A JPEG compressed image. (b) Magnified part of the image. The block structure produced by JPEG compression is visible in large areas, while more compression artefacts are visible near the characters.
A summary of the main characteristics associated with Web images, and a comparison with typical document images required by OCR applications is given in Table 1-1.
Characteristics Web Images Typical Scanned Document Images
Spatial Resolution ~75dpi >300dpi
Images’ Siz e 100s of pixels 1000s of pixels
Characters’ Size Can be as small as 5-7pt >12pt
Colour Schemes Multi-colour text over multi-colour
background
Black text over white background
Artefacts Antialiasing, compression, dithering Skew, digitisation artefacts
Character Effects Characters not always on a straight
line, 3D-effects, shadows, outlines etc.
Characters usually on a straight line, of the same font
Table 1-1 – Summary of Web Images’ main characteristics and comparison to typical scanned document images.
1.5. Aims and Objectives of this Project
The objective of this project is the implementation and testing of new ideas for performing text extraction from web images, as dictated from the specific characteristics of the problem. A successful solution should be able to cope with the ma
text and bac
age text extraction method is expected to be used, it is important that the
y of the text extraction method to decide whether an image contains text or not, is a desired property, but considered to be out of the scope of this research. For the evaluation of this research, only images containing text will be employed.
1.6. Outline of the Thesis
Following this introductory chapter, Chapters 2 and 3 provide a theoretical background for this research. Chapter 2 gives a detailed overview of segmentation methods, starting with methods used for greyscale image analysis, followed by a brief introduction to colour and a critical review of colour segmentation methods. Chapter 3 provides an overview of text image segmentation and classification methods. Several aspects of text image segmentation are discussed and a number of classification methods for the segmented regions are presented and appraised. Previous work on the topic of text extraction from colour images is also part of Chapter 3.
Chapter 4 describes in detail the first method used for segmenting text in Web images. This method works in a split-and-merge fashion, making use of the HLS
jority of web images, producing precise segmentation results and high classification rates. Given the volume of fundamentally different images existent in the World Wide Web, this is expected to be a complicated task.
The final solution should be able to correctly segment images containing
kground of varying colour, mainly gradient and antialiased text. It should be also able to cope with various text layouts (e.g. non-horizontal text orientation)
The methods developed should not set any special requirements for the input images, while the assumptions about the contents of the image should be kept to an absolute minimum.
Given the volume of web images available and the special types of applications where a web im
execution time is kept short. Nevertheless, since the focus of this research is on the implementation and evaluation of novel methods, the execution time for the prototypes should be allowed to be reasonably long, as long as optimisation and improvement is possible.
colour space. The method’s basic concepts and implementation aspects are discussed, and results obtained are presented.
Chapter 5 describes the second segmentation method developed, which is based upon the definition of a propinquity measure that combines colour distance and topological characteristics of connected components with the help of a fuzzy inference system. An analytical description of the fuzzy defined propinquity metric takes place, followed by an explanation of the method and the presentation of results obtained.
The connected component classification method developed is presented in Chapter 6. The classification of the connected components produced by the segmentation methods is a necessary post-processing step aiming in identifying which of them correspond to characters and which to the background of the image.
More results of both segmentation methods and the classification method are presented and critically appraised in Chapter 7. A comparison between the two segmentation methods and the possibility of applying the methods developed to other fields is also included in Chapter 7. The chapter closes with a discussion summarizing on optimisation possibilities and key issues identified. Finally, Chapter 8 concludes this thesis reassessing the aims and objectives set and commenting on future work and open problems.
Chapter
2
2.
Image Segmentation Techniques
egmentation is the process of partitioning an image into a number of disjoined regions such that each region is homogeneous with respect to one or more characteristics and the union of no two adjacent regions is homogeneous” [70, 140, 143].
“S
A more mathematical definition of segmentation can be found in [56, 197, 221]. Let X denote the grid of sample points of a picture, and let P be a logical predicate defined on a set of contiguous picture points. Then segmentation can be defined as a partitioning of X into disjoint non-empty subsets X1, X2, … Xn such as:
1. N Xi X
i=1 =
U
2. Xi for i=1,…N is connected
3. P(Xi)=TRUE for i=1,…N
4. P(Xi∪Xj)=FALSE, for i≠j where Xi and Xj are adjacent.
Eq. 2-1
The first condition states that after the completion of the segmentation process, every single pixel of the image must belong to one of the subsets Xi. It should be
0 ,
1
, = i j =
N j
i X X
I , i ≠ j Eq. 2-2
even though not mentioned, should also be in effect for the above definition to be complete. That last condition states that no pixel of the image can belong to more than one subset.
The second condition implies that regions must be connected, i.e. composed of contiguous lattice points. This is a very important criterion since it affects the central structure of the segmentation algorithms [119, 197] . This second condition is not met in many approaches [31, 81, 141, 173].
A uniform predicate P as the one associated with the third condition is according to Fu and Mui [56] one which assigns the value TRUE or FALSE to a non-empty subset Y of the grid of sample points X of a picture, depending only on properties related to the brightness matrix for the points of Y . Furthermore, P has the property that if Z is a non-empty subset of Y, then P(Y)=TRUE, implies always that
P(Z)=TRUE. The above definition is rather restricted in the sense that the only feature on which P depends on is the brightness of the points of the subset Y. In Tremeau and Borel [197] this is generalized in order to address other characteristic features of the subset pixels as well. According to them, the predicate P determines what kind of properties the segmentation regions should have, for example a homogeneous colour distribution.
Finally, the fourth condition entails that no two adjacent regions can have the same characteristics.
Segmentation is one of the most important and at the same time difficult steps of image analysis. The immediate gain of segmenting an image is the substantial reduction in data volume. For that reason segmentation is usually the first step before a higher level process which further analyses the results obtained.
Segmentation methods are basically ad hoc and their differences emanate from each problem’s trait. As a consequence, a variety of segmentation methods can be found in literature, the vast majority of which addresses greyscale images.
segmentation methods, followed by the main section of this chapter, which focuses on colour image segmentation.
2.1. Greyscale Segmentation Techniques
Fu and Mui [56] in their survey on image segmentation classified image segmentation techniques as characteristic feature thresholding or clustering, edge detection and region extraction. This survey was done from a biomedical viewpoint, and the evaluation of techniques is based on cytology images. Authors’ comments are objective, but the main interest is clearly cytology imaging. A review of several methods for thresholding and clustering, edge detection and region extraction was performed. Most of the methods reviewed are towards greyscale segmentation, with the exception of Ohlander’s work [134] on colour image thresholding and a clustering method proposed by Mui, Bacus and Fu [124], which only uses colour-density histograms at a later stage, after initial segmentation has already been obtained.
Haralick and Shapiro [69] categorized segmentation techniques into six classes: measurement space guided spatial clustering, single linkage region growing schemes, hybrid linkage region growing schemes, centroid linkage region growing schemes, spatial clustering schemes and spit and merge schemes. The survey mainly focuses on the first two classes of segmentation techniques; measurement space guided spatial clustering and region growing techniques for which a good summary of different types of region growing methods has been presented. The recursive clustering method proposed by Ohlander [134] and the work of Ohta, Kanade and Sakai on colour variables [136] are detailed among others in the section concerning clustering. There is also a small section about multidimensional measurement space clustering, where Haralick and Shapiro propose to work in multiple lower order projection spaces and then reflect these clusters back to the full measurement space.
in the categories of grey level thresholding, iterative pixel classification, surface based segmentation, colour image segmentation, edge detection and fuzzy set based segmentation.
Additional image segmentation surveys can be found in Zucker [221], Riseman and Arbib [158] and Kanade [89]. Also surveys on threshold selection techniques can be found in Weszka [204] and Sahoo et al. [172].
Following the suggestions of previous reviews, segmentation methods will be categorized as thresholding or clustering methods, edge detection methods and region extraction methods. In addition to these, there are certain methods that do not fall clearly in any of the above classes, rather combine two or more of the aforementioned techniques to achieve segmentation. The remainder of this section will address these categories of segmentation techniques, attempting a critical review of selected methods found in literature.
2.1.1. Thresholding and Clustering Methods
According to Haralick and Shapiro [70] “Thresholding is an image point operation which produces a binary image from a grey-scale image. A binary one is produced on the output image whenever a pixel value on the input image is above a specified minimum threshold level. A binary zero is produced otherwise”. There are cases where more than one threshold is being used for segmentation. In these cases, the process is generally called multi-level thresholding, or simply multi-thresholding. Multi-thresholding thus is defined as “a point operator employing two or more thresholds. Pixel values which are in the interval between two successive threshold values are assigned an index associated with the interval” [70]. Multi-thresholding is described mathematically as:
k y x
S( , )= , if Tk−1 ≤ f(x,y)<Tk, k=0, 1, 2, …, m Eq. 2-3
where (x, y) is the x and y co-ordinate of a pixel, S(x, y), f(x, y) are the segmented and the characteristic feature functions of (x, y) respectively, T0, …, Tm are threshold
distinct labels assigned to the segmented image [56]. Bi-level thresholding can be seen as a special case of multi-thresholding for m=2, thus two intervals are defined one between T0 and T1 and the second between T1 and T2.
Level slicing or density slicing is a special case of bi-level thresholding by which a binary image is produced with the use of two threshold levels. “A binary one is produced on the output image whenever a pixel value on the input image lies between the specified minimum and maximum threshold levels” [70].
Based on the aforementioned definition a threshold operator T can be defined as a test involving a function of the form [60]:
(
x,y,N(x,y), f(x,y))
T Eq. 2-4
where N(x, y) denotes some local property of the point (x, y) for example the average grey level over some neighbourhood. Depending on the functional dependencies of the threshold operator T, Weszka [204] and Gonzalez and Woods [60] divided thresholding into three types. The threshold is called global if T depends only on
f(x, y). It is called a local threshold when T depends on both f(x, y) and N(x, y). Finally if T depends on the coordinate values x, y as well, then it is called a dynamic threshold.
A global threshold can be selected in numerous ways. There are threshold selection schemes employing global information of the image (e.g. the histogram of a characteristic feature of the image, such as the grey scale value) and others using local information of the image (e.g. co-occurrence matrix, or the gradient of the image).
Taxt et al [192] refer to these threshold selection schemes using global and local information as contextual and non-contextual thresholding respectively. According to Taxt et al, under these schemes, if only one threshold is used for the entire image then it is called global thresholding, whereas if the image is partitioned into sub-regions and a threshold is defined for each of them, then it is called local thresholding [192], or adaptive thresholding [214]. For the rest of this section, the definitions given by Weszka [204] and Gonzalez and Woods [60] will be used.
Global threshold selection methods
threshold selection becomes a problem of detecting the valleys of the histogram. Unfortunately, more often than not, this is not the case. Most of the times the different modes in the histogram are not nicely separated by a valley or the valley may be broad and flat, impeding the selection of a threshold.
A number of methods are proposed that take into account some extra information about the image contents in order to make a threshold selection. For bi-modal pictures, Doyle [44] suggested the p-tile method which chooses as a threshold the grey-level which most closely corresponds to mapping at least (1-p) per cent of the grey level pixels into the object. If for example we have a prior knowledge that the objects occupy 30% of the image, then the image should be thresholded at the largest grey-level allowing at least 30% of the pixels to be mapped into the object. Prewitt and Mendelsohn [155] proposed a technique called the mode method, which involves smoothing of the histogram into a predetermined number of peaks. The main disadvantage of these methods is that knowledge about the class of images we are dealing with is required.
A number of other methods have also been proposed to separate the different modes in the histogram. Nakagawa and Rosenfeld [130] assumed that the object and background populations are distributed normally with distinct means and standard deviations. They then selected a threshold by minimizing the total misclassification error. Pal and Bhandari [139] assumed Poisson distributions to model the grey-level histogram and proposed a method which optimises a criterion function related to average pixel classification error rate, finding out an approximate minimum error threshold.
Local threshold selection methods
A common drawback of all these methods is that they totally ignore any spatial information of the image. A number of methods were proposed that combine histogram information and spatial information to facilitate threshold selection. Weszka [205] proposed a way to sharpen the valley between the two modes for bi-modal images, by histogramming only those pixels having high Laplacian magnitude. Such a histogram will not contain those pixels in between regions, which help to make the histogram valley shallow.
whose thresholded value is different from their own thresholded value. Busyness is dependent on the co-occurrence of adjacent pixels in the image. A good threshold is the point near the histogram valley, which minimizes the busyness.
Watanabe et al [201] used the gradient property of the pixels to determine an appropriate threshold. For each grey-level they compute the sum of the gradients taken over all pixels having that specific grey-level value. The threshold is then chosen at the grey-level for which this sum of gradients is the highest. They reason that since this grey-level has a high proportion of large difference points, it should occur at the borders between objects and background. Kohler [95] suggests a modification of the Watanabe’s idea. He chooses that threshold which detects more high-contrast edges and fewer low-contrast edges than any other threshold. Kohler defines the set of edges detected by a threshold T to be the set of all pairs of neighbouring pixels, for which one pixel has a grey-level value less than or equal to T
and the other has a grey value greater than T. The contrast of an edge comprising of pixels a and b is given as min{|I(a) – T|, |I(b) –T|}, where I(a) and I(b) is the grey-level value (intensity) of the pixels a and b respectively. The best threshold is determined by that value that maximizes the average contrast, which is given as the sum of the contrasts of the edges detected by that threshold, divided by the number of the detected edges.
Adaptive thresholding
In cases where the image in question is noisy or the background is uneven and illumination variable, objects will still be darker or lighter than the background but any fixed threshold level for the entire image will usually fail to separate the objects from the background. In that cases adaptive thresholding algorithms must be used. As mentioned before in adaptive thresholding the image is partitioned into several blocks and a threshold is computed for each of these blocks independently. As an example of adaptive thresholding, Chow and Kaneko [34] determined local threshold values for each block using the sub-histogram of the block. Then they spatially interpolated the threshold values to obtain a spatially adaptive threshold for each pixel.
Clustering
and each class of regions is assumed to form a distinct cluster in the space of these characteristic features.
A cluster according to Haralick and Shapiro [70] is a homogeneous group of units, which are very like one another. Likeness between units is determined by the association, similarity, or distance between the measurement patterns associated with the units. Clustering is then defined as the problem concerned with the assignment of each observed unit to a cluster.
Haralick and Shapiro [69] state that the difference between clustering and segmentation is that in clustering, the grouping is done in measurement space, while in segmentation the grouping is done in the spatial domain of the image. This is partially misleading since segmentation aims to do groupings in the spatial domain, but this can be achieved through groupings in the measurement space. The resulting clusters in the measurement space are then mapped back to the original spatial domain to produce a segmentation of the image.
Any feature that one thinks is helpful to a particular segmentation problem can be used in clustering. Characteristic features commonly used for clustering include grey values taken with the use of different filters [59], or even features defined for the specific problem. As an example, Carlton and Mitchell [27] used a texture measure that counted the number of local extrema in a window centred at each pixel. They created three grey-level images using different thresholds. The grey-level value of the units in each of these resulting images is the number of local extrema produced by the used threshold. These three resulting images along with the original intensity image were used to define a four-dimensional space in which the clustering was performed.
Clustering is mainly used for multi-spectral images. Consequently, clustering techniques are broadly used in colour image segmentation. As such, a detailed discussion of clustering methods will follow in chapter 2.2.3.
2.1.2. Edge Detection based Methods
The importance of edge detection lies to the fact that most of the information of an image lies on the boundaries between different regions, and that biological visual systems seem to make use of edge detection rather than thresholding [165].
Ideally, edge detection should yield pixels lying only on the boundary between the regions one tries to segment. In practice, the identified pixels alone rarely define a correct boundary sufficiently because of noise, breaks in the boundary and other effects. More often than not, the edge detection stage is followed by an edge linking and boundary detection stage, intending to combine pixels into meaningful boundaries.
According to Davis [39], edge detection methods can be classified as parallel and sequential. In parallel techniques, the decision whether a pixel is an edge pixel or not is not dependant on the result of the operator on any previously examined pixels, whereas in sequential techniques it is. The edge detection operator in parallel techniques can therefore be applied simultaneously everywhere in the image.
As far as it concerns sequential techniques, their outcome is strongly dependent on the choice of an appropriate starting point and on the way previous results affect both the selection and the result at the next pixel. Kelly [92] and Chien and Fu [33] used guided search techniques for this. The rest of this section will focus on parallel techniques.
Since discontinuities in image are associated with high frequencies, an obvious way to enhance the edges would be high frequency filtering [60]. If for example we take the Fourier transform of the image and multiply it by a spatial filter, then the invert transform will yield enhanced edges. The design of the filter used is the crucial part for this process.
Local operators
(a)
(b)
(c)
(d)
Figu
age, note the gradient edges of the stripe, which is usually the case with edges in images. l extrema appear at the points of transitions. (d) Seco
re 2-1 – (a) An image of a vertical white stripe over black background. (b) Profile of an horizontal line of the im
(c) First derivative of the horizontal profile, loca
nd derivative of the horizontal profile, zero crossings appear at the midpoints of transitions.
The first derivative at any point in an image is obtained by using the magnitude of the gradient vector at that point. The gradient vector of an image at location (x, y) is defined as:
⎥ ⎥ ⎥
⎦ ⎤
⎢ ⎢ ⎢
⎣ ⎡
∂ ∂ ∂ ∂ = ⎥ ⎦ ⎤ ⎢ ⎣ ⎡ = ∇
y f x f
G G f
y x
Eq. 2-5
The magnitude of the gradient vector is generally referred to simply as the
g
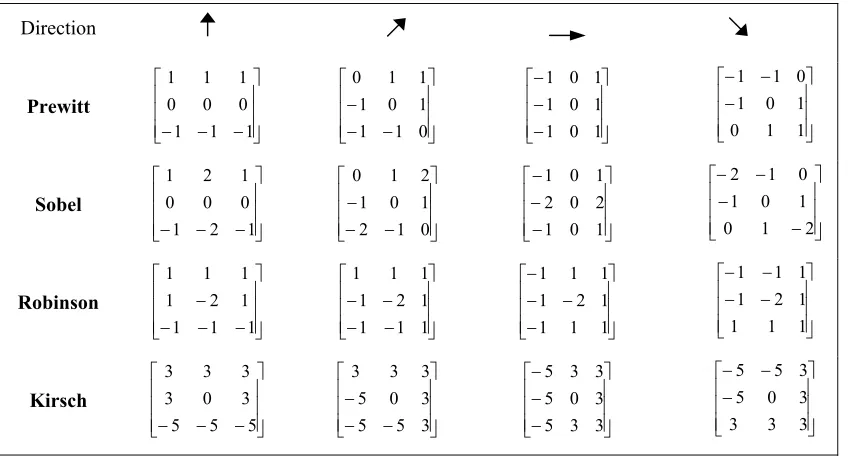
There is a number of operators approximating the first derivative such as Prewitt [154, 186], Sobel [45, 60, 186], Robinson [186], and Kirsch [94, 186]
operators (Figure 2-2), which are based on a 3x3 neighbourhood. The Sobel operator has the advantage of providing both a differencing and a smoothing effect, which is a particularly attractive feature, since derivatives enhance noise. Prewitt’s operator is
Di
also adequately noise-immune, but it has a weaker response to the diagonal edge.
rection Prewitt ⎥ ⎥ ⎥ ⎦ ⎤ ⎢ ⎢ ⎢ ⎣ ⎡ − − −1 1 1
0 0 0 1 1 1 ⎥ ⎥ ⎥ ⎦ ⎤ ⎢ ⎢ ⎢ ⎣ ⎡ − − − 0 1 1 1 0 1 1 1 0 ⎥ ⎥ ⎥ ⎦ ⎤ ⎢ ⎢ ⎢ ⎣ ⎡ − − − 1 0 1 1 0 1 1 0 1 ⎥ ⎥ ⎥ ⎦ ⎤ ⎢ ⎢ ⎢ ⎣ ⎡ − − − 1 1 0 1 0 1 0 1 1 Sobel − − −1 2 1
0 0 0 1 ⎥ ⎥ ⎥ ⎦ ⎤ ⎢ ⎢ ⎢ ⎣ ⎡ − − − 0 1 2 1 0 1 2 1 0 ⎥ ⎥ ⎥ ⎦ ⎤ ⎢ ⎢ ⎢ ⎣ ⎡ − − − 1 0 1 2 0 2 1 0 1 ⎥ ⎥ ⎥ ⎦ ⎤ ⎢ ⎢ ⎢ ⎣ ⎡ − − − − 2 1 0 1 0 1 0 1 2 ⎥ ⎥ ⎥ ⎦ ⎤ ⎢ ⎢ ⎢ ⎣ ⎡1 2
Robinson ⎦ ⎢ ⎢ ⎢ ⎣ ⎡ − − − − 1 1 1 2 1 1 ⎥ ⎥ ⎥ ⎦ ⎤ ⎢ ⎢ ⎢ ⎣ ⎡ − − − − 1 1 1 1 2 1 1 1 1 ⎥ ⎥ ⎥ ⎤ 1 1 1 ⎥ ⎥ ⎥ ⎦ ⎤ ⎢ ⎢ ⎢ ⎣ ⎡ − − − − 1 1 1 1 2 1 1 1 1 ⎥ ⎥ ⎥ ⎦ ⎤ ⎢ ⎢ ⎢ ⎣ ⎡ − − − − 1 1 1 1 2 1 1 1 1 K
⎡3 3 3 ⎡3 3 3 ⎡−5 3 3 ⎡−5 −5 3
irsch ⎥ ⎥ ⎥ ⎦ ⎢ ⎢ ⎢
[image:38.595.85.509.174.402.2]⎣−5 −5 −5 3 0 3 ⎥ ⎥ ⎥ ⎦ ⎢ ⎢ ⎢ ⎣− − − 3 5 5 3 0 5 ⎥ ⎥ ⎥ ⎦ ⎢ ⎢ ⎢ ⎣− − 3 3 5 3 0 5 ⎥ ⎥ ⎥ ⎦ ⎢ ⎢ ⎢ ⎣ − 3 3 3 3 0 5 ⎤ ⎤ ⎤ ⎤
Figure 2-2 – 3x3 Convolution Masks of some operators approximating the first derivative. Four out of the eight directions are depicted.
Gradient operators are widely used, since they comprise a straightforward, computationally cheap parallel process. Local operators based on the second derivative have also been proposed. The Laplacian of a function is a second order derivative defined as:
2 2 2 2 2 y f x f f ∂ ∂ + ∂ ∂ =
∇ Eq. 2-6
The Laplacian operator may be implemented in various ways. It presents a number of disadvantages. Being a second order derivative operator, the Laplacian operator is very sensitive to noise. Furthermore, it produces double edges.
Gaussian (LG) operator as one that satisfies the above statement. The Gaussian part of the LG operator smoothes the image at scales accord g to the scale of the Ga
Then the zero crossings in the output image produced by the Laplacian part of the operator indicate the positions of edges. The space described by the scale parameter of the Gaussian and the zero crossing curves of the output image is known as the scale-space. Techniques based on scale-space analysis [26, 207] are also used to identify interesting peaks in histograms and will be discussed again in section 2.2.2.
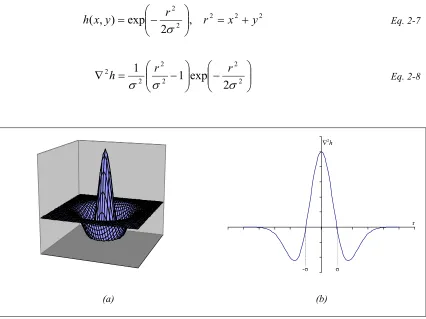
The Laplacian of a two dimensional Gaussian function of the form of Eq. 2-7 is given in Eq. 2-8. In Figure 2-3 the plot of the Laplacian of the Gaussian is shown, as well as a cross-section. The zero crossings of the function are at r=±σ, where σ is the standard deviation of the Gaussian.
in ussian.
2 2 2 2 2
, 2 exp ) ,
(x y r r x y
h ⎟⎟ = +
⎠ ⎞ ⎜⎜
⎝ ⎛ − =
σ Eq. 2-7
⎟⎟ ⎠ ⎜⎜
⎝− ⎟⎟ ⎠ ⎜⎜
⎝ −
=
∇2 2 2 2
2 exp 1
σ σ
σ
h ⎛ ⎞ ⎛ ⎞
2 2
1 r r
Eq. 2-8
-σ σ
h
2
∇
r
[image:39.595.85.511.325.644.2](a) (b)
Figure 2-3 – (a) A plot of the Laplacian of the Gaussian (∇2h); (b) a cross-section of ∇2h.
The importance of Marr and Hildreth’s method lies partially to the introduction of the concept of scale to edge detection, a concept that has een widely used sin
54]. Lu and Jain [108] studied the behaviour of edges in the scale-space using the LG
operator, aiming to derive useful rules for scale-space reasoning and for high-level
com
posed which consider edge detection as an approximation problem. Hueckel [78] modelled the ideal edge by a step function and considered the actual edges in the image a
forms of this ideal model. Hueckel’s ideal edge was given by:
d b d b p s > + ⎩ ⎨ + = ) , , ,
, Eq. 2-9
= Eq. 2-10
odel of edges as large step changes in edges in natural scene images. They reason puter vision works. They gave a number of interesting theorems, facts and assertions, and analytically described the behaviour of edges in scale-space.
Functional approximation techniques
Apart from local operator based methods, there are a number of methods pro
s noisy p sy cx if p sy cx if b c y x
F( , , ⎧ + ≤
The best fit would be an edge of the above form that minimized a measure of closeness E between itself and the actual edge in the image. The measure chosen was the square of the Hilbert distances between F and f - where f(x, y) is the grey value of the pixel (x, y) - over a circular neighbourhood D around the point in question:
[
f x y F x y c s p b d]
dxdyE D 2 ) , , , , , , ( ) , (
∫
−The results of the minimization procedure were the best fit and a measure of goodness for the fit.
Elder and Zucker [49] state that the m intensity would fail to detect and localize
that a number of natural phenomena such as focal blurring, penumbral blurring and shading would produce a blurred edge rather than an ideal step response. They state that all these situations predict a sigmoidal luminance transition of the same form:
) / ( )
(x f x r
I = , where f(u)= 1
(
arccos(u)−u 1−u2)
π Eq. 2-11
blurring kernel to model the blur and a sensor noise function to model the zero-mean white noise introduced by the sensor.
They state that because of a broad range of conditions, a number of edges having variable characteristics will be produced. Regardless of the physical structure from which they project, all edges should generally project to the image as sigmoidal luminance transitions according to the model proposed, over a broad range of blur scales. Elder and Zucker agree thus with other researchers [14, 104, 108, 113, 207] that operators of multiple scales must be used, since the appropriate spatial scale for local estimation depends on the local structure of the edge, and varies unpredictably over the image. They propose a way to define a locally computable minimum reliable defined as the minimum scale for which the likelihood of error
ignal to noi
scale (where reliable is
due to sensor noise is below a standard tolerance) for local estimation at each point in the image, based on prior knowledge of sensor properties.
Haralick [67, 68] assumed that the intensity function of the image could be fitted with a number of sloped planes according to the gradient around each pixel, then edges were identified as the points having significantly different planes on either side of them. He attempted to least squares fit each pixel neighbourhood with a cubic polynomial in two variables. Having done that, the first and second derivatives could be easily calculated from the polynomial. The first partial derivatives determine the gradient direction. Given the gradient direction, the second directional derivative is used to determine whether a pixel is an edge location or not.
Canny edge detector
Canny [25] tried to mathematically derive an edge detector based on a set of certain rules governing the computation of edge points. According to Canny, a good edge detector should comply with three basic criteria. First, there should be a low probability of failing to mark real edge points, and low probability of falsely marking non-edge points. Thus, the edge detector should present good detection. The second criterion for the edge detector is that the points marked as edges should be as close as possible to the centre of the true edge. This is called good localization. Finally, the edge detector should give only one response to a single edge. Canny used the s
marked edge from the centre of the true one. This measure increases as localization improves. To maximize simultaneously both good detection and good localization e ratio and the reciprocal of standard
ith local processing techniques
As mentioned before, edge linking usually follows the edge detection process. This edge linking (or boundary detection) process, aims to combine individual identified edge pixels into meaningful edges. The most straightforward way to do this, is to analyse the characteristics of pixels in a small neighbourhood around every identified edge pixel in the image [60], and link similar edge pixels. Similarity in that
generally based on two properties: the strength of the response of the gradient operator used to produce the edge pixel (or any other metric indicating the strength of the
criteria, Canny used the product of signal to nois
deviation of the displacement of edge points. The third criterion, the single-response one, although implicitly captured in the first criterion, it was not captured in the mathematical form of it, and that was the reason why it had to be included as a third distinct criterion. Canny introduced a functional constraint, which eliminated multiple responses. The maximization of the product is done subject to this constraint.
To generalize in two dimensions, Canny defined edges at directional maxima of the first derivative of the intensity function of the image and proposed a complex system of rules to combine edges detected at multiple scales. Canny’s operator was essentially one-dimensional, and was shown less accurate for orientation estimation of two-dimensional edges [109].
Edge linking w
case, is
edge pixel), and the direction of the gradient. In the case where a gradient operator was used to identify edge pixels, the strength of the response and the direction of the gradient are derived from the definition of the gradient vector [Eq. 2-5] and are given by equations:
[
2 2]
12)
( f G G
mag
f = ∇ = +
∇ x y or ∇f ≈ Gx +Gy Eq. 2-12
⎟ ⎟ ⎠ ⎞ ⎜ ⎜ ⎝ ⎛
= −
y x
G G y
x, ) tan 1
(
Further processing usually consists of linking edge elements separated by small gaps and removing short segments that are unlikely to be part of an important boundary. Local processing methods for edge linking are usually generic and they do not give good results in many situations. More often than not methods aiming to identify certain shapes in the set of produced edge pixels are used.
Line and curve fitting techniques for edge linking
Lowe [107] describes a method to recognize three-dimensional objects from single two-dimensional images. His method is based on matching certain structures of identified lines with the three-dimensional description of the model in question. In order to group the edge points resulting from an edge detection process into lines, Lowe proposed a method based on a significance metric for each line fit. The significance of a straight line fit to a list of points was estimated by calculating the rati
rithm was proposed by Rosin and West [166]. n the straight-line description
n is zero. This proved to happen often with short lines. For this metric, a lower significance value would indicate a more significant line. The
o of the length of the line segment divided by the maximum deviation of any point from the line. This measure remains constant under different scales of the image. A line segment is then recursively subdivided at the point of maximum deviation, giving two smaller line segments, and the process is repeated until no line segment is larger than 4 pixels. A binary tree of possible subdivision for each line segment is thus created, and the significance of each sub-segment is calculated. Then following a bottom-up procedure a decision is made at each junction as to whether to keep the two sub-segments or replace them with the higher-order one. If the significance of any of the sub-segments is greater than the significance of the complete segment, then the sub-segments are preferred. This is a very compact approach, which manages to approximate any set of linked pixels with a number of line segments, independently from the scale of the image in hand.
An extension of the above algo
They suggested that circular arcs could be detected i
sign
jects of known shape and size, locating those objects is gen
d due to Hough for replacing the problem of finding collinear pixels in the image, by the equivalent one of finding concurrent lines in the slope-intercept space. In general, the n lines in the slope-intercept space would intersect in n(n-1)/2 points, corresponding to the lines between each pair of points in the image plane (Figure 2-4). Finding exactly collinear sets of image points is possible by finding coincident points of intersection in the slope-intercept space, but this approach would be computationally exhaustive. Instead, Hough proposed to specify an acceptable error in the line parameter values, thus quantize the slope-intercept space in a number of cells. This array of cells is called the accumulator array. The method described reduces significantly the computational weight of working directly ificance metric for an arc is calculated similarly to the significance of line, as the maximum deviation of any point from the circle divided by the length of the arc segment. This is equivalent to the significance measure for straight lines, allowing direct comparison between the two.
Hough transform based techniques for edge linking When the image consists of ob
erally a trivial task. In the vast majority of cases though, the actual objects in the image differ substantially from the description given, due to rotation, zoom, and certain shape distortions. In these cases even if an analytical expression of the shape is known beforehand, matching it with the edge pixels identified in the image is a complicated task.
Suppose for example, the simple case where a number of edge pixels have been identified and the goal is to find lines that best fit on these pixels. The straightforward way to achieve it, would be to compute all the lines determined by every pair of pixels, and check the proximity of the rest of the pixels to each line. This is a computational prohibitive approach. One very effective method to solve the problem was proposed by Hough [77].
into the image space, while it is insensitive to missing parts of lines, noise and other non-line structures present in the image.
b = -x·a + y
b = -x1
·a + y1 b
a b = -x2·a + y2 y = a·x + b
(x1,y1) (x2,y2)
y = a ’·x +
b’
y
b’
a’ x
(a) (b)
Figure 2-4 – (a) Image space for Hough transform; (b) Slope-intercept space for Hough transform.
with that approach, is that both slope and intercept, which were the param
One basic problem
eters used by Hough are unbounded (slope is infinite for vertical lines), complicating the application of the technique. Duda and Hart [46], proposed the use of a different parameter space. They proposed the use of the so-called normal parameterisation to describe a line. According to that, each line can be described by the angle of its normal θ and the algebraic distance from the origin ρ. Using these parameters, the equation of a line would be given by:
θ θ
ρ = x⋅cos +y⋅sin Eq. 2-14
π θ < ≤
0 , − 2D≤ρ < 2D Eq. 2-15
If θ is restricted to the interval [0, π] then the normal parameters for a line are
lines, is that both d ρ can be confined as shown in Eq. 2-15 where D is the distance between corners in the image, since points outside this rectangle correspond
θ an
to lines outside the image in the image plane.
θ θ ρ
(x1,y1)
(x2,y2)
x
y ρ=x⋅cosθ+y⋅sinθ
' sin ' cos
' θ θ
ρ=x⋅ +y⋅
ρ θ
sin cos + ⋅ ⋅
=x y ρ
θ
ρ=
x2·co sθ+
y2·sin θ
ρ=
x1·co
sθ+
y1·sin
θ
ρ’
θ’
(a) (b)
Figure 2-5 - (a) Image space for Hough transform; (b) θ-ρ space for Hough transform.
n be described by an analytical
is called a directed graph. If an arc is directed from node ni to node nj, then nj is called
a successor of its parent n