Development and Testing of Impregnated La0.20Sr0.25Ca0.45TiO3 Anode
Microstructures for Solid Oxide Fuel Cells
R. Price a, M. Cassidy a, J. A. Schuler b, A. Mai b and J. T. S. Irvine a
a School of Chemistry, University of St Andrews, St Andrews, Fife, KY16 9ST, UK b HEXIS AG, Zum Park 5, CH-8404 Winterthur, Switzerland
The A-site deficient perovskite: La0.20Sr0.25Ca0.45TiO3 (LSCTA-) is a mixed ionic and electronic conductor (MIEC) which shows promising performance as a Solid Oxide Fuel Cell (SOFC) anode ‘backbone’ material, when impregnated with metallic and oxide-ion conducting electrocatalysts. Here, we present data on the complete ceramic processing and optimisation of the LSCTA- ‘backbone’ microstructure, in order to improve current distribution throughout the anode. Through control of ink rheology, screen printing parameters and sintering protocol an advantageous LSCT A-microstructural architecture was developed, exhibiting an ‘effective’ conductivity of 21 S cm-1. Incorporation of this LSCTA- anode microstructure into SOFC and impregnation with Ce0.80Gd0.20O1.9 and either Ni, Ru, Rh, Pt or Pd resulted in promising initial performances during fuel cell testing in a fuel stream of 97% H2:3% H2O. Area Specific Resistances of 0.41 Ω cm2 and 0.39 Ω cm2 were achieved with anodes containing Rh/CGO and Pd/CGO, respectively.
Introduction
Solid Oxide Fuel Cells (SOFC) are electrochemical energy conversion devices which provide a cleaner and more efficient method of electricity generation to combustion of natural gas (1). Due to the solid oxide electrolyte employed in SOFC, high operating temperatures (>600 °C) must be employed in order to allow oxide anion migration from the cathode to the anode(2). This, therefore, allows the simultaneous generation of high-quality heat, making these devices ideal for use in combined heat and power (CHP) applications5.
Although in many respects the current industrial standard Ni-based cermet anode works very well, it also exhibits some undesirable characteristics when exposed directly to natural gas from the national grid system. Some examples include coking intolerance, irreversible sulfur poisoning (by naturally occurring H2S and odourising agents) and its inherent redox instability (1). Therefore, a novel SOFC anode material is required in order to minimise or eliminate these undesirable responses to the fuel gas.
gas reformed by a Catalytic Partial Oxidation (CPOx) catalyst (3). Although LSCTA- does not show electrocatalytic activity towards H2 and CO oxidation, impregnation of Ce0.8Gd0.2O1.9 (CGO) and Ni electrocatalysts into the backbone improved performance significantly.
This system test achieved an initial power output of 70 % of the nominal 1 kW generated by the system. Unfortunately, degradation to ~250 W after 600 hours of operation was observed and attributed to very thin, dense anode microstructures, leading to poor current distribution, as well as severe agglomeration of the Ni electrocatalyst particles(3). On the other hand, this research highlighted that the Ni/CGO catalysts exhibited reversible sulfur poisoning, in the presence of ~8 ppm H2S(3).
Recent research into improvement of the LSCTA- ‘backbone’ microstructure has resulted in the successful creation of a more advantageous microstructural architecture capable of delivering high ‘effective’ conductivities, keeping ohmic losses sufficiently low whilst allowing enough grain connectivity to ensure high lateral conductivity.
Here, we present data on the optimisation of the LSCTA- backbone using ceramic processing techniques, DC conductivity testing of a series of candidate microstructures and AC Impedance spectra from short term fuel cell testing of the chosen LSCTA- anode microstructure, impregnated with a series of different catalysts.
Experimental
Ceramic Processing
Screen printing inks were prepared by planetary ball milling La0.20Sr0.25Ca0.45TiO3 powder (Treibacher Industrie AG, Austria), terpineol (anhydrous, mixture of isomers, Sigma-Aldrich) and Hypermer KD1 Dispersant (Uniqema) in terpineol at high speed for 2 hours. A polyvinyl butyral binder (PVB) (Butvar, Sigma-Aldrich) in terpineol was mixed in using the same method at a reduced milling speed for 30 minutes.
LSCTA- inks were screen printed onto 18 mm diameter 8YSZ electrolytes (St Andrews) and 34 mm diameter 6ScSZ electrolytes (HEXIS) in a 1 cm2 square anode geometry using a DEK248 semi-automatic screen printer. Half-cells of LSCTA- on 8YSZ were prepared for sintering trials and four-point DC conductivity measurements. Both 325 and 230 mesh screens were used to print anode layers, with each screen requiring different numbers of prints to achieve the same thickness of anode. Green anode layers were fired in air using a range of firing temperatures and dwell times to produce a variety of different microstructures.
Impregnation of LSCTA- ‘Backbone’ Microstructures
The most suitable LSCTA- ‘backbone’ microstructure was subsequently impregnated with oxide ion conducting and metallic electrocatalysts by a solution method. Firstly, Ce0.80Gd0.20O1.9 (CGO) was impregnated into the anode microstructure using an ethanol-based solution of Ce(NO3)3.6H2O (99 %, Sigma-Aldrich) and Gd(NO3)3.6H2O (99 %, Sigma-Aldrich), dissolved in the required molar ratios. An autopipette was used to deposit the impregnate solution onto the surface of the anode, before allowing the solution to diffuse into the ‘backbone’. Subsequently, the solvent was evaporated at 80 °C before repeating this impregnation process. After two impregnation cycles, the nitrate precursors were calcined up to 500 °C. Once the desired loading of CGO was achieved, the same process was employed to introduce the metallic electrocatalysts: Ni, Ru, Rh, Pt and Pd. The metallic catalyst precursors employed were dissolved or diluted, if already in solution form, using ethanol: Ni(NO3)3.6H2O (99 %, Acros Organics) Ru(NO3)3(NO), Rh(NO3)3, Pt(NO3)3 and Pd(NO3)3 (nitric acid-based, Johnson Matthey).
Characterisation and Fuel Cell Testing
Scanning Electron Microscopy (SEM) of the LSCTA- ‘backbone’ microstructures was carried out using a Jeol JSM 6700F FEG-SEM; porosity measurements were carried out on the SEM images using ImageJ; rheometric analysis of the anode inks was undertaken using a Brookfield DV-III Ultra Rheometer, equipped with a small sample spindle (SC4-14), and particle size analysis was carried out using a Malvern Instruments Mastersizer 2000.
Au wires and paste were used to produce a linear array of electrodes on the surface of LSCTA- anode layers for four-point DC conductivity testing of half-cells. A Keithley 2401 SourceMeter was used as a current/voltage source. Measurements were carried out in an atmosphere of 5% H2:95% Ar up to 900 °C, with a reduction period of 18 hours at this temperature, before data collection during cooling.
Fuel cell testing was carried out in a sealless setup in order to provide an analogous testing environment to the HEXIS system. Au meshes with integrated Au wires were attached to both electrodes for current collection using Au paste, before firing up to 750 °C in air to ensure good contact. The cell was insulated from the Inconel cell housing using alumina felt, before being compressed and secured. Testing occurred up to 900 °C with a 3 % H2O/97 % H2 fuel gas and compressed air as an oxidant (both at flow rates of 250 mL min-1). AC impedance spectra were collected using a Solartron SI 1280B Electrochemical Measurement System.
Results and Discussion
Ink Formulation and Characterisation
increasing the solids loading of the ink. Therefore, determination of the maximum solids loading was targeted first.
A series of screen printing inks with different solids loadings of LSCTA- were produced by maintaining constant quantities of LSCTA-, dispersant and binder, whilst varying the solvent quantity. Screen printing inks spanning 62 % to 75 % solids loading were successfully created and were subsequently analysed rheologically, to determine which ink had ideal screen printing characteristics.
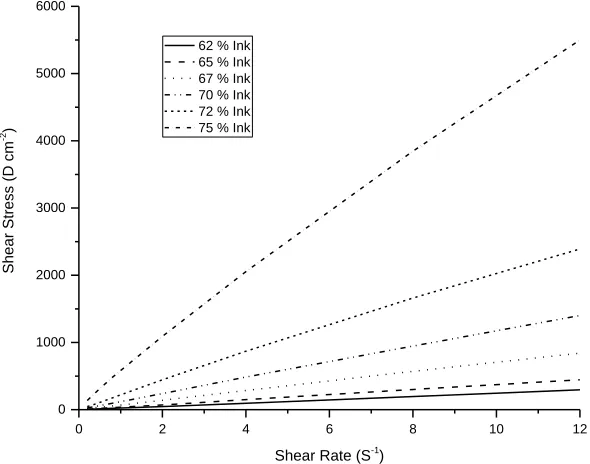
Rheological analysis of these inks was carried out by recording shear stress as a function of shear rate, and subsequent fitting of the data to a power law behaviour allowed flow indices to be calculated for each ink (table 1). The flow index provides a measure of the degree of variation from Newtonian flow. A value of 1 indicates purely Newtonian behaviour, whilst values of >1 and <1 indicate dilatant (shear-thickening) and pseudoplastic (shear-thinning) behaviour, respectively. LSCTA- Inks with solids loadings between 62 % and 65 % may be described as Newtonian fluids, whilst those falling between 67 % and 72 % solids loading maybe described as Newtonian-like fluids, with values close to unity. However, once a solids loading of 75 % is reached, a flow index of 0.80 is achieved, indicating a large departure from Newtonian behaviour. Corresponding plots of shear stress versus shear rate for these inks are shown in figure 1.
[image:4.612.158.453.342.574.2]
Figure 1. Plot of shear stress against shear rate for all solids loadings of LSCTA- inks produced.
A flow index of 0.80 indicates pseudoplastic or shear-thinning behaviour. Therefore, the 75 % solids loading ink (LSCT75) exhibits a reduction in viscosity upon application of shear stress (4), which is an ideal characteristic for a screen printing ink. For example, during screen printing this viscous ink exhibits a temporary drop in viscosity as the print head (squeegee) moves over the screen, shearing the ink. This allows the ink to flow through the porous geometry of the screen onto an underlying electrolyte. Subsequent relaxation allows the ink to return to equilibrium viscosity, preventing lateral leakage and loss of electrode geometry (5). This ink also exhibits very little thixotropy: time-dependent shear-thinning behaviour. Sometimes small amounts of this type of behaviour can help to
0 2 4 6 8 10 12
0 1000 2000 3000 4000 5000 6000
Shea
r Stress
(D cm
-2 )
Shear Rate (S-1
)
remove mesh marks formed during the screen printing process, leaving a smooth and flat electrode layer.
Particle size analysis (PSA) was also carried out in order to assess the dispersion of the inks in comparison to the raw LSCTA- powder (table I). Inks were dispersed in isopropyl alcohol, a standard organic ink solvent, whilst LSCTA- powder was dispersed in distilled water. PSA indicated that the raw LSCTA- powder had a D50 value of 1.74 μm, whilst LSCTA- particles dispersed within inks generally showed better dispersion due to the presence of the Hypermer KD1 dispersant. LSCT75 exhibited the best dispersion, with D50 = 1.53 μm, and so this particular ink was chosen for screen printing trials.
Table I. Rheometric flow indices and particle size distribution data for the LSCTA- inks created.
Solids (LSCTA-) Loading of Ink/% Flow Index/a.u. D50/μm
62 1.00 1.66
65 1.00 1.69
67 0.98 2.01
70 0.98 1.77
72 0.95 1.67
75 0.80 1.53
LSCTA- Powder - 1.74
Microstructural Control and Optimisation
Screen printing of LSCT75 was carried out with two screens of differing mesh count: a 325 mesh count (per inch) screen and a 230 mesh count screen. Consequently, deposition of green anode bodies with each screen results in thick-film layer with very different physical characteristics. For example, the 325 mesh count screen has a smaller open porosity for the ink to flow through and is manufactured from a finer mesh, than the 230 mesh count screen. Therefore, deposition of a single layer with the 325 mesh screen provides a thinner print than with the 230 mesh screen.
In order to ensure sufficient lateral electronic conductivity was possible in each LSCT A-‘backbone’, a minimum thickness of 50 µm was targeted, meaning different numbers of printing and drying cycles were required to achieve this thickness based on the mesh count of the screen. In the case of the 325 mesh count screen, 5 printing and drying cycles were required to achieve this thickness, whilst only 3 cycles were required with the 230 mesh count screen.
Firstly, the 325 mesh count screen was used to print LSCT75 onto electrolyte supports. After 5 printing and drying cycles, the green LSCTA- bodies were sintered at a variety of temperatures and dwell times in order to determine the effect of sintering protocol on the physical properties of the layer. These properties are summarised in table II and the corresponding scanning electron micrographs a presented in figure 2.
[image:5.612.110.487.218.312.2]
TABLE II. Details of sintering protocol and final porosities for screen printed anode layers of LSCT75 (with a 325 mesh screen).
Sintering Temperature/°C Dwell Time/hours Porosity/%
1325 1 41.5
1325 2 41.2
1350 1 40.1
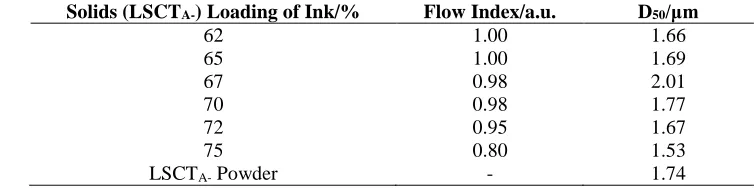
Figure 2. SEM images of the fuel electrode ‘backbone’ microstructures (screen printed with a 325 mesh
screen) for samples sintered at: a) 1325 °C/1h, b) 1325 °C/2h, c) 1350 °C/1h and d) 1350 °C/2h.
Based on the data in table II, the porosity of the LSCTA- anode ‘backbone’ microstructure clearly decreases with increasing sintering temperature and dwell time, as expected. This observation is further supported by the micrographs in figure 4 which show that the LSCTA- grains do not seem to form particle necks, but rather meet at grain boundaries until sintering conditions of 1350 °C for 2 hours are employed. Using these sintering conditions, a microstructure with the desired style of grain connectivity is achieved, however, the porosity of this sample (38.4 %) is likely to introduce problems during the impregnation process as the ‘backbone’ structure will be coated with catalyst species which will decrease the porosity of the anode further, potentially causing mass transport issues in the electrode.
Subsequently, the same sintering conditions were used to prepare a series of microstructures printed with the 230 mesh count screen. In this case, only 3 printing and drying cycles were required to achieve the 50 µm anode thickness. The physical properties of the resultant anodes, after sintering, are summarised in table III and corresponding microstructures are presented in figure 3.
TABLE III. Details of sintering protocol and final porosities for screen printed anode layers of LSCT75 (with a 230 mesh screen).
Sintering Temperature/°C Dwell Time/hours Porosity/%
1325 1 48.3
1325 2 47.9
1350 1 46.3
1350 2 46.1
a b
[image:6.612.139.474.46.322.2] [image:6.612.163.450.636.703.2]
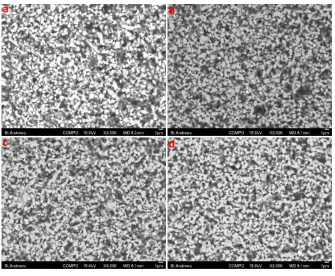
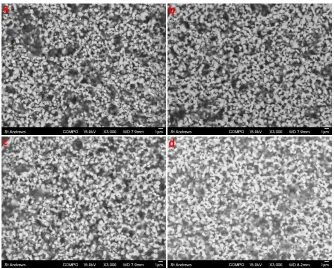
Figure 3. SEM images of the fuel electrode ‘backbone’ microstructures (screen printed with a 230 mesh
screen) for samples sintered at: a) 1325 °C/1h, b) 1325 °C/2h, c) 1350 °C/1h and d) 1350 °C/2h.
Analogous microstructures produced using the 230 mesh count screen retain porosity more easily than those printed with the 325 mesh count screen due to the difference in open porosity of the two screens. The 230 mesh count screen has a larger open porosity than the 325 mesh screen and, therefore, inks that are forced through the print geometry will experience different magnitudes of shear stress. For an ink flowing through a larger channel, the shear stress experienced, as it passes through the screen, is reduced in comparison to passing through a channel of smaller dimensions. In this case, the ink will not be displaced as far from its equilibrium viscosity and so the time available to return to equilibrium is comparatively reduced (6). As a result, the LSCTA- particles have less time to rearrange within the ‘wet’ green body allowing a less dense packing arrangement to develop in the green body which gives rise to a higher porosity in the sintered LSCTA- ‘backbone’.
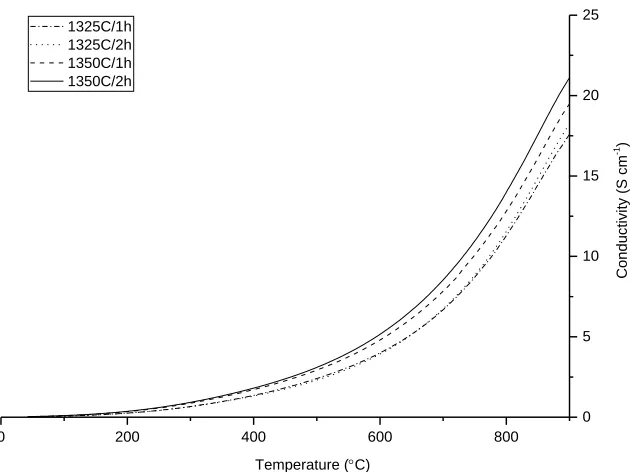
In the series of microstructures prepared using the 230 mesh screen, porosity also decreases as a function of both temperature and dwell time and, once again, the desired style of grain connectivity is not achieved until the green LSCTA- body is sintered at 1350 °C for 2 hours. This particular microstructure retains over 46 % porosity, making it ideal for impregnation of oxide-ion conductor materials and metallic electrocatalysts, whilst exhibiting an advantageous style of grain connectivity which is required to allow good current distribution through the anode ‘backbone’. It is expected that as the grain connectivity of the electrode ‘backbone’ material increases (i.e. as sintering temperature and dwell time increase), the electrical conductivity of the ‘backbone’ will also increase. Thus, in order to validate this prediction and assess the suitability of the LSCT A-microstructure sintered at 1350 °C for 2 hours, a series of four-point DC conductivity measurements were performed on all of the microstructures screen printed with the 230 mesh screen (figure 4).
a b
[image:7.612.139.473.51.320.2]
Figure 4. Plots of DC conductivity for the LSCTA- anode ‘backbones’ produced, as a function of temperature (collected upon cooling) in 5 % H2/Ar.
As the half cells produced for these analyses contained grain boundaries, in addition to high levels of porosity, it is not possible to compare the data in figure 4 directly with bulk conductivity values for the pure LSCTA- material. Instead, the ‘effective’ conductivity (σeff) of the LSCTA- anode ‘backbone’ microstructure is given, which provides information on the electrical conductivity of the ‘backbone’ in a representative electrode system. The data in figure 6 show that as the density of the anode ‘backbone’ increases, σeff increases. Thus, the data confirm that the LSCTA- anode layer sintered at 1350 °C for 2 hours provided the highest ‘effective’ electrical conductivity with ~21 S cm-1 at 900 °C in 5% H
2/Ar. Therefore, this microstructure was selected for use in further testing.
Impregnation of Electrocatalysts and Fuel Cell Testing
Electrolyte-supported fuel cells were prepared with an LSCTA- ‘backbone’ microstructure sintered under the aforementioned conditions. As LSCTA- has previously shown very low electrocatalytic activity towards H2 oxidation (7), impregnation of a Ce0.8Gd0.2O1.9 (CGO) oxide ion conductor phase and second metallic electrocatalyst was carried out to improve this activity. Catalyst loadings of 13-16 wt. % of CGO and 2-5 wt. % of the metallic catalysts were used in the anodes (table IV). Smaller loadings of the platinum group metal (PGM) catalysts were employed, in comparison to Ni, firstly as PGMs provide higher activity for H2 oxidation than Ni and, secondly, due to the substantial price differential between commonly available transition metal catalysts and PGMs.
0 200 400 600 800
0 5 10 15 20 25
Conduc
ti
v
ity
(S c
m
-1)
Temperature (C) 1325C/1h
Table IV. A summary of the metallic impregnates used in the fuel cell anodes.
Fuel Cell ID: Oxide Impregnate: Wt. % of Anode: Metallic Impregnate: Wt. % of Anode:
1 CGO 13 Ni 5
2 CGO 16 Ru 3
3 CGO 13 Rh 2
4 CGO 14 Pt 2
5 CGO 14 Pd 2
[image:9.612.92.523.86.156.2]
Initial short-term testing of these fuel cells in 3% H2O/97% H2 was very encouraging, especially considering the thick 6ScSZ electrolyte support used in these cells. The AC impedance spectra presented in figure 5 indicate that even with a 2-3 wt.% loading of PGM electrocatalysts, each of the anode catalyst systems shows an improvement upon the performance of the Ni/CGO containing anode (in which the Ni exhibits deactivation by sulphur poisoning) (3).
Figure 5. AC Impedance spectra for fuel cells 1-5, acquired at 900 °C and 0.8 V bias.
Figure 6. Equivalent Circuits used to fit the AC impedance spectra of a) fuel cells 1,2,3 and 5 and b) fuel cell 4.
0.00 0.20 0.25 0.30 0.35 0.40 0.45 0.50 0.55 0.60 0.00 0.05 0.10 0.15 0.20 0.25 0.30
Pd/CGO 0.8 V Pt/CGO 0.8 V Rh/CGO 0.8 V Ni/CGO 0.8 V Ru/CGO 0.8 V
Z' ' ( c m 2)
Z' ( cm2)
L1 R1 R2
CPE2
R3
CPE3
Element Freedom Value Error Error %
L1 Free(+) 5.0797E-07 1.2217E-07 24.051
R1 Fixed(X) 0.264 N/A N/A
R2 Fixed(X) 0.22 N/A N/A
CPE2-T Free(+) 0.0088232 0.00019226 2.179
CPE2-P Free(+) 0.80568 0.0026631 0.33054
R3 Free(+) 0.086416 0.0022943 2.6549
CPE3-T Free(+) 1.899 0.10449 5.5024
CPE3-P Free(+) 0.60046 0.012052 2.0071
Chi-Squared: 2.4596E-05
Weighted Sum of Squares: 0.0011806
Data File: C:\Users\Robert\Documents\St Andrews\PhD
\Data\Fuel Cell Testing\Versa Rig\Gold C ontact Tests\NiCGOLSCT VERSA (HEXIS34MFC 12)\EIS h2 07v 900.z
Circuit Model File: C:\Users\Robert\Documents\St Andrews\PhD \Data\Fuel Cell Testing\Anode Model RP.m dl
Mode: Run Fitting / Selected Points (15 - 41)
Maximum Iterations: 100
Optimization Iterations: 0
Type of Fitting: Complex
Type of Weighting: Calc-Modulus
L1 R1 R2
CPE2
R3
CPE3
R4
CPE4
Element Freedom Value Error Error %
L1 Free(+) 2.8184E-06 N/A N/A
R1 Free(+) 4.72 N/A N/A
R2 Fixed(X) 0 N/A N/A
CPE2-T Fixed(X) 0 N/A N/A
CPE2-P Fixed(X) 1 N/A N/A
R3 Free(+) 0.12121 N/A N/A
CPE3-T Free(+) 0.0084628 N/A N/A
CPE3-P Free(+) 0.83147 N/A N/A
R4 Free(+) 0.7173 N/A N/A
CPE4-T Free(+) 0.032954 N/A N/A
CPE4-P Free(+) 0.80902 N/A N/A
Data File:
Circuit Model File: C:\Users\Robert\Documents\St Andrews\PhD \Data\Fuel Cell Testing\Anode Model MCV. mdl
Mode: Run Fitting / Selected Points (0 - 0)
Maximum Iterations: 100
Optimization Iterations: 0
Type of Fitting: Complex
Type of Weighting: Calc-Modulus
a)
[image:9.612.153.460.295.544.2]Table V. The resistance values extracted from AC impedance spectra presented in figure 4.
Fuel Cell ID: Rs/Ω cm2 Rp1/Ω cm2 Rp2/Ω cm2 Rp3/Ω cm2 ASR/Ω cm2
1 0.25 0.23 - 0.07 0.55
2 0.21 0.17 - 0.08 0.46
3 0.26 0.06 - 0.09 0.41
4 0.25 0.10 0.03 0.08 0.46
5 0.24 0.06 - 0.09 0.39
AC impedance spectra were fitted with one of two equivalent circuits illustrated in figure 6. All spectra were fitted with an inductor L1, a resistor R1 (Rs) and either 2 or 3 constant phase elements which represent individual frequency dependent processes (each of which has a polarization resistance). Table V summarises the values of series resistance (Rs), polarisation resistance (Rp) and area specific resistance (ASR) obtained from equivalent circuit fitting. Fuel cells 1, 2, 3 and 5 were fitting using the equivalent circuit in figure 8a, showing two distinct frequency responses; a high frequency response between 700-100 Hz, which may possibly be attributed to the charge transfer processes of the anode (7), and a low frequency arc which is consistently observed at 4.0-3.2 Hz. The low frequency arc, when fitted, returns a consistently similar polarization resistance of 0.07-0.09 Ω cm2, which is also independent of temperature. This is attributed to gas conversion impedance and is related to test rig design (8) rather than electrode processes. Fuel cell 4 displays an additional low resistance, mid-frequency arc ~80 Hz which is thought to be a surface adsorption/diffusion process, though further characterisation is required to confirm this interpretation.
Based upon the performances described above, the most promising impregnated catalyst systems appear to be Rh/CGO and Pd/CGO with ASR of 0.41 Ω cm2 and 0.39 Ω cm2at 900 °C, respectively. Therefore, fuel cells containing these catalysts should be subjected to durability testing as well as testing in fuel streams containing both CO and H2S. The Rh/CGO catalyst system is particularly interesting due to reports of sulphur tolerance and recoverable performance in catalyst systems containing Rh, e.g. in dry reforming of methane, in biogas, using a Rh-exsolving perovskite (9).
Conclusion
(in 5% H2/Ar), with the highest values pertaining to the most advantageous microstructure. Electrolyte-supported fuel cells employing this ‘backbone’ microstructure, impregnated with 13-16 wt. % (of the ‘backbone’) of CGO and 2-5 wt. % of either Ni, Ru, Rh, Pt or Pd, showed very promising performances during short-term electrochemical testing in humidified hydrogen. Fuel cells with anodes containing Rh/CGO and Pd/CGO catalyst systems were particularly promising, achieving Area Specific Resistances of 0.41 Ω cm2 and 0.39 Ω cm2, respectively.
Acknowledgements
We would like to thank Dr Cristian Savaniu for helping to carry out DC conductivity testing, as well as the EPSRC project EP/M014304/1 “Tailoring of Microstructural Evolution in Impregnated SOFC Electrodes”, the University of St Andrews and HEXIS AG for funding.
References
1. C. Sun and U. Stimming, J. Power Sources, 171, 247 (2007).
2. J. H. Hirschenhofer, D. B. Stauffer, R. R. Engleman and M. G. Klett, Fuel Cell Handbook, 4th Ed., p. 1-4, Parsons Corporation, Philadelphia, (1998).
3. M. C. Verbraeken, B. Iwanschitz, E. Stefan, U. Weissen, A. Mai and J. T. S. Irvine, Fuel Cells, 5, 682 (2015).
4. R. Mistler and E. Twiname, Tape Casting: Theory and Practice, p. 80, The American Ceramic Society, Westerville (2000).
5. C. B. Carter and M. G. Norton, Ceramic Materials, 2nd Ed., p. 503, Springer, New York (2013).
6. J. Savage in Handbook of Thick Film Technology, P. J. Holmes and R. G. Loasby, Editors, p. 57, Electrochemical Publications Ltd., Port Erin (1976).
7. M. C. Verbraeken, B. Iwanschitz, A. Mai and J. T. S. Irvine, J. Electrochem. Soc.,
159, F757 (2012).