The evolution of post-starburst galaxies from
z
=
2 to 0
.
5
Vivienne Wild,
1‹Omar Almaini,
2Jim Dunlop,
3Chris Simpson, Kate Rowlands,
1Rebecca Bowler,
4David Maltby
2and Ross McLure
31SUPA†, School of Physics and Astronomy, University of St Andrews, North Haugh, St Andrews KY16 9SS, UK 2University of Nottingham, School of Physics and Astronomy, Nottingham NG7 2RD, UK
3SUPA†, Institute for Astronomy, University of Edinburgh, Royal Observatory, Blackford Hill, Edinburgh EH9 3HJ, UK 4Subdepartment of Astrophysics, University of Oxford, The Denys Wilkinson Building, Keble Road, Oxford OX1 3RH, UK
Accepted 2016 August 8. Received 2016 August 2; in original form 2016 April 1
A B S T R A C T
We present the evolution in the number density and stellar mass functions of photometrically selected post-starburst galaxies in the UKIDSS Ultra Deep Survey, with redshifts of 0.5< z <2 and stellar masses log (M/M)>10. We find that this transitionary species of galaxy is rare at all redshifts, contributing∼5 per cent of the total population atz∼2, to<1 per cent by
z∼0.5. By comparing the mass functions of quiescent galaxies to post-starburst galaxies at three cosmic epochs, we show that rapid quenching of star formation can account for 100 per cent of quiescent galaxy formation, if the post-starburst spectral features are visible for∼250 Myr. The flattening of the low-mass end of the quiescent galaxy stellar mass function seen atz∼1 can be entirely explained by the addition of rapidly quenched galaxies. Only if a significant fraction of post-starburst galaxies have features that are visible for longer than 250 Myr, or they acquire new gas and return to the star-forming sequence, can there be significant growth of the red sequence from a slower quenching route. The shape of the mass function of these transitory post-starburst galaxies resembles that of quiescent galaxies atz∼2, with a preferred stellar mass of log (M/M)∼10.6, but evolves steadily to resemble that of star-forming galaxies atz <1. This leads us to propose a dual origin for post-starburst galaxies: (1) atz 2 they are exclusively massive galaxies that have formed the bulk of their stars during a rapid assembly period, followed by complete quenching of further star formation; (2) atz1 they are caused by the rapid quenching of gas-rich star-forming galaxies, independent of stellar mass, possibly due to environment and/or gas-rich major mergers.
Key words: galaxies: evolution – galaxies: formation – galaxies: high-redshift – galaxies: luminosity function, mass function – galaxies: stellar content.
1 I N T R O D U C T I O N
In the local Universe, the population of massive galaxies is bimodal in both structure and spectral type: the majority can be described as either being quiescent and elliptical, or star-forming and spiral. Understanding the origin of this bimodality in the galaxy popula-tion has been the topic of considerable research for many decades. Recently, large multiwavelength surveys have allowed us to mea-sure the fraction of quiescent and star-forming galaxies over a large portion of cosmic time, providing direct observations of the emer-gence of galaxy bimodality. These have shown that both the number density of quiescent galaxies, as well as their total stellar mass
E-mail:[email protected]
†Scottish Universities Physics Alliance
sity, increases steadily with time since at leastz∼3–4 (e.g. Bell et al.2004; Faber et al.2007; Ilbert et al.2013; Muzzin et al.2013), although details depend on the survey as well as the methods used to calculate photometric redshifts and stellar masses, and to iden-tify quiescent galaxies. As quiescent galaxies are unable to form new starsin situ, the increase in the global stellar mass density of quiescent galaxies must arise from a cessation of star formation in star-forming galaxies and transfer of galaxies from the star-forming to quiescent populations. This process has come to be known as galaxy ‘quenching’, and one of the central questions in galaxy evo-lution research is which physical processes are responsible for this shut down in star formation in a portion of the galaxy population.
The presence of quiescent galaxies out to redshifts ofz∼4 or more (e.g. Straatman et al.2014), shows that star formation can be rapidly quenched following an early formation epoch. These early quiescent galaxies are found to be elliptical and highly compact (e.g.
2016 The Authors
at University of Nottingham on January 12, 2017
http://mnras.oxfordjournals.org/
Daddi et al.2005; Damjanov et al.2009; van der Wel et al.2014). The current generation of simulations suggest that early quiescent, elliptical systems could have formed through strongly dissipative processes such as disc instabilities and mergers, where there is a rapid gas inflow towards the centres of the galaxies (Hopkins et al.
2009b; Wuyts et al.2010; Dekel & Burkert2014; Ceverino et al.
2015; Zolotov et al.2015). In these simulations, massive and effi-cient outflows are also required to expel the remainder of the gas that is not consumed by star formation. This feedback may be caused by the rapid gas accretion leading to self-regulated star formation via supernovae feedback (e.g. Muratov et al.2015); ‘quasar-mode’ active galactic nuclei (AGN) have also been suggested to play a role in the final removal of gas from the system (e.g. Silk & Rees1998; Di Matteo, Springel & Hernquist2005). These postulated feedback mechanisms should act quickly, over time-scales of the order of 108yr and could explain the rapid quenching of galaxies observed. Regardless of the mechanism invoked to explain the initial quench-ing event, maintainquench-ing the quiescence of high-redshift galaxies in such a gas-rich environment remains a challenge for models (e.g. see the discussion in Gabor et al.2010), with scenarios invoking suppression of a fresh gas supply by shocks maintaining a hot cir-cumgalactic halo (e.g. Dekel & Birnboim2006; Zolotov et al.2015), or ‘radio-mode’ AGN feedback (e.g. Bower et al.2006; Croton et al. 2006). Observationally, Best et al. (2006) showed that radio-loud AGN could provide sufficient energy to prevent the further growth of massive elliptical galaxies; however, direct observational evidence for feedback mechanisms to directly remove significant quantities of gas from galaxies is largely lacking.
At lower redshifts (z2), the continued increase in the number density of quiescent galaxies (e.g. Moustakas et al.2013; Moutard et al.2016) shows that processes remain in place that quench star for-mation, even as the gas fractions in galaxies decrease, discs become more stable and cold gas streams shut down. The relatively con-stant number density of star-forming galaxies, combined with the global decline in star formation rate density by a factor of∼10 since
z∼2 (Madau & Dickinson2014), indicates that typical star-forming galaxies are gradually decreasing their star formation rates over time-scales of several Gyr. However, it is unclear to what extent this decrease in the average star formation rate of star-forming galaxies is related to the formation of completely quiescent galaxies. In par-ticular, the approximately coeval increase in the fraction of galaxies with elliptical-like morphologies (e.g. Bruce et al.2012; Buitrago et al.2013), and the strong correlation between quiescent galaxies and a predominantly spheroid morphology at all redshifts (e.g. Bell et al.2012; Lang et al. 2014; Bruce et al.2014; Brennan et al. 2015; Ownsworth et al.2016), suggests that the dominant quench-ing mechanism is more than a simple depletion of gas supplies.
Gas-rich major mergers have long been considered a strong can-didate for forming at least some types of elliptical galaxies, and are perhaps particularly relevant atz <1 where the additional processes that can lead to dissipational collapse at high redshift become less likely. Numerical simulations indicate that gas-rich mergers are able to shut down star formation through rapid depletion of gas supplies, potentially accompanied by strong feedback, as well as disrupt the stellar orbits leading to an elliptical remnant (e.g. Toomre & Toomre 1972; Cox et al.2006; Naab, Jesseit & Burkert2006). However, cosmological hydrodynamical simulations illustrate the many com-plexities of the problem (Naab et al.2014), discs may survive or regrow following a merger (Governato et al.2009; Hopkins et al.
2009a; Athanassoula et al.2016), and observationally it remains
difficult to firmly link major mergers to the increasing quiescent fraction.
Ultimately, the assembly history of the quiescent galaxy popu-lation is unlikely to be simple, with different physical processes dominating at different stellar masses and redshifts (see e.g. Choi et al.2014; Brennan et al.2015). Given the number of free pa-rameters, studying the evolution of the distribution of galaxies in star formation rate/stellar mass/morphology planes can only help to constrain the role of different processes in shutting down star formation in combination with detailed models which help to link cause and effect. A more direct method involves the identifica-tion of galaxies caught in the act of transiidentifica-tion: either those thought to be in the final stage of a starburst (Barro et al.2014; Nelson et al.2014; van Dokkum et al.2015), or galaxies that have recently quenched their star formation (Wild et al.2009; Whitaker et al.2012; Pattarakijwanich et al.2014). One such class of transition galax-ies are post-starburst (PSB) galaxgalax-ies, which are identified by their (temporally resolved) recent star formation history. The presence of strong Balmer absorption lines, or a significant Balmer break, in their spectra indicates an increased fraction of A/F stars. When these spectral features are strong enough, simulations show that this implies a recent, short and strong burst of star formation, followed by rapid truncation (Wild et al.2009, hereafterWWJ09; Snyder et al.2011); weaker features may indicate truncation alone.
At low redshift, PSB galaxies have been linked to merger events (Zabludoff et al.1996; Blake et al.2004; Goto2005; Yang et al. 2008; Pawlik et al.2016), and recently low-redshift PSB galaxies have been found to have significant residual cold gas reservoirs (Zwaan et al. 2013; French et al.2015; Rowlands et al. 2015). Together this implies that multiple merger events may be required to fully quench star formation in low-redshift star-forming galaxies (Rowlands et al. 2015). The formation of quiescent galaxies in the present-day Universe may well follow a slower, less dramatic route than at high redshift where higher gas fractions and plentiful external gas supplies will lead to less stable discs, stronger starbursts and AGN accretion, and stronger associated outflows. Measuring the evolution in the number density, properties and environment of PSB galaxies from the early Universe to the present day may help us to understand the processes responsible for shutting down star formation and building the red sequence.
Until recently, obtaining a large sample of PSB galaxies at red-shifts significantly greater than zero has been impossible, due to the need for moderate signal-to-noise ratio rest-frame optical spectra (Yan et al.2006; Wild et al.2007). Deep redshift surveys such as the Vimos VLT Deep Survey (VVDS) and zCOSMOS have provided samples of a few 10’s atz <1 (WWJ09; Vergani et al.2010). More recently, the Baryon Oscillation Spectroscopic Survey (BOSS) has provided a large number of spectroscopically selected PSB galaxies, but at the expense of a complex sample selection function (Pattarak-ijwanich et al.2014). In Wild et al. (2014, hereafterWA14) we de-veloped a new principal component analysis (PCA) based method to characterize the shape of the optical to near-infrared (NIR) spectral energy distributions (SEDs) of galaxies. Free from constraints of spectral synthesis models, this allowed us to cleanly identify PSB galaxy candidates from broad-band photometry alone, leading to samples of 100’s atz >1. Spectroscopic confirmation both through stacking (WA14) and follow-up observations (Maltby et al.2016), confirms the nature of the photometrically selected PSB galaxies, with between 60 and 80 per cent spectroscopically confirmed as PSB galaxies, depending on the specific criteria used.
The aim of this paper is to investigate the evolution in the number density and mass function of photometrically selected PSB galax-ies, fromz∼2 toz∼0.5. Companion papers present results on their morphology (Almaini et al.2016), spectroscopic confirmation
at University of Nottingham on January 12, 2017
http://mnras.oxfordjournals.org/
(Maltby et al.2016), clustering (Wilkinson et al. in preparation), dust properties (Rowlands et al. in preparation) and environment (Socolovsky et al. in preparation).
Where necessary we assume a cosmology withM=0.3,= 0.7 andh=0.7. All magnitudes are on the AB system (Oke & Gunn 1983). Stellar masses are calculated assuming a Chabrier (2003) initial mass function (IMF) and are defined as the stellar mass remaining at the time of observation.
2 M E T H O D
We select galaxies brighter than a limiting K-band magnitude of 24, from the UKIRT Infrared Deep Sky Survey (UKIDSS) Ultra Deep Survey (UDS) Data Release 8 (DR8), a deep, large area NIR survey and the deepest of the UKIDSS surveys (Lawrence et al. 2007). UKIRT observations provide J, H, Kobservations to 5σ limiting depths in 2 arcsec diameter apertures of 24.9, 24.2 and 24.6 mag, respectively (Hartley et al.2013). Deep optical observa-tions come from the Subaru XMM-Newton Deep Survey (Furusawa et al.2008), to depths of 27.2, 27.0, 27.0 and 26.0 inV,R,i,z. Mid-IR coverage (IRAC 3.6µm) is provided by the Spitzer UDS Legacy Program (SpUDS, PI:Dunlop) to a depth of 24.2. Photome-try was extracted within 3 arcsec diameter apertures at the position of theK-band sources, with an aperture correction applied for the IRAC 3.6µm image. Further details on the methods used to con-struct the UDS DR8 catalogue can be found in Hartley et al. (2013) and Simpson et al. (2012).
Photometric redshifts were computed following Simpson et al. (2013). Briefly, the multiwavelength SEDs were fitted with a linear combination of six solar metallicity, simple stellar population tem-plates with ages logarithmically spaced between 30 Myr and 10 Gyr, and three templates dust-reddened using a Small Magellanic Cloud extinction law.
After masking the survey area for bright stars and regions af-fected by cross-talk, the final science area is 0.62 deg2. The UDS field contains three large clusters at z ∼ 0.6 and 0.85 (SXDF69XGG, SXDF607XGG, SXDF46XGG; van Breukelen et al.2006; Finoguenov et al.2010). As the stellar population of galaxies in clusters differs from that in the field, we tested the impact of removing galaxies potentially associated with these clusters from our analysis, by removing the areas of the survey in which these clusters lie. We found this had no significant impact on our results, including on the evolution of the fraction of quiescent galaxies.
From ourK < 24 catalogue, we select 48 713 galaxies with photometric redshifts 0.5< zphot<2.0. The lower redshift limit is applied to ensure that theV-band provides a rest-frame flux measure-ment bluewards of the 4000 Å/Balmer break. The slightly shallower depth of theBband in the UDS means that errors on determining the strength and shape of the 4000 Å/Balmer break increase sig-nificantly below this redshift. Similarly at high redshift, we find that we need a well determined flux measurement redwards of rest-frame∼1µm to accurately constrain the shape of the red end of the SED. Atz >2, the need for the Spitzer-IRAC channel 2 (4.5µm) measurements caused significantly larger errors on the determina-tion of the shape of the SEDs, and therefore on the estimadetermina-tion of the stellar populations of the galaxies.
The UDS field also contains∼3700 homogeneously observed spectra, taken as part of the UDSz project using a combination of the VIMOS and FORS2 instruments on the ESO VLT (ESO Large Programme 180.A-0776, PI: Almaini). This allows for good de-termination of photometric redshifts, as well as verification of the broad-band SED analysis methods used in this paper to determine
the stellar population content of the galaxies. 1,095 of the galaxies studied in this paper with 0.5< z <2.0 have good quality spectro-scopic redshifts from this programme, of which 207 are classified as quiescent or PSB according to their broad-band photometric SED shape (see next section).
2.1 Super-colour analysis
We follow the PCA method ofWA14to derive linear combinations of filters that describe the variation in galaxy SEDs using only a small number of components (eigenvectors). The eigenvectors are derived from a library of Bruzual & Charlot (2003, hereafter BC03) dust reddened spectral synthesis models, with ‘stochastic’ star formation histories (Kauffmann et al. 2003; Gallazzi et al. 2005). From these models broad-band fluxes are calculated for each of the survey filters, in small steps ofz=0.01 to cover the full redshift range of the data. A PCA of these supersampled SEDs is performed, which links together observed bands that vary together to compress the data into a small number of eigenvectors. We find that only three eigenvectors are required to account for>99.9 per cent of the variance in our library of model SEDs. The eigenvectors are weights, which are then used to sum the observed fluxes of a galaxy, in an optimal way to highlight the differences in shapes of galaxy SEDs. For each individual observed galaxy, only a small number of points in the weighting arrays are used, appropriate for the particular redshift of the galaxy. The sparseness of the observed data leads to larger, but well defined, errors on the resulting principal component amplitudes (Connolly & Szalay1999).
The amplitude of each of the eigenvectors within a galaxy’s SED (termed ‘super-colour’) is exactly equivalent to a traditional ‘colour’, in the sense that it is a linear combination of flux measured in different filters. However, by combining all the available photo-metric bands into this ‘super-colour’ in an optimal way through a weighting vector, the full information contained within the multi-wavelength surveys is retained. Equally, the observations are not forced to match spectral synthesis models, as is the case when SED fitting is used to estimate rest-frame colours. This freedom from the spectral synthesis models allows us to easily identify regions of SED space that are not well described by the models, and where physical parameters derived from model fitting will be biased.
The method does not solve for the redshift of the galaxy, but takes as input the redshift from a standard photometric redshift code (Simpson et al.2013). This was a practical decision taken because current photometric redshift codes are highly optimised for the task, and repeated effort seemed unnecessary. The effect of reasonable photometric redshift errors on the observed super-colours is negligible (see fig. 5 ofWA14). We have also verified, using the spectroscopic redshifts from the UDSz project and from Maltby et al. (2016), that there are no systematic biases caused by photometric redshift errors in each of the SED classes and redshift bins studied in this paper. The redshift errors of both the quiescent and PSB populations are low (σz/(1+z)=0.02) and are constant with both spectral type and redshift over the redshift range studied here.
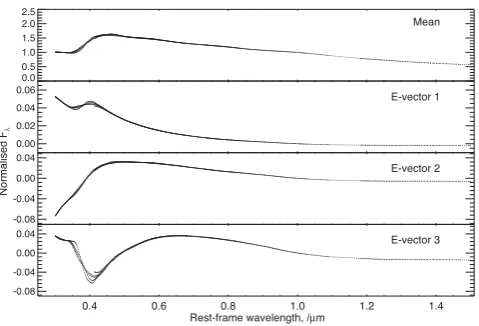
The full method is described in detail inWA14, the only change made in this paper is to extend the redshift range to 0.5< z <2.0. This change results in quantitatively different super-colour values, but no qualitative difference in results. The new eigenvectors are presented in Fig.1and can be seen to differ only slightly from those in fig. 2 ofWA14. Each point represents the weight given to one filter in our filter set, used to observe a galaxy at the given rest-frame wavelength. The multiple curves reflect the fact that different
at University of Nottingham on January 12, 2017
http://mnras.oxfordjournals.org/
Figure 1. The mean and first three eigenvectors from a PCA of a library of Bruzual & Charlot (2003) ‘stochastic burst’ model SEDs, convolved with broad-band filter functions to match the UDS survey observations for galaxies in the redshift range 0.5< z <2.0, in steps ofz=0.01. Each point represents the weight given to a particular filter for a galaxy at a particular redshift. The points are placed at the central rest-frame wavelength of the filter and they-axis indicates rest-frame flux. The multiple curves reflect the fact that different filters may probe the same rest-frame wavelength of galaxies at different redshifts. On addition to the mean, the first eigenvector primarily alters the red–blue slope of the SED, the second and third primarily alter the shape of the 4000 Å/Balmer break region.
filters (with correspondingly different transmission functions) will be used to observe the same rest-frame wavelength of galaxies at different redshifts. For the purposes of the analysis in this paper, the galaxies have been separated into three classes based on the shapes of their SEDs defined by the first three super-colours: quiescent, star-forming and PSB. Compared toWA14, this combines all the star-forming classes into a single class, and adds the candidate low-metallicity objects into the quiescent class.
2.2 Stellar masses and volume correction
Stellar mass-to-light ratios were calculated for each galaxy using a Bayesian analysis which accounts for the degeneracy between phys-ical parameters. Specifphys-ically, we fit a library of 10’s of thousands1 ofBC03population synthesis models with a wide range of star for-mation histories, two-component dust contents and metallicities to the first three super-colours, to obtain a probability density function (PDF) for each physical property. We extracted the median, 16th and 84th of the PDF to estimate the mass-to-light ratio and corre-sponding errors. The assumed model star formation histories are exponentially declining with superimposed random starbursts with priors as described in Kauffmann et al. (2003) and Gallazzi et al. (2005). Resulting stellar masses were increased by 10 per cent to allow for light lost from the 3 arcsec apertures used to extract the photometry.
Determining the exact stellar masses of galaxies is difficult, and differences between methods typically lead to 0.3 dex systematic uncertainties. We verified that all the results presented here are robust to different methods for obtaining stellar mass estimates by rerunning our analysis using masses from both Simpson et al. (2013) and Hartley et al. (2013). However, all of these analyses rely onBC03population synthesis models. For quiescent galaxies
1Between 23 000 and 62 000 depending on the redshift of the galaxy.
at high redshift, additional errors on stellar masses may arise from the less well-constrained contribution of TP-AGB stars to the NIR portion of the stellar continuum (Maraston et al. 2006; Conroy, Gunn & White2009). For our results, it is important that there are no systematic biases in masses between populations and with redshift. The former could arise because the contribution of TP-AGB stars changes as a function of stellar population age. Maraston et al. (2006) found that quiescent galaxies withBC03ages1 Gyr have younger ages, and therefore lower mass-to-light ratios, when fit with models with a significantly greater contribution from the TP-AGB phase. A systematic error on the stellar masses with redshift could also arise as different bands are used to probe the red end of the SED; in particular the use of the IRAC 3.6µm band for galaxies at
z >1.4 could lead to a bias, due to the lower spatial resolution of these observations. We will note the impact of these uncertainties on our results where relevant.
We also used the best-fitting (minimumχ2) population synthesis model, together with the SED normalization estimated during the super-colour analysis, to determine the fraction of the total survey volume in which a galaxy of that SED shape and absolute mag-nitude would be observed, given the observed frameK-band flux limit of the survey. Stellar mass functions were corrected for these volume effects using theVmaxmethod which weights each galaxy by 1/Vmax, whereVmaxis the maximum volume in which the galaxy may be observed in the survey (Schmidt1968). Mass completeness limits in each redshift slice and for each spectral type were deter-mined following the method of Pozzetti et al. (2010), allowing for a 90 per cent completeness factor.
3 R E S U LT S
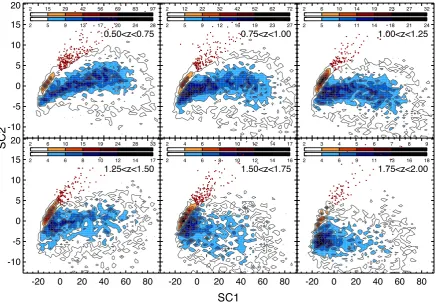
In Fig.2, we present the colour–colour distributions for the first two super-colours in six redshift intervals. Based on both comparison to spectral synthesis models, and spectroscopic confirmation, we showed in WA14how different types of galaxies lie in different regions of super-colour space. Galaxies which have undergone no significant recent star formation (quiescent galaxies) form a tight and well-defined ‘red sequence’ with low SC1. The star-forming population of galaxies covers a wide range of SC1, from the very bluest objects with SC1∼70 to a small number of galaxies that are redder than quiescent galaxies. As shown inWA14by stacking rest-frame optical spectra, the extremely red galaxies that fall below the red sequence in SC2 (which correlates with 4000 Å or Balmer break strength) are truly star-forming with stellar absorption lines and neb-ular emission lines consistent with a young stellar population. We showed inWA14that their red optical-to-NIR SEDs are consistent with high dust contents and metallicities, while their mean stellar ages are similar to ‘typical’ star-forming galaxies at that redshift. Note that these plots are based on aK-band limited sample and are not volume corrected, and therefore a different mass distribution of galaxies is visible at different redshifts. This is most obvious in the blue sequence, where we only see the most massive blue-sequence galaxies in the highest redshift bins. Their old ages, high metallic-ities and/or high dust contents make them appear towards the red end of the blue sequence.
According to our comparison to spectral synthesis models, and spectroscopic confirmation in bothWA14and Maltby et al. (2016), PSB galaxies form a well-defined stream entering the top of the red sequence, clearly separated above the blue sequence by their distinctive strong Balmer break (i.e. high SC2 values). The exact boundaries between the PSB and quiescent/star-forming galaxies are somewhat arbitrary; here we define them based on our ability
at University of Nottingham on January 12, 2017
http://mnras.oxfordjournals.org/
SC1
SC2
-10 -5 0 5 10 15
20 2 15 29 42 56 69 83 97
2 5 9 13 17 20 24 28
0.50<z<0.75
2 12 22 32 42 52 62 72
2 5 9 12 16 19 23 27
0.75<z<1.00
2 6 10 14 19 23 27 32
2 5 8 11 14 18 21 24
1.00<z<1.25
-20 0 20 40 60 80 -10
-5 0 5 10 15
20 2 6 10 15 19 24 28 33
2 4 6 8 10 12 14 17
1.25<z<1.50
-20 0 20 40 60 80
2 4 6 8 10 12 14 17
2 4 6 8 10 12 14 16
1.50<z<1.75
-20 0 20 40 60 80
2 3 4 5 6 7 8 9
2 4 6 9 11 13 16 18
[image:5.595.79.516.58.360.2]1.75<z<2.00
Figure 2. The distribution of the first two super-colours (SC) for galaxies observed in the UDS field, in six photometric-redshift intervals as indicated in the top right of each panel. The filled contours and colour bars at the top indicate the number of galaxies in bins ofSC1×SC2 of 2.5×0.5, individually for the quiescent and star-forming populations. Note that the plots (and associated numbers) are as observed and have not been volume corrected. The tight red sequence (red contours) can be observed to the left of SC1/2, with the blue cloud (blue contours) extending from low to high values of SC1. The PSB galaxies (filled brown circles) are seen as a well-defined stream entering the top end of the red sequence. The third super-colour (not shown here) has been used to exclude a small number of candidate low-metallicity quiescent galaxies, which can otherwise be interlopers in PSB samples.
to identify PSB galaxies from their strong Balmer absorption lines in moderate resolution rest-frame optical spectra (WA14). Varying the boundaries slightly does not have any significant impact on our results.
3.1 Decline in fraction and number density of quiescent, star-forming and PSB galaxies
In the left-hand panel of Fig.3we present the fraction of quiescent, star-forming and PSB galaxies as a function of redshift and stellar mass. We see the now familiar evolution in the bimodality in the galaxy population, with an increase in quiescent galaxy fraction with decreasing redshift at all stellar masses. This figure also shows how rare PSB galaxies are at all redshifts: the fraction of PSB galaxies declines from around 5 per cent of the total population in any given mass bin atz∼2, to 1 per cent byz∼0.5. It is important to remember that while the red fraction is cumulative, (i.e. galaxies are expected to move on to the red sequence and stay there, at least on average), the PSB phase is a transitory phase through which the galaxies move on time-scales of several hundred Myr to a Gyr. Therefore, the scarcity of PSB galaxies relative to quiescent and star-forming galaxies does not automatically imply that they are an unimportant phase of galaxy evolution.
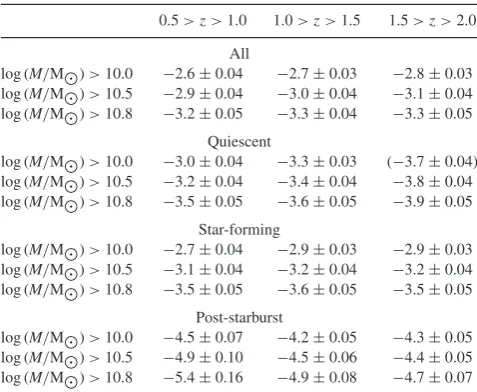
The right-hand panel of Fig. 3 shows the number density of all, quiescent, star-forming and PSB galaxies as a function of
red-shift with masses above different limits. The values are provided in Table1. Errors are calculated by combining the Poisson errors together with a contribution from cosmic variance, following the prescription of Moster et al. (2011). Errors caused by photometric errors leading to different photometric redshifts and super-colour classifications were found to be insignificant and are not included. We see the now familiar result, that the number density of quiescent galaxies grows with time, at all stellar masses, while the number density of the star-forming galaxies remains almost constant (e.g. Faber et al.2007; Ilbert et al.2013; Muzzin et al.2013). This in-crease in the number density of massive quiescent galaxies implies the transition of galaxies from the blue to the red sequence. On the other hand, the number density of galaxies observed in a PSB phase decreases with time, particularly in the higher mass limit bins, and at a redshift belowz1.
The number density of PSB galaxies identified spectroscopi-cally from the VVDS survey with 0.5< z <1.0 byWWJ09was log (φ/Mpc−3) = −4.0 for log (M/M
) >9.75, measured from 18 observed PSB galaxies. For comparison, we compute the num-ber density using the same mass limit and redshift range and find log (φ/Mpc−3)= −4.35, measured from 86 galaxies which is sig-nificantly lower assuming Poisson errors alone.2The fact that we
2In the z-COSMOS field Vergani et al. (2010) found a number density of log (φ/Mpc−3)= −4.3 for spectroscopically identified PSB galaxies,
at University of Nottingham on January 12, 2017
http://mnras.oxfordjournals.org/
Figure 3. Left: the volume corrected fraction of quiescent (red), star-forming (blue) and PSB (orange) galaxies as a function of redshift and stellar mass, as indicated by the key in the top left. Errors are propagated from the Poisson errors in each bin in the usual way. Right: the number density of all (black), quiescent (red), star-forming (blue) and PSB (orange) galaxies as a function of redshift and mass. The mass limits are given in the bottom right of the figure. Errors include contributions from Poisson errors and cosmic variance. The blue and red points have been offset slightly on thex-axis for clarity. Note that the high-redshift quiescent sample has a 90 per cent mass completeness limit of log (M/M)=10.2, and therefore is plotted as an open symbol.
Table 1. The comoving log number density (Mpc−3) for all, star-forming, quiescent and PSB galaxies in redshift and stellar mass bins. The 90 per cent completeness limits for each bin are given in Table2. Note that the high-redshift quiescent sample has a 90 per cent mass completeness limit of log (M/M)=10.2, and therefore the number density is given in brackets. Errors include both Poisson and cosmic variance contributions.
0.5> z >1.0 1.0> z >1.5 1.5> z >2.0 All
log (M/M)>10.0 −2.6±0.04 −2.7±0.03 −2.8±0.03 log (M/M)>10.5 −2.9±0.04 −3.0±0.04 −3.1±0.04 log (M/M)>10.8 −3.2±0.05 −3.3±0.04 −3.3±0.05
Quiescent
log (M/M)>10.0 −3.0±0.04 −3.3±0.03 (−3.7±0.04) log (M/M)>10.5 −3.2±0.04 −3.4±0.04 −3.8±0.04 log (M/M)>10.8 −3.5±0.05 −3.6±0.05 −3.9±0.05
Star-forming
log (M/M)>10.0 −2.7±0.04 −2.9±0.03 −2.9±0.03 log (M/M)>10.5 −3.1±0.04 −3.2±0.04 −3.2±0.04 log (M/M)>10.8 −3.5±0.05 −3.6±0.05 −3.5±0.05
Post-starburst
log (M/M)>10.0 −4.5±0.07 −4.2±0.05 −4.3±0.05 log (M/M)>10.5 −4.9±0.10 −4.5±0.06 −4.4±0.05 log (M/M)>10.8 −5.4±0.16 −4.9±0.08 −4.7±0.07
identify fewer PSB galaxies using the photometric selection is unsurprising as we expect photometric selection to be less sen-sitive to the PSB spectral features than spectroscopic observa-tions, i.e. the photometric method should detect the PSBs with the strongest features, which will be the youngest and/or those with the largest burst-to-old stellar mass ratio. The overall completeness of the super-colour method for detecting PSB galaxies compared to spectroscopic searches is difficult to ascertain without large, blind
using a similar redshift range toWWJ09but with a slightly higher mass cut log (M/M)>10 and different spectroscopic selection criteria. For this mass cut, we again find a number density that is a little lower than when using a spectroscopic selection at log (φ/Mpc−3)= −4.5.
spectroscopic surveys for comparison. However, it is estimated by Maltby et al. (2016) to be∼60 per cent, in good agreement with the difference in number densities found here. We note that this interpretation disagrees with the much lower number densities of PSB galaxies detected in the spectroscopic BOSS survey by Pat-tarakijwanich et al. (2014), where the luminosity function lies about 1 dex below ours as presented inWA14. Understanding the effect of photometric versus spectroscopic selection of PSB galaxies on the resulting star formation histories is a topic of ongoing investi-gation. The potential for significant differences should be kept in mind when comparing our results with those from current and future spectroscopic surveys.
3.2 Mass function evolution of quiescent, star-forming and PSB galaxies
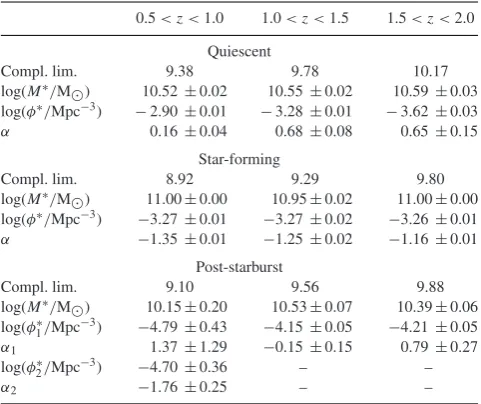
Further information on the evolution of the populations can be ob-tained from the galaxy stellar mass functions. In Fig.4we present the stellar mass functions of the star-forming, quiescent and PSB populations as a function of redshift (top and middle panels). In the lower panel, we compare the shape of the mass functions by normal-izing them at log (M/M)=10.5. Errors include both Poisson and cosmic variance contributions. We fit single Schechter functions (Schechter1976) to all mass functions, apart from the lowest red-shift PSB bin, for which the upturn at lower stellar masses required a double Schechter function (Pozzetti et al.2010). The results are given in Table2and all the trends noted below are robust to binning. No allowance is made for Eddington bias which can scatter galaxies into the massive end of the mass function, as our results do not re-quire accurate number densities for the highest mass objects. Caputi et al. (2011) suggest that by not accounting for Eddington bias the number densities of the highest mass galaxies [log (M/M)>11] will be overestimated by 0.13 dex. If there were a significantly greater contribution from the TP-AGB phase of stellar evolution to the SEDs of our galaxies (Section 2.2), this would act to move the quiescent mass functions to lower masses, relative to the other spec-tral classes. In our highest redshift bin, the masses rely significantly on the IRAC 3.6µm band which has larger uncertainties than the other bands. Using smaller redshift bin sizes, we confirmed that our
at University of Nottingham on January 12, 2017
http://mnras.oxfordjournals.org/
[image:6.595.46.285.373.569.2]Figure 4. Top and centre: the stellar mass functions of quiescent, star-forming and PSB galaxies as a function of redshift. In the central panel, the overplotted dotted lines are the Schechter function fits. Bottom: the mass functions have been normalized at log (M/M)=10.5 in order to better compare their shape. Errors include both Poisson and cosmic variance contributions.
mass functions do not show any significant change in shape as this band is introduced.
The quiescent and star-forming stellar mass functions show the now familiar build-up in the number density of quiescent galax-ies, particularly at intermediate and low masses, but little change
in the number density of star-forming galaxies at any mass. The star-forming stellar mass function has a relatively constant charac-teristic mass (M∗), number density (φ∗) and faint-end slope param-eter (α), that are consistent with previous measurements (Muzzin et al.2013). The quiescent galaxy stellar mass function turns over at
at University of Nottingham on January 12, 2017
http://mnras.oxfordjournals.org/
Table 2. The Schechter function parameters fitted to the quiescent, star-forming and PSB populations. The first line in each section gives the 90 per cent mass completeness limits in each bin, in log (M/M). Only for the lowest redshift bin of the PSB population was it necessary to fit a double Schechter function.
0.5< z <1.0 1.0< z <1.5 1.5< z <2.0 Quiescent
Compl. lim. 9.38 9.78 10.17
log(M∗/M) 10.52±0.02 10.55±0.02 10.59±0.03 log(φ∗/Mpc−3) −2.90±0.01 −3.28±0.01 −3.62±0.03
α 0.16±0.04 0.68±0.08 0.65±0.15 Star-forming
Compl. lim. 8.92 9.29 9.80
log(M∗/M) 11.00±0.00 10.95±0.02 11.00±0.00 log(φ∗/Mpc−3) −3.27±0.01 −3.27±0.02 −3.26±0.01
α −1.35±0.01 −1.25±0.02 −1.16±0.01 Post-starburst
Compl. lim. 9.10 9.56 9.88
log(M∗/M) 10.15±0.20 10.53±0.07 10.39±0.06 log(φ∗1/Mpc−3) −4.79±0.43 −4.15±0.05 −4.21±0.05 α1 1.37±1.29 −0.15±0.15 0.79±0.27 log(φ∗2/Mpc−3) −4.70±0.36 – –
α2 −1.76±0.25 – –
intermediate masses, resulting in a positive value for the faint-end slope parameter. While the number density of quiescent galaxies increases with cosmic time, the faint-end slope flattens. Unfortu-nately, the measured value ofαfor the quiescent galaxies varies significantly between surveys and analysis methods, making it dif-ficult to make direct comparisons. However, the general picture of a flattening with time is robust, with a tentative upturn appearing at lower stellar masses (Drory et al.2009; Muzzin et al.2013; Tomczak et al.2014).
Interestingly, the shape of the PSB mass function is similar to that of quiescent galaxies at high redshift, but the low-mass end builds up rapidly with cosmic time, leading the mass function to be more similar to that of the star-forming galaxies atz1. This trend clearly continues to lower redshift, as seen in the luminosity function of local PSB galaxies (Quintero et al.2004; Pattarakijwanich et al. 2014). The turnover in the mass functions atz >1 suggests that the PSB phenomenon is reserved for high-mass galaxies alone at these redshifts, whereas atz <1 there is a complete reversal with PSB spectral features predominantly being found in low-mass galaxies. As we will discuss in the following section, the changing shape of the mass function with redshift suggests there may be two different evolutionary pathways to form PSB galaxies.
4 D I S C U S S I O N
[image:8.595.46.287.112.314.2]There are many physical processes that have been proposed to play a role in the evolution of the demographics of the galaxy popula-tion over cosmic time. Both ‘fast’ (∼108yr) and ‘slow’ (109yr) quenching routes may exist to convert star-forming galaxies into quiescent galaxies, and thus build the bimodality in galaxy popula-tions observed in the present-day Universe. For the ‘fast’ quenching route, both ‘starburst’ and ‘switch-off’ modes may play a role, with the former implying that a significant fraction of stars are formed in a starburst that is subsequently truncated along with star formation in the whole of the galaxy, and the latter implying that no starburst occurs and the galaxy’s star formation is simply rapidly truncated.
Figure 5. As the PSB galaxies are expected to enter the red sequence on time-scales shorter than the difference in cosmic time between our redshift bins, we can combine the PSB and quiescent mass functions in a given red-shift bin to predict the quiescent mass function in the next lowest redred-shift bin. Red lines: the stellar mass functions of quiescent galaxies in our lowest two redshift bins. Orange lines: the stellar mass functions of quiescent galaxies predicted from adding the stellar mass function of quiescent galaxies in the next highest redshift bin to the mass function of PSB galaxies in that redshift bin, multiplied by a factor which is fitted for. This factor can be translated directly into a minimum PSB visibility time-scale, given in the title of each panel, after allowing for the difference in cosmic time between the redshift bins.
It is certainly possible, if not likely, that the balance of all of these mechanisms varies with cosmic time.
In this paper we focus on the ‘fast-quenching’ pathway, as this is the route that our detection method is sensitive to. The A/F-star features that allow us to identify the quenched galaxies are only visible if there is a significant deficit in O/B stars, which requires quenching time-scales significantly shorter than the main-sequence lifetime of A/F stars. We begin this discussion by asking whether our results are consistent with all quiescent galaxies atz > 0.5 forming following a fast-quenching episode. We then compare with spectral synthesis models to further investigate the likely star for-mation histories of the PSB class of galaxies. Based on the stellar mass functions of the PSB galaxies, we propose that two different formation mechanisms dominate at high and low redshift. Finally, we discuss more speculatively whether high-redshift PSB galaxies could be the descendants of sub-mm galaxies.
4.1 The contribution of PSBs to the build-up of the red sequence at log (M/M)>10 andz<2
Based on our understanding of the time-scale during which A/F star features are visible following a rapid truncation in star forma-tion, PSB galaxies are expected to join the quiescent population within∼1 Gyr, which is similar to the time between our three red-shift bins. Therefore, we can add the PSB mass function to the quiescent mass function in the same redshift bin, fitting for a con-stant multiplicative factor that accounts for the difference in cosmic time between the bins and the visibility time-scale of the PSB fea-tures, and compare the resulting mass function with the subsequent redshift bin. This allows us to (1) constrain the minimum visibil-ity time-scale for the spectral features, and (2) investigate whether the mass function of any remaining ‘slow-quenched’ population can be different to the PSB mass function. The result is shown in Fig.5. If 100 per cent of the growth of the quiescent population
at University of Nottingham on January 12, 2017
http://mnras.oxfordjournals.org/
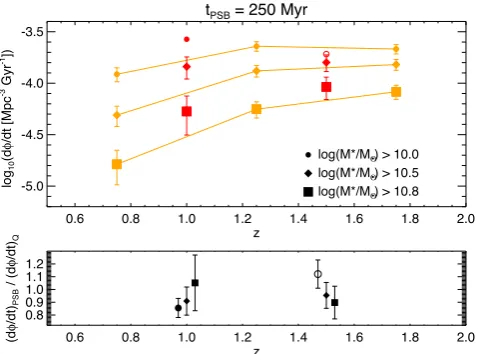
Figure 6. Top: the number growth rate of quiescent galaxies (red) for the mass limits as given in the key, measured from the gradient in their number density evolution. This is compared to the rate at which galaxies pass through a PSB phase (orange), assuming that this phase is observable for 250 Myr (see text). Errors include contributions from both Poisson errors and cosmic variance. Bottom: the fraction of the number growth of quiescent galaxies that could be contributed by galaxies passing through a PSB phase. Poisson errors only are propagated in the standard way. The different measurements are artificially offset from one another on thex-axis for clarity.
arises following a detectable PSB phase, we find that the PSB fea-tures are visible for∼250 Myr. This is entirely consistent with the minimum time-scale derived byWWJ09through comparison to hy-drodynamic simulations of major gas-rich galaxy mergers. Clearly, the shapes of the predicted mass functions in both redshift bins are also in very good agreement with the actual quiescent galaxy mass functions, which is required if 100 per cent of the growth of the quiescent population does indeed arise following rapid truncation of the star formation.
Our results show that any additional ‘slow-quenching’ mecha-nism that exists and contributes significantly to the mass growth of the quiescent population with log (M/M)>10 atz >0.5, must have the same efficiency as a function of mass as the fast-quenching mechanism, in order to ensure that the final quiescent mass function matches that observed. If the ‘slow-quenching’ route contributes significantly to the build-up of the quiescent population, the differ-ing shapes of the star-formdiffer-ing and quiescent mass functions imply that star-forming galaxies must use up their gas supplies and halt their star formation at a rate that is dependent on their stellar mass atz >1, to avoid an excessive build-up of the low-mass end of the quiescent mass function.
The same result can be depicted slightly differently, by using the gradient in the number density evolution of the quiescent galaxies (Fig.3), to calculate the rate at which new galaxies enter the red sequence (dφ/dt). This is shown in the top panel of Fig.6(red symbols) for three different mass cuts, and is compared to the rate at which galaxies are passing through a PSB phase (orange symbols), assuming a visibility time-scale of 250 Myr as estimated above.
We find that a few times 10−4 galaxies per Mpc3 with log (M/M) >10 enter the red sequence every Gyr, although the precise number depends on stellar mass and redshift. For log (M/M) >10.8, the rate at which galaxies are entering the red sequence is decreasing with cosmic time from 9.2 to 5.3×10⁻⁵ galaxies per Mpc3 per Gyr between z ∼ 1.5 and z ∼ 1. For
log (M/M)>10, the rate at which galaxies are entering the red sequence appears to be increasing slightly with cosmic time, from 1.9 to 2.6×10⁻⁴galaxies per Mpc3per Gyr. It is possible that this evolution is consistent with being flat, however, given the slightly higher incompleteness in our highest redshift, lowest mass bin. This mass trend is one manifestation of the downsizing observed in the galaxy population (see Fontanot et al.2009, for a review of the literature), with higher mass quiescent galaxies being formed pre-dominantly at higher redshifts, while galaxies continue to enter the low-mass end of the quiescent population to the present day.
In the bottom panel of Fig. 6, we divide the number growth rate (dφ/dt) for the PSB galaxies (using a linear interpolation be-tween the observed points), by dφ/dtfor the quiescent galaxies. By construction, this fraction has a typical value of around unity, as we have set the visibility time-scale based on the assumption that 100 per cent of the new quiescent galaxies have formed following a PSB phase. We can now see clearly that this fraction appears to be relatively constant with redshift. While it is tempting to observe that the contribution of the PSB galaxies appears to increase with decreasing redshift for the highest mass galaxies, but decrease for lower mass galaxies, any trend is not significant within the errors.
We note that, in this discussion, we have neglected the impact of dry mergers which could move galaxies that are already quiescent into higher mass bins and therefore contribute to the apparent growth rate in a single mass bin. Should the stellar masses of our quiescent galaxies be slightly overestimated due to an underestimation of the contribution of the TP-AGB phase, the PSB contribution at a given stellar mass would be even higher, leading to a shorter estimate for the visibility window. As this is unlikely, given our knowledge of the PSB evolutionary phase (and see next section), we conclude that it is likely that there is no significant bias in our quiescent galaxy masses.
4.2 ‘Switch-off’ versus ‘starburst’ mechanisms
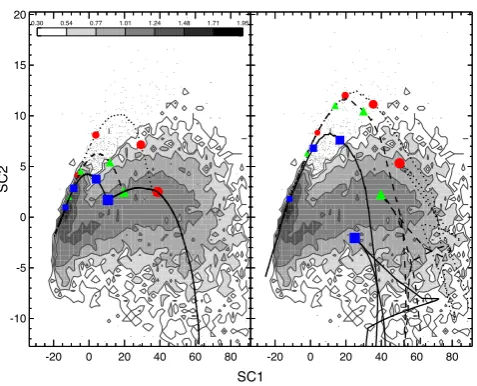
We now return to the question of ‘switch-off’ versus ‘starburst’ as two mechanisms for the rapid quenching of star formation in galaxies. In Fig.7, we show a grey-scale of the first two super-colours of the observed UDS galaxies for our lowest redshift bin (0.5< zphot<1.0), and overplotted evolutionary tracks fromBC03 spectral synthesis models. In the left-hand panel, the three tracks show the evolution in colour of a solar metallicity stellar population with a continuous star formation rate, truncated after 1 Gyr (dotted line), 3 Gyr (dashed line) and 6 Gyr (full line). The star formation is truncated exponentially, over a time-scale of 50 Myr. The models are attenuated by a moderate amount of dust, withAV=1 using a two-component dust attenuation law (Wild et al.2007; da Cunha, Charlot & Elbaz2008), although this does not significantly impact their position in SC space during the PSB or quiescent phase. Symbols mark the point of truncation and then 0.1, 0.5 and 1 Gyr following truncation. We can see that continuous star formation histories that are truncated before 6 Gyr enter the region of super-colour space that we have defined to be PSB, although cannot explain the most extreme objects. While one could argue that a 1 Gyr truncated population was indeed a ‘PSB’ galaxy, with a rather extended burst period, this terminology becomes less obvious for the longer time-scales. These more extended star formation histories enter the ‘PSB’ region of super-colour space for anywhere between a hundred Myr and nearly a Gyr.
In the right-hand panel of Fig.7we present models which have undergone 1 Gyr of continuous star formation, followed by a star-burst that accounts for 50 per cent of the total stellar mass of the
at University of Nottingham on January 12, 2017
http://mnras.oxfordjournals.org/
Figure 7. The distribution of the first two super-colours (SC) for galaxies with 0.5< zphot<1.0 observed in the UDS field, using a log10Ngrey-scale with bin sizes ofSC1=2.5 andSC2=0.5. The PSB population are shown as dots. Overplotted in black are the evolutionary tracks of composite solar metallicity stellar population models with a dust attenuation ofAV=1. Left: solar metallicity models with continuous star formation truncated after 1 Gyr (dotted, red circles), 3 Gyr (dashed, green triangles) and 6 Gyr (full, blue squares). The star formation is truncated exponentially, over a time-scale of 50 Myr. Symbols mark time of truncation, then 0.1, 0.5 and 1 Gyr following truncation, with decreasing symbol size. Right: with a constant star formation rate for 1 Gyr, followed by a burst of star formation that accounts for 50 per cent of the total mass of the galaxy. The starburst is an exponential with a decay time of 50 Myr. The three tracks are for models with metallicities of 0.25Z,Zand 2.5Z. Symbols mark the time of the starburst, then 0.3, 0.5 and 1 Gyr after the starburst, with decreasing symbol size.
galaxy. Similar to the previous case, the starburst decays over a time-scale of 50 Myr, although extending this to 100 Myr makes little difference to the evolutionary tracks. Models with three metal-licities are plotted: 0.25Z,Zand 2.5Z. Symbols mark the start of the starburst and then 0.3, 0.5 and 1 Gyr following the starburst. While it is possible to explain the colours of the majority of the PSB galaxies with solar metallicity, truncation or moderate burst models, the PSB galaxies with the most extreme colours in our samples may have lower metallicities and very substantial burst mass fractions. These extreme objects must have a visibility time-scale closer to 1 Gyr, i.e. longer than the∼250 Myr derived above. If a significant fraction of the PSB galaxies have such a long visibility window, this allows for some growth of the quiescent population to take place via a slower quenching route, that would not be visible to our study.
In reality, the population may have a mixed origin, with some fraction caused by truncation or weak starbursts, and others caused by more extreme events. We tested whether the PSB mass functions varied with strength of SC2, by splitting the samples into two at SC2=7, finding that they did not. Therefore, if a substantial fraction of the galaxies that lie close to the red sequence are galaxies that have simply truncated their star formation, or undergone only a weak starburst, the process that causes this must have an equal efficiency as a function of mass as processes which cause much stronger starbursts.
Ultimately, the strength of the PSB features depends on several factors: the ratio of old (non-burst) to burst stellar mass in the galaxy;
the star formation history of the non-burst mass; the rate of decline of the burst. These factors may be difficult to disentangle for any one galaxy but could perhaps be constrained in the future through detailed analysis of the optical spectra and SEDs, and through pop-ulation studies.
4.3 Two formation mechanisms forz>0.5 PSB galaxies
It is clear that the mass function of transitioning galaxies should match in shape those of recently quenched red-sequence galaxies (Peng et al.2010). At high redshift we have the advantage of the short amount of cosmic time that has passed, meaning that all red-sequence galaxies are recently quenched galaxies. It is therefore very interesting to note that atz1.5, the shape of the PSB mass function is similar to that of the quiescent galaxy mass function (Fig.4). Splitting the sample into smaller redshift bins confirms the trend that byz∼2 the shapes of the quiescent and PSB mass functions are almost indistinguishable. Quantitatively, the number density of the PSB galaxies is a factor of 4 lower than the quiescent galaxies at these redshifts. On the other hand, the age of the Universe is∼4 Gyr, which is a factor of 4 larger than the maximum likely visibility time-scale of the PSB galaxies. This is again consistent withallquiescent galaxies already in place byz∼2 having had their star formation truncated rapidly. The difference between the shape of the star-forming and PSB mass functions at high redshift also tells us that PSB galaxies are not a randomly drawn sample from the star-forming population. A hidden factor related to stellar mass must dictate whether a galaxy can be quenched quickly enough to be detected as a PSB galaxy.
At z 1, the mass function of the PSB population becomes increasingly similar to the mass function of the star-forming popu-lation (lower panel of Fig.4). The strength of the spectral features required in order to detect PSB galaxies requires a significant prior specific star formation rate. Therefore, it makes sense that the mass function of the PSB galaxies closely resembles that of the ‘pro-genitor’ population of gas-rich star-forming galaxies, but this also implies that the dominant mechanism that is responsible for ‘fast-quenching’ is independent of stellar mass at 0.5< z <1.
Our quiescent mass function does not show such a strong flatten-ing with decreasflatten-ing redshift as seen in previous work. However, as we note in Section 3.2, if we combine both the PSB and quiescent mass functions as would happen if we were using a traditionalUVJ
or NUV-r-Jcolour selection, the low-mass ends of our intermediate and low-redshift quiescent galaxy mass functions do become flatter. Peng et al. (2010) predict that the flattening and associated low-mass upturn is due to galaxies which have been quenched due to their environment; our results provide a rather tighter constraint as the flattening appears to originate at least partly and possibly wholly fromrapidlyquenched galaxies. This could rule out some cluster-specific processes such as harassment and strangulation as these may happen too slowly to provide the strength of features needed for the galaxies to be identified as PSBs. Our results are consistent with the idea that pre-processing in group environments, where the velocity dispersions are low enough for galaxy mergers to occur, is key to building the low-mass end of the red sequence atz <1. These ideas are explored further by studying the environments of the PSB galaxies in Socolovsky et al. (in preparation).
To summarize, our results imply a two-phase mechanism for the rapid quenching of galaxies atz >0.5. At high redshifts (z >2), quiescent galaxies form rapidly from the dissipational collapse of gas clouds, or rapid merging of many smaller protogalaxies, resulting in intense star formation for a short period of time, and
at University of Nottingham on January 12, 2017
http://mnras.oxfordjournals.org/
a single quenching episode. The fact that PSB galaxies are not randomly selected from the star-forming galaxy mass function im-plies that a preferred mass scale exists, either for the formation or the quenching mechanism (i.e. ‘mass-quenching’). At low redshift (z <1), a significant fraction of quiescent galaxies are quenched rapidly, at all masses, from the star-forming population. Further studies of the environment and clustering of the PSB galaxies (So-colovsky et al. in preparation; Wilkinson et al. in preparation) will study whether these processes are consistent with ‘environment-quenching’ (Peng et al.2010).
4.4 The progenitors of PSB galaxies: Sub-mm galaxies?
In order to detect the strongest PSB features in broad-band SEDs, it is necessary for the galaxies to have undergone a recent enhanced period of star formation of relatively short duration. Their progeni-tors should easily be visible in our high-redshift fields. Observation-ally it is difficult to distinguish a galaxy with a constant high SFR, from one undergoing a burst that is about to rapidly decline as it depletes its cold gas supply. One rare type of galaxy which may be undergoing an intense but unsustainable starburst are the sub-mm detected galaxies, which have number densities of∼10−5Mpc−3 at 1< z <2.5 (Swinbank et al.2014). Stellar masses are difficult to estimate, due to the significant dust attenuation, Simpson et al. (2014) suggest typical stellar masses of log (M/M)∼10.9 for a Salpeter IMF, equivalent to log (M/M) ∼10.6 for the Chabrier IMF assumed in this paper. Assuming a 100 Myr time-scale for the star formation activity of sub-mm galaxies Simpson et al. (2014) estimated that their space density atz∼0 would be consistent with local elliptical galaxies of the same NIR luminosity distribution (see also Dunlop2001). A more recent study of the clustering of a much larger sample of sub-mm galaxies in the Scuba-2 Cosmol-ogy Legacy Survey by Wilkinson et al. (submitted), confirms that the highest redshift (z >2.5) sources are consistent with being the progenitors of local massive elliptical galaxies in clusters. How-ever, sub-mm galaxies at 1< z < 2 are less strongly clustered, and inconsistent with being the progenitors of the massive elliptical galaxies in the local Universe. Smail et al. (2014) also find that sub-mm galaxies associated with a cluster atz=1.62 are prefer-entially located in the outskirts of the cluster, and will form less massive ellipticals than those galaxies that are already quiescent by this redshift.
With a very similar characteristic stellar mass of log (M/M) ∼ 10.4–10.5, a space density 6–7 times higher at ∼6–7 ×10⁻⁵ Mpc−3 but an observable time-scale up to an order of magnitude longer, the coincidence between the number densities of the PSB galaxies at z > 1 and sub-mm galaxies is suggestive. While it is difficult to determine the star formation history of the sub-mm galaxies due to the dominant contribution of the young, high-mass stars to the SED (Simpson et al.2014), and significant dust attenuation, tighter constraints can be obtained for the PSB galaxies where the youngest stars have exploded as supernova and thus no longer dominate the SED. Although the errors in the comparison are large, the coincidence also supports the modelling presented in Fig.7, which shows that the extreme colours of a fraction of the PSB galaxies can only be explained if they have undergone an intense and unsustained episode of star formation, shortly prior to their detection. Strengthening the connection between PSB and sub-mm galaxies may therefore help constrain the physical properties of both populations of galaxies in the future.
5 S U M M A RY
We have extended the method presented inWA14to investigate the number density and mass functions of PSB galaxies in the UDS, and how they relate to the increase in number density of quiescent galaxies with log (M/M)>10 at 0.5< z <2. Our main results can be summarized as follows.
(i) The shape of the mass function of PSB galaxies resembles that of quiescent galaxies atz∼ 2, but byz∼0.5 more closely resembles that of star-forming galaxies.
(ii) The evolution in shape of the mass function of the PSB ies implies a two-phase mechanism for the rapid quenching of galax-ies atz >0.5: (1) rapid dissipational collapse at high redshift, which occurs exclusively in the high-mass galaxy population; and (2) rapid quenching of star-forming galaxies at low redshift, independent of stellar mass.
(iii) By adding the mass function of the PSB galaxies to that of the quiescent galaxies in the intermediate and high-redshift bins, we are able to reproduce exactly the shape of the quiescent mass function in the subsequent (low and intermediate) redshift bins. This shows that 100 per cent of the growth in the quiescent population at 0.5< z <2 could have arisen following a PSB phase. If this is the case, then PSB features must typically be visible for a relatively short time of∼250 Myr.
(iv) This consistency of true and predicted mass functions shows that the flattening in the low-mass end of the quiescent galaxy mass function observed in previous work is consistent with originating entirely fromrapidlyquenched galaxies.
(v) Equivalently, by comparing the rate of increase in the number density of quiescent galaxies with cosmic time to the occurrence of PSB galaxies, we show that there is no preferred stellar mass or redshift at which the PSB galaxies contribute to the growth of the red sequence. However, larger surveys are needed to fully explore these relations.
(vi) Comparison with spectral synthesis models show that the super-colour criteria are effective for isolating recently quenched galaxies which have formed a significant fraction of their mass within the last∼Gyr, and this may include galaxies which have ‘switched-of” star formation, as well as genuine ‘PSB’ galaxies.
(vii) The galaxies with the most extreme colours must have formed a significant fraction of their stellar mass in a short-lived starburst, and may have metallicities below solar. These most ex-treme PSB galaxies must be visible for longer than the 250 Myr estimated via number density arguments, which would leave some space for slower quenching mechanisms to contribute to the build-up of the quiescent population.
(viii) The consistency of the PSB mass functions close to, and further away from the quiescent population suggests that there can be no difference between the mass efficiency of the physical mech-anisms that cause ‘switch-off’ versus true ‘PSB’ galaxies. Further analysis of the spectra and SEDs, as well as population studies, may help to distinguish between the two scenarios.
(ix) If the PSB spectral features are visible for significantly longer than 250 Myr, or the galaxies rejuvenate their star formation and return to the blue sequence following their period of rapid quench-ing, this allows for an additional ‘slow-quenching’ mechanism to contribute to the build-up of the quiescent population. Our results show that the mass efficiency of this mechanism must be similar to that of the ‘fast-quenching’ mechanism, in order to reproduce the mass function of the quenched galaxies at later times.
(x) The stellar masses and number densities of PSB galaxies are consistent with them being the descendants of sub-mm galaxies,
at University of Nottingham on January 12, 2017
http://mnras.oxfordjournals.org/
although the errors on this comparison are large. Strengthening the connection between these two populations may help to better constrain the physical properties of both.
Further work on this very interesting class of recently quenched high-redshift galaxies is ongoing. However, their transitory nature means that ultimately larger area and deeper surveys will be needed to fully quantify the role of different mechanisms in the origin of galaxy bimodality and build-up of the red sequence.
AC K N OW L E D G E M E N T S
UKIDSS uses the UKIRT Wide Field Camera (WFCAM; Casali et al.2007). The photometric system is described in Hewett et al. (2006), the calibration is described in Hodgkin et al. (2009) and the science archive is described in Hambly et al. (2008). We are indebted to the staff at UKIRT for their tireless efforts in the face of very difficult circumstances.
We would like to thank the referee of the paper for the construc-tive and helpful comments. VW and KR acknowledge support of the European Research Council via the award of a starting grant (SEDMorph; P.I. V. Wild). JSD acknowledges support from the Eu-ropean Research Council via the award of an advanced grant (P.I. J. Dunlop). RJM acknowledges the support of the European Research Council via the award of a consolidator grant (P.I. R. McLure) JSD also acknowledges the contribution of the EC FP7 SPACE project ASTRODEEP (Ref. No: 312725).
R E F E R E N C E S
Almaini O. et al., 2016, MNRAS, in press
Athanassoula E., Rodionov S. A., Peschken N., Lambert J. C., 2016, ApJ, 821, 90
Barro G. et al., 2014, ApJ, 791, 52 Bell E. F. et al., 2004, ApJ, 608, 752 Bell E. F. et al., 2012, ApJ, 753, 167
Best P. N., Kaiser C. R., Heckman T. M., Kauffmann G., 2006, MNRAS, 368, L67
Blake C. et al., 2004, MNRAS, 355, 713
Bower R. G., Benson A. J., Malbon R., Helly J. C., Frenk C. S., Baugh C. M., Cole S., Lacey C. G., 2006, MNRAS, 370, 645
Brennan R. et al., 2015, MNRAS, 451, 2933 Bruce V. A. et al., 2012, MNRAS, 427, 1666 Bruce V. A. et al., 2014, MNRAS, 444, 1001
Bruzual G., Charlot S., 2003, MNRAS, 344, 1000 (BC03)
Buitrago F., Trujillo I., Conselice C. J., H¨außler B., 2013, MNRAS, 428, 1460
Caputi K. I., Cirasuolo M., Dunlop J. S., McLure R. J., Farrah D., Almaini O., 2011, MNRAS, 413, 162
Casali M. et al., 2007, A&A, 467, 777
Ceverino D., Dekel A., Tweed D., Primack J., 2015, MNRAS, 447, 3291 Chabrier G., 2003, PASP, 115, 763
Choi J., Conroy C., Moustakas J., Graves G. J., Holden B. P., Brodwin M., Brown M. J. I., van Dokkum P. G., 2014, ApJ, 792, 95
Connolly A. J., Szalay A. S., 1999, AJ, 117, 2052 Conroy C., Gunn J. E., White M., 2009, ApJ, 699, 486
Cox T. J., Dutta S. N., Di Matteo T., Hernquist L., Hopkins P. F., Robertson B., Springel V., 2006, ApJ, 650, 791
Croton D. J. et al., 2006, MNRAS, 365, 11
da Cunha E., Charlot S., Elbaz D., 2008, MNRAS, 388, 1595 Daddi E. et al., 2005, ApJ, 626, 680
Damjanov I. et al., 2009, ApJ, 695, 101 Dekel A., Birnboim Y., 2006, MNRAS, 368, 2 Dekel A., Burkert A., 2014, MNRAS, 438, 1870
Di Matteo T., Springel V., Hernquist L., 2005, Nature, 433, 604
Drory N. et al., 2009, ApJ, 707, 1595
Dunlop J. S., 2001, DEEP MILLIMETER SURVEYS: Implications for Galaxy Formation and Evolution. World Scientific Press, Singapore, p. 11
Faber S. M. et al, 2007, ApJ, 665, 265 Finoguenov A. et al., 2010, MNRAS, 403, 2063
Fontanot F., Lucia G. D., Monaco P., Somerville R. S., Santini P., 2009, MNRAS, 397, 1776
French K. D., Yang Y., Zabludoff A., Narayanan D., Shirley Y., Walter F., Smith J.-D., Tremonti C. A., 2015, ApJ, 801, 1
Furusawa H. et al., 2008, ApJS, 176, 1
Gabor J. M., Dav´e R., Finlator K., Oppenheimer B. D., 2010, MNRAS, 407, 749
Gallazzi A., Charlot S., Brinchmann J., White S. D. M., Tremonti C. A., 2005, MNRAS, 362, 41
Goto T., 2005, MNRAS, 357, 937
Governato F. et al., 2009, MNRAS, 398, 312 Hambly N. C. et al., 2008, MNRAS, 384, 637 Hartley W. G. et al., 2013, MNRAS, 431, 3045
Hewett P. C., Warren S. J., Leggett S. K., Hodgkin S. T., 2006, MNRAS, 367, 454
Hodgkin S. T., Irwin M. J., Hewett P. C., Warren S. J., 2009, MNRAS, 394, 675
Hopkins P. F., Cox T. J., Younger J. D., Hernquist L., 2009a, ApJ, 691, 1168 Hopkins P. F., Hernquist L., Cox T. J., Keres D., Wuyts S., 2009b, ApJ, 691,
1424
Ilbert O. et al., 2013, A&A, 556, 55 Kauffmann G. et al., 2003, MNRAS, 341, 33 Lang P. et al., 2014, ApJ, 788, 11
Lawrence A. et al., 2007, MNRAS, 379, 1599
Madau P., Dickinson M., 2014, Ann. Rev. Astron. Astrophys., 52, 415 Maltby D. T. et al., 2016, MNRAS, 459L, 114
Maraston C., Daddi E., Renzini A., Cimatti A., Dickinson M., Papovich C., Pasquali A., Pirzkal N., 2006, ApJ, 652, 85
Moster B. P., Somerville R. S., Newman J. A., Rix H.-W., 2011, ApJ, 731, 113
Moustakas J. et al., 2013, ApJ, 767, 50 Moutard T. et al., 2016, A&A, 590, A103
Muratov A. L., Kereˇs D., Faucher-Gigu`ere C.-A., Hopkins P. F., Quataert E., Murray N., 2015, MNRAS, 454, 2691
Muzzin A. et al., 2013, ApJ, 777, 18
Naab T., Jesseit R., Burkert A., 2006, MNRAS, 372, 839 Naab T. et al., 2014, MNRAS, 444, 3357
Nelson E. et al., 2014, Nature, 513, 394 Oke J. B., Gunn J. E., 1983, ApJ, 266, 713
Ownsworth J. R., Conselice C. J., Mundy C. J., Mortlock A., Hartley W. G., Duncan K., Almaini O., 2016, MNRAS, 461, 1112
Pattarakijwanich P., Strauss M. A., Ho S., Ross N. P., 2014, ApJ, preprint (arXiv:1410.7394)
Pawlik M. M., Wild V., Walcher C. J., Johansson P. H., Villforth C., Row-lands K., Mendez-Abreu J., Hewlett T., 2016, MNRAS, 456, 3032 Peng Y.-J. et al., 2010, ApJ, 721, 193
Pozzetti L. et al., 2010, A&A, 523, A13 Quintero A. D. et al., 2004, ApJ, 602, 190
Rowlands K., Wild V., Nesvadba N., Sibthorpe B., Mortier A., Lehnert M., da Cunha E., 2015, MNRAS, 448, 258
Schechter P., 1976, ApJ, 203, 297 Schmidt M., 1968, ApJ, 151, 393 Silk J., Rees M. J., 1998, A&A, 331, L1 Simpson C. et al., 2012, MNRAS, 421, 3060
Simpson C., Westoby P., Arumugam V., Ivison R., Hartley W., Almaini O., 2013, MNRAS, 433, 2647
Simpson J. M. et al., 2014, ApJ, 788, 125 Smail I. et al., 2014, ApJ, 782, 19
Snyder G. F., Cox T. J., Hayward C. C., Hernquist L., Jonsson P., 2011, ApJ, 741, 77
Straatman C. M. S. et al., 2014, ApJ, 783, L14 Swinbank A. M. et al., 2014, MNRAS, 438, 1267
at University of Nottingham on January 12, 2017
http://mnras.oxfordjournals.org/
Tomczak A. R. et al., 2014, ApJ, 783, 85 Toomre A., Toomre J., 1972, ApJ, 178, 623 van Breukelen C. et al., 2006, MNRAS, 373, L26 van der Wel A. et al., 2014, ApJ, 788, 28 van Dokkum P. G. et al., 2015, ApJ, 813, 23 Vergani D. et al., 2010, A&A, 509, A42
Whitaker K. E., Kriek M., van Dokkum P. G., Bezanson R., Brammer G., Franx M., Labb´e I., 2012, ApJ, 745, 179
Wild V., Kauffmann G., Heckman T., Charlot S., Lemson G., Brinchmann J., Reichard T., Pasquali A., 2007, MNRAS, 381, 543
Wild V., Walcher C. J., Johansson P. H., Tresse L., Charlot S., Pollo A., F`evre O. L., de Ravel L., 2009, MNRAS, 395, 144 (WWJ09) Wild V. et al., 2014, MNRAS, 440, 1880 (WA14)
Wuyts S., Cox T. J., Hayward C. C., Franx M., Hernquist L., Hopkins P. F., Jonsson P., van Dokkum P. G., 2010, ApJ, 722, 1666
Yan R., Newman J. A., Faber S. M., Konidaris N., Koo D., Davis M., 2006, ApJ, 648, 281
Yang Y., Zabludoff A. I., Zaritsky D., Mihos J. C., 2008, ApJ, 688, 945 Zabludoff A. I., Zaritsky D., Lin H., Tucker D., Hashimoto Y., Shectman S.
A., Oemler A., Kirshner R. P., 1996, ApJ, 466, 104 Zolotov A. et al., 2015, MNRAS, 450, 2327
Zwaan M. A., Kuntschner H., Pracy M. B., Couch W. J., 2013, MNRAS, 432, 492
This paper has been typeset from a TEX/LATEX file prepared by the author.
at University of Nottingham on January 12, 2017
http://mnras.oxfordjournals.org/